Firms that are partially credit constrained measures the share of firms classified by the World Bank indicator IC.FRM.CRDC.PT.ZS as partially constrained in access to credit. The latest non-empty series contains 171 observations, including 62 from 2025, 48 from 2024, and 45 from 2023. Because the reference years differ, the 2025 same-year comparison is kept separate from the complete latest-value list.
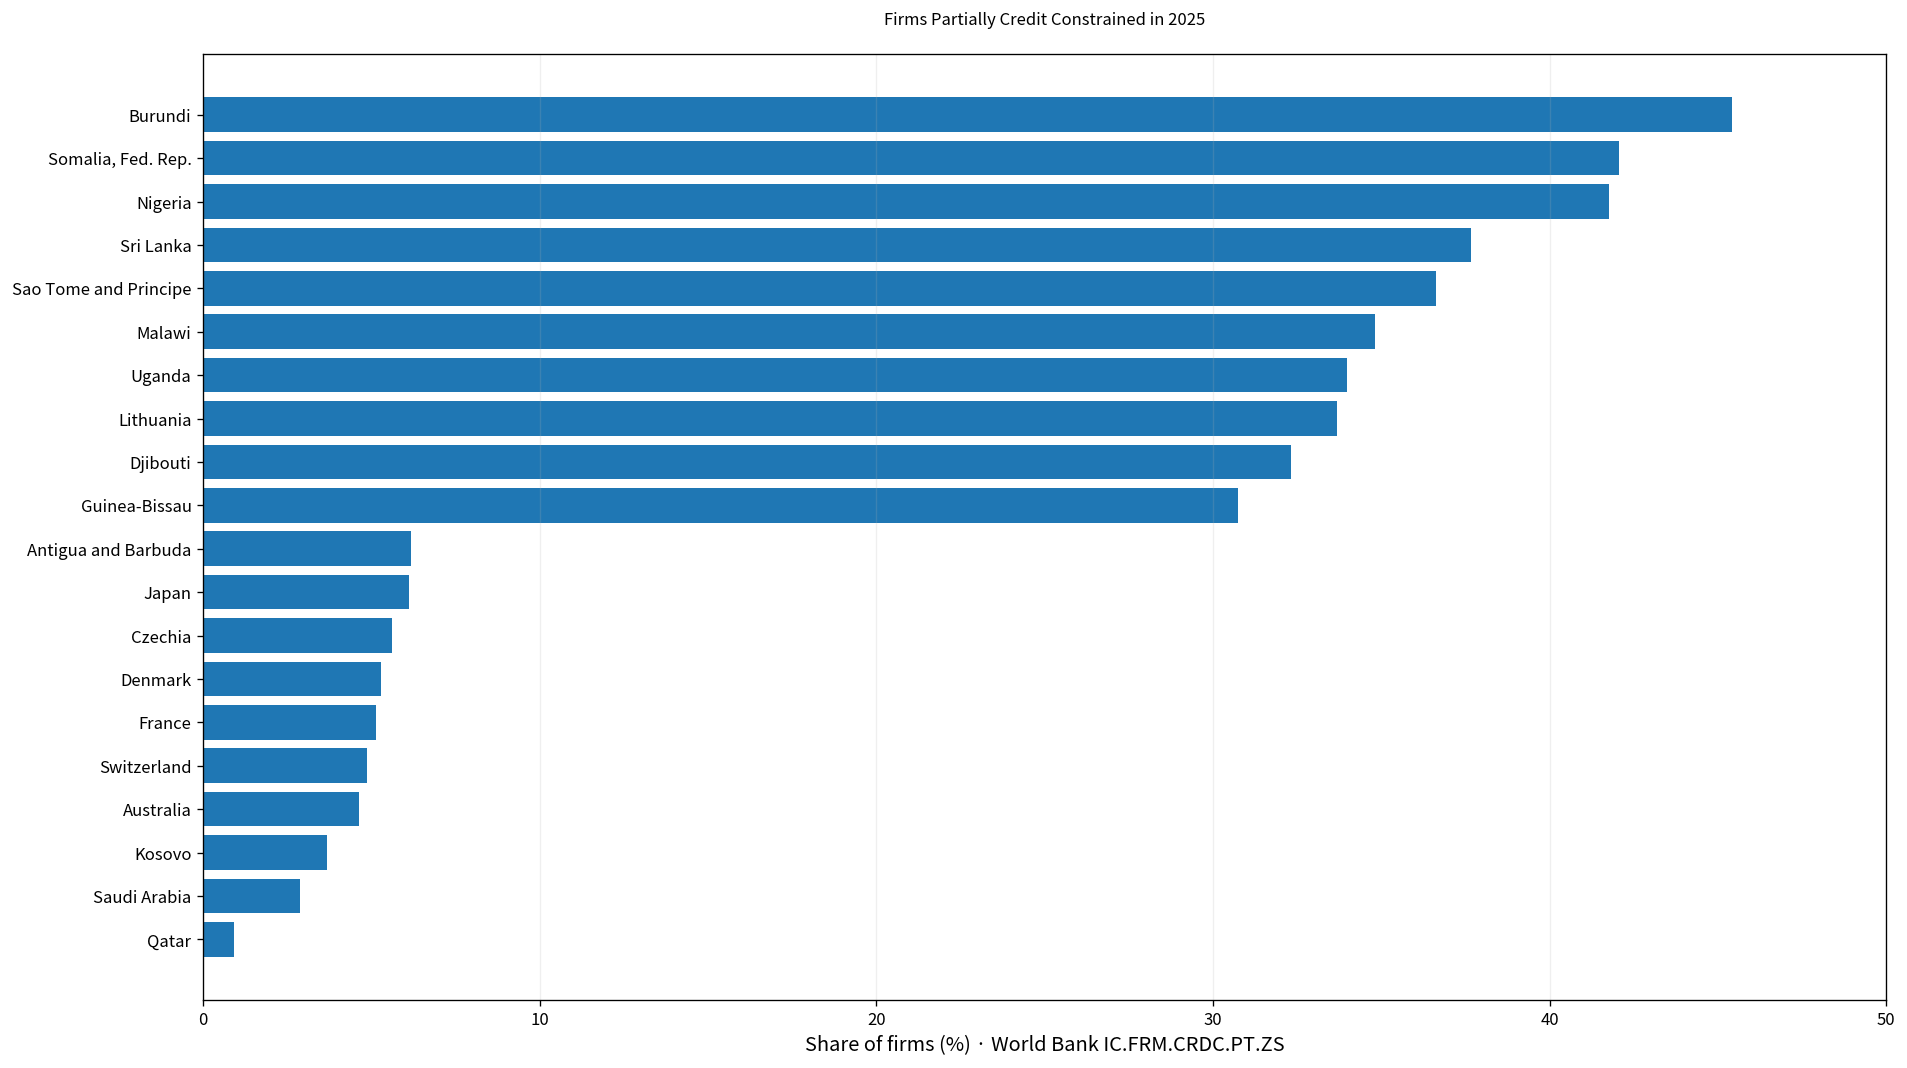
Table of Contents
Partially credit constrained does not mean completely excluded from credit
The most important word in the indicator is ‘partially.’ It should not be interpreted as the percentage of firms that cannot obtain any credit at all, and it is not the same as a loan-rejection rate. The measure reports the share of firms falling into the World Bank’s partially credit-constrained category.
A high value therefore does not mean every firm in the economy lacks finance, while a low value does not prove that credit is cheap or abundant. Lending rates, collateral requirements, bank access, firm size, sector composition, and reliance on internal finance are separate dimensions of business finance.
The 171 latest observations span 2013 to 2025
Among the 171 latest observations, 62 are dated 2025, 48 are from 2024, and 45 are from 2023. There are 4 observations from 2022 and a smaller number from earlier years. The oldest latest observation is from 2013.
| Observation year | Economies/territories | Share of 171 |
|---|---|---|
| 2025 | 62 | 36.3% |
| 2024 | 48 | 28.1% |
| 2023 | 45 | 26.3% |
| 2022 | 4 | 2.3% |
| 2021 | 1 | 0.6% |
| 2020 | 2 | 1.2% |
| 2019 | 3 | 1.8% |
| 2018 | 1 | 0.6% |
| 2017 | 1 | 0.6% |
| 2016 | 3 | 1.8% |
| 2013 | 1 | 0.6% |
The mixed-year collection has a mean of 16.82% and a median of 13.24%, with values ranging from 0.52% to 66.67%. Because firms were surveyed under different economic conditions and in different years, these figures should not be presented as a current global average.
The 2025 mean is 17.48% and the median is 13.05%
The 2025 subset contains 62 economies. The mean is 17.48% and the median 13.05%. The first quartile is 7.91% and the third quartile 28.03%, placing the middle half of the observations roughly between 7.9% and 28.0%.
21 observations are below 10% and 5 are below 5%. At the other end, 21 are at least 20%, 13 are at least 30%, and 3 are at least 40%. The upper tail is long relative to the median.
Burundi is highest in 2025 at 45.43%
Burundi records 45.43%, followed by Somalia, Fed. Rep. at 42.07% and Nigeria at 41.75%. Sri Lanka reaches 37.65%, Sao Tome and Principe 36.62%, Malawi 34.82%, Uganda 33.98%, Lithuania 33.70%, and Djibouti 32.32%.
| 2025 rank | Economy/territory | Partially credit constrained firms |
|---|---|---|
| 1 | Burundi | 45.43% |
| 2 | Somalia, Fed. Rep. | 42.07% |
| 3 | Nigeria | 41.75% |
| 4 | Sri Lanka | 37.65% |
| 5 | Sao Tome and Principe | 36.62% |
| 6 | Malawi | 34.82% |
| 7 | Uganda | 33.98% |
| 8 | Lithuania | 33.70% |
| 9 | Djibouti | 32.32% |
| 10 | Guinea-Bissau | 30.75% |
| 11 | Kenya | 30.70% |
| 12 | Comoros | 30.68% |
| 13 | Niger | 30.64% |
| 14 | Mozambique | 29.23% |
| 15 | Gabon | 29.01% |
High values mean that a larger share of firms falls into the partial-credit-constraint category. The indicator does not establish one cause. Financing demand, collateral, loan conditions, firm size and sector, and the structure of the financial system can all affect the result.
Qatar is lowest in 2025 at 0.91%
Qatar records 0.91%, followed by Saudi Arabia at 2.86%, Kosovo at 3.69%, Australia at 4.62%, and Switzerland at 4.87%. France is at 5.14%, Denmark 5.30%, Czechia 5.60%, Japan 6.11%, and Antigua and Barbuda 6.17%.
| Low-order position in 2025 | Economy/territory | Partially credit constrained firms |
|---|---|---|
| 1 | Qatar | 0.91% |
| 2 | Saudi Arabia | 2.86% |
| 3 | Kosovo | 3.69% |
| 4 | Australia | 4.62% |
| 5 | Switzerland | 4.87% |
| 6 | France | 5.14% |
| 7 | Denmark | 5.30% |
| 8 | Czechia | 5.60% |
| 9 | Japan | 6.11% |
| 10 | Antigua and Barbuda | 6.17% |
| 11 | Norway | 6.67% |
| 12 | Albania | 7.10% |
| 13 | Fiji | 7.11% |
| 14 | Kuwait | 7.26% |
| 15 | Finland | 7.48% |
A low value means fewer firms are classified as partially credit constrained. It does not show that every firm can borrow on favorable terms. Some firms may not apply for credit, borrowing costs may still be high, and other categories of financial constraint may exist.
The 2024 mean is 16.07% and the median is 12.26%
The 2024 subset contains 48 observations, with a mean of 16.07% and a median of 12.26%. Benin is highest at 66.67%, followed by Cameroon at 43.94% and Burkina Faso at 40.13%. Malta is lowest at 0.52%, followed by Ireland at 2.20% and Papua New Guinea at 3.46%.
| 2024 high-order position | Economy/territory | Share |
|---|---|---|
| 1 | Benin | 66.67% |
| 2 | Eswatini | 48.62% |
| 3 | Cameroon | 43.94% |
| 4 | Burkina Faso | 40.13% |
| 5 | South Sudan | 32.43% |
| 6 | Kazakhstan | 31.19% |
| 7 | Senegal | 28.67% |
| 8 | Mali | 26.39% |
| 9 | Jordan | 24.47% |
| 10 | Ecuador | 24.03% |
| 2024 low-order position | Economy/territory | Share |
|---|---|---|
| 1 | Malta | 0.52% |
| 2 | Sweden | 0.99% |
| 3 | Ireland | 2.20% |
| 4 | Papua New Guinea | 3.46% |
| 5 | United States | 4.50% |
| 6 | Slovenia | 4.60% |
| 7 | China | 4.79% |
| 8 | Tonga | 4.97% |
| 9 | Spain | 5.71% |
| 10 | Iceland | 6.01% |
The 2024 maximum is above the 2025 maximum, but that should not be described as evidence that credit constraints declined globally. The two yearly groups contain different economies. A trend comparison requires matched economies observed in both years.
The 2023 distribution is also wide
The 2023 subset contains 45 observations, with a mean of 16.49% and a median of 11.93%. Central African Republic is highest at 64.69%, followed by Gambia, The at 44.78%, Sierra Leone at 34.27%, Mexico at 33.18%, and Rwanda at 31.81%.
At the low end, Hong Kong SAR, China records 2.28%, Portugal 3.37%, Montenegro 4.00%, Singapore 4.51%, and Bosnia and Herzegovina 4.63%. As in 2025, the gap between economies is substantial.
Credit constraints and lending rates are different measures
The partial-credit-constraint rate describes how many firms fall into a constraint category. A lending rate is the price paid to borrow. Higher rates can contribute to financing difficulty, but the two measures need not move one-for-one.
Collateral requirements, approval probability, loan size, maturity, firm financial health, and internal financing can also shape credit access. A broader financing assessment should combine this indicator with lending rates, private-sector credit, collateral conditions, and firms’ use of external finance.
A high share does not summarize the entire business environment
Business finance is only one part of the operating environment. An economy with a high share of partially constrained firms can perform differently on infrastructure, taxes, regulation, labor, exports, or digital services. A low share also does not rule out serious problems elsewhere.
Survey composition and timing matter as well. Industries and firm sizes can have very different financing needs. The figure should therefore be interpreted as a survey-based business-finance measure rather than a complete description of the whole private sector.
Complete list of the 171 latest observations
The table below lists the latest non-empty observation for each economy and territory in alphabetical order. Rows not dated 2025 retain their original observation year. For a strict same-year comparison, use only the 2025 observations.
| Economy/territory | Observation year | Partially credit constrained firms |
|---|---|---|
| Afghanistan | 2025 | 17.96% |
| Albania | 2025 | 7.10% |
| Angola | 2024 | 8.91% |
| Antigua and Barbuda | 2025 | 6.17% |
| Argentina | 2017 | 21.48% |
| Armenia | 2024 | 22.04% |
| Australia | 2025 | 4.62% |
| Austria | 2025 | 9.44% |
| Azerbaijan | 2024 | 15.16% |
| Bahrain | 2024 | 11.81% |
| Bangladesh | 2022 | 22.12% |
| Barbados | 2023 | 9.15% |
| Belarus | 2018 | 7.56% |
| Belgium | 2025 | 9.43% |
| Belize | 2025 | 12.38% |
| Benin | 2024 | 66.67% |
| Bhutan | 2024 | 6.26% |
| Bolivia | 2025 | 22.13% |
| Bosnia and Herzegovina | 2023 | 4.63% |
| Botswana | 2023 | 12.11% |
| Brazil | 2025 | 13.72% |
| Brunei Darussalam | 2025 | 11.71% |
| Bulgaria | 2023 | 8.50% |
| Burkina Faso | 2024 | 40.13% |
| Burundi | 2025 | 45.43% |
| Cabo Verde | 2024 | 11.35% |
| Cambodia | 2023 | 10.41% |
| Cameroon | 2024 | 43.94% |
| Canada | 2024 | 6.92% |
| Central African Republic | 2023 | 64.69% |
| Chad | 2023 | 25.31% |
| Chile | 2025 | 11.46% |
| China | 2024 | 4.79% |
| Colombia | 2023 | 15.79% |
| Comoros | 2025 | 30.68% |
| Congo, Dem. Rep. | 2024 | 15.45% |
| Congo, Rep. | 2024 | 15.19% |
| Costa Rica | 2023 | 8.21% |
| Cote d’Ivoire | 2023 | 31.41% |
| Croatia | 2023 | 9.01% |
| Cyprus | 2024 | 10.17% |
| Czechia | 2025 | 5.60% |
| Denmark | 2025 | 5.30% |
| Djibouti | 2025 | 32.32% |
| Dominican Republic | 2025 | 25.64% |
| Ecuador | 2024 | 24.03% |
| Egypt, Arab Rep. | 2025 | 15.49% |
| El Salvador | 2023 | 19.13% |
| Equatorial Guinea | 2024 | 11.62% |
| Estonia | 2023 | 9.21% |
| Eswatini | 2024 | 48.62% |
| Ethiopia | 2025 | 26.23% |
| Fiji | 2025 | 7.11% |
| Finland | 2025 | 7.48% |
| France | 2025 | 5.14% |
| Gabon | 2025 | 29.01% |
| Gambia, The | 2023 | 44.78% |
| Georgia | 2023 | 4.81% |
| Germany | 2025 | 7.81% |
| Ghana | 2023 | 27.49% |
| Greece | 2023 | 10.58% |
| Grenada | 2025 | 8.19% |
| Guatemala | 2025 | 8.39% |
| Guinea | 2025 | 28.63% |
| Guinea-Bissau | 2025 | 30.75% |
| Honduras | 2016 | 35.53% |
| Hong Kong SAR, China | 2023 | 2.28% |
| Hungary | 2023 | 11.76% |
| Iceland | 2024 | 6.01% |
| India | 2025 | 11.73% |
| Indonesia | 2023 | 12.39% |
| Iraq | 2022 | 14.83% |
| Ireland | 2024 | 2.20% |
| Israel | 2024 | 14.58% |
| Italy | 2024 | 18.69% |
| Jamaica | 2024 | 24.01% |
| Japan | 2025 | 6.11% |
| Jordan | 2024 | 24.47% |
| Kazakhstan | 2024 | 31.19% |
| Kenya | 2025 | 30.70% |
| Kiribati | 2025 | 12.11% |
| Korea, Rep. | 2024 | 12.48% |
| Kosovo | 2025 | 3.69% |
| Kuwait | 2025 | 7.26% |
| Kyrgyz Republic | 2023 | 10.60% |
| Lao PDR | 2024 | 14.03% |
| Latvia | 2024 | 15.21% |
| Lebanon | 2019 | 14.72% |
| Lesotho | 2023 | 23.82% |
| Liberia | 2025 | 10.53% |
| Lithuania | 2025 | 33.70% |
| Luxembourg | 2020 | 6.49% |
| Madagascar | 2022 | 26.86% |
| Malawi | 2025 | 34.82% |
| Malaysia | 2024 | 11.16% |
| Maldives | 2025 | 17.40% |
| Mali | 2024 | 26.39% |
| Malta | 2024 | 0.52% |
| Mauritania | 2025 | 19.96% |
| Mauritius | 2023 | 16.50% |
| Mexico | 2023 | 33.18% |
| Moldova | 2024 | 13.24% |
| Mongolia | 2025 | 25.00% |
| Montenegro | 2023 | 4.00% |
| Morocco | 2023 | 18.19% |
| Mozambique | 2025 | 29.23% |
| Myanmar | 2016 | 15.21% |
| Namibia | 2024 | 19.93% |
| Nepal | 2023 | 26.71% |
| Netherlands | 2025 | 9.97% |
| New Zealand | 2023 | 5.02% |
| Nicaragua | 2016 | 20.59% |
| Niger | 2025 | 30.64% |
| Nigeria | 2025 | 41.75% |
| North Macedonia | 2023 | 8.41% |
| Norway | 2025 | 6.67% |
| Pakistan | 2022 | 15.24% |
| Panama | 2025 | 14.13% |
| Papua New Guinea | 2024 | 3.46% |
| Paraguay | 2023 | 18.48% |
| Peru | 2023 | 13.29% |
| Philippines | 2023 | 10.85% |
| Poland | 2025 | 12.29% |
| Portugal | 2023 | 3.37% |
| Qatar | 2025 | 0.91% |
| Romania | 2023 | 11.93% |
| Russian Federation | 2019 | 32.52% |
| Rwanda | 2023 | 31.81% |
| Samoa | 2023 | 27.34% |
| Sao Tome and Principe | 2025 | 36.62% |
| Saudi Arabia | 2025 | 2.86% |
| Senegal | 2024 | 28.67% |
| Serbia | 2024 | 12.05% |
| Seychelles | 2023 | 13.33% |
| Sierra Leone | 2023 | 34.27% |
| Singapore | 2023 | 4.51% |
| Slovak Republic | 2023 | 10.66% |
| Slovenia | 2024 | 4.60% |
| Solomon Islands | 2025 | 19.88% |
| Somalia, Fed. Rep. | 2025 | 42.07% |
| South Africa | 2020 | 3.23% |
| South Sudan | 2024 | 32.43% |
| Spain | 2024 | 5.71% |
| Sri Lanka | 2025 | 37.65% |
| St. Lucia | 2025 | 18.93% |
| St. Vincent and the Grenadines | 2025 | 10.39% |
| Suriname | 2025 | 20.30% |
| Sweden | 2024 | 0.99% |
| Switzerland | 2025 | 4.87% |
| Tajikistan | 2024 | 7.00% |
| Tanzania | 2023 | 11.58% |
| Thailand | 2025 | 10.02% |
| Timor-Leste | 2021 | 6.27% |
| Togo | 2023 | 23.58% |
| Tonga | 2024 | 4.97% |
| Trinidad and Tobago | 2025 | 10.11% |
| Tunisia | 2024 | 18.38% |
| Turkiye | 2024 | 9.54% |
| Turkmenistan | 2024 | 8.02% |
| Uganda | 2025 | 33.98% |
| Ukraine | 2019 | 22.28% |
| United Kingdom | 2024 | 8.62% |
| United States | 2024 | 4.50% |
| Uruguay | 2024 | 10.03% |
| Uzbekistan | 2024 | 15.36% |
| Vanuatu | 2023 | 10.28% |
| Viet Nam | 2023 | 17.98% |
| West Bank and Gaza | 2023 | 10.71% |
| Yemen, Rep. | 2013 | 14.05% |
| Zambia | 2025 | 16.44% |
| Zimbabwe | 2025 | 15.84% |
How to interpret the comparison
First, the 171 latest observations do not all share one year. Second, partially credit constrained is not the same as completely unable to obtain credit. Third, a low value does not prove that overall financing conditions are easy. Fourth, annual averages should not be treated as a time trend unless the same economies are matched across years.
Country-level interpretation is stronger when this measure is combined with interest rates, collateral requirements, loan size, external-finance use, firm size, and industry composition. Survey timing and sample structure also matter.
Source and calculation
The source is World Bank World Development Indicators IC.FRM.CRDC.PT.ZS, Firms that are partially credit constrained (% of firms). The 2025 mean, median, quartiles, threshold counts, and rankings are calculated from the 62 observations dated 2025.
Frequently Asked Questions
Does partially credit constrained mean a firm cannot obtain any credit?
No. It is a specific partial-constraint category and is not the same as complete credit exclusion or a loan-rejection rate.
What is the 2025 median?
The median across the 62 observations dated 2025 is 13.05%, while the mean is 17.48%.
Does a low share mean business financing conditions are good overall?
No. Lending rates, collateral, whether firms seek credit, firm size, and other forms of financial constraint also matter.
Related Articles
Green Map creates custom-edited map images using open geographic data sources such as geoBoundaries, Natural Earth, OpenStreetMap, and government open data. These maps are edited visual materials, not raw data files, and are provided for education, documents, presentations, and graphic reference.