Valley County stretches across a large part of northeastern Montana, from Glasgow and the Milk River corridor to the Missouri River, Fort Peck Lake, and the higher country near the Canadian border. The maps show a county with very different geographic zones: towns and highways cluster in the lower central corridor, long reservoir bays shape the south, and broad uplands rise across the north and northeast. Looking at those features together gives a much clearer picture of the county than the boundary alone. High-resolution map files are available for download in the section below.
This page includes maps of county boundaries and roads, major-city connections, waterways and terrain, and elevation. The maps can be viewed directly in the article, and the four original high-resolution JPG files are also available together in a ZIP for printing, classroom use, or personal reference.
Table of Contents
Valley County from the Saskatchewan border to Fort Peck Lake
Valley County is in northeastern Montana, with the Canadian province of Saskatchewan along its northern edge. Daniels and Roosevelt Counties lie to the east, Phillips County is to the west, and the southern side meets the Missouri River, Fort Peck Lake, and parts of Garfield and McCone Counties. The county’s official growth policy identifies Glasgow as the county seat and principal retail and service center, a role that matches its central position on the supplied maps.
The outline changes character from north to south. Much of the northern boundary is angular and comparatively simple, while the southern edge bends around river and reservoir shorelines. Long bays from Fort Peck Lake reach northward into the county, making the bottom edge particularly irregular. That shape is important when estimating travel because locations that appear close in a straight line can be separated by water, steep drainages, or roads that have to make long detours.
U.S. 2 and Glasgow form the county’s main central corridor
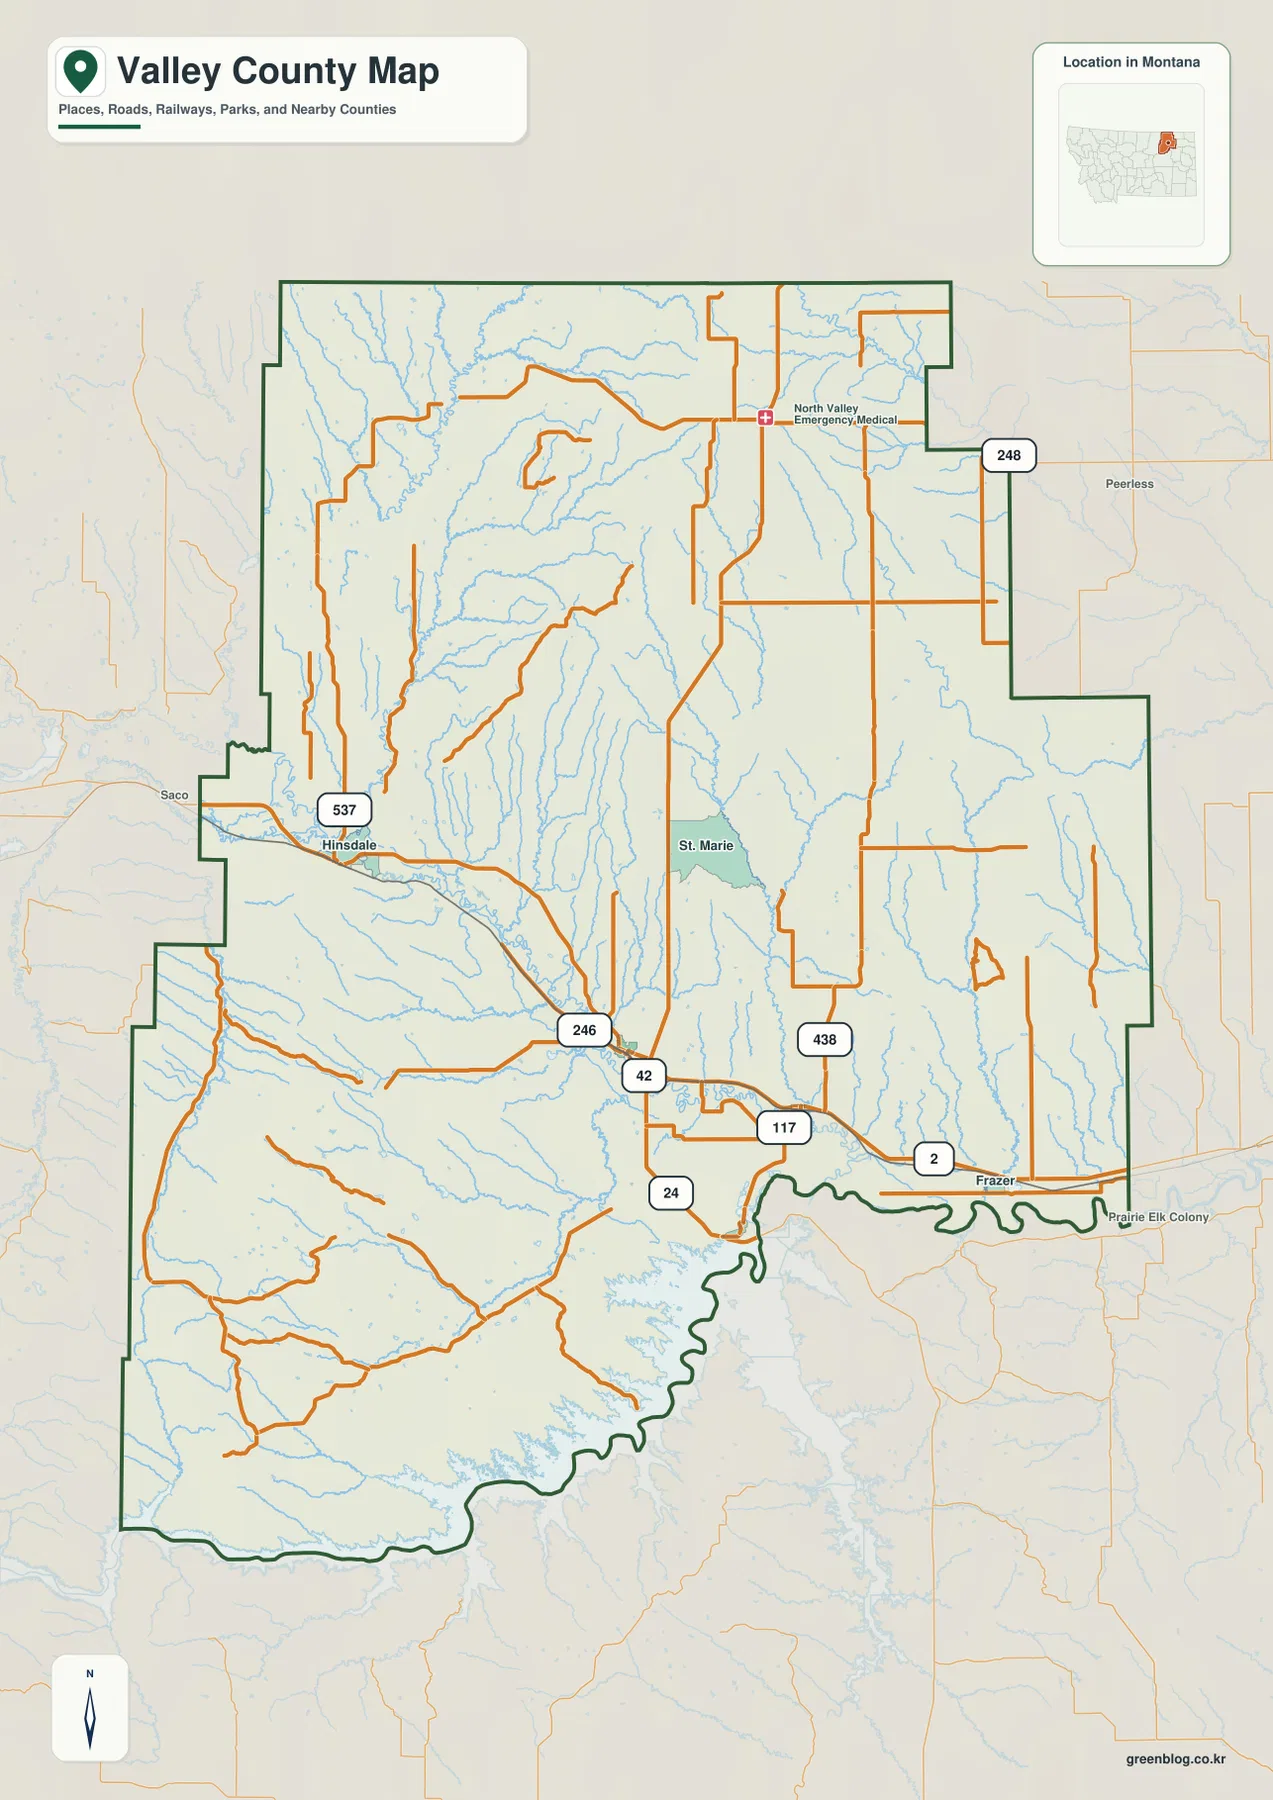
The general county map is anchored by U.S. 2, which crosses the central part of Valley County from the Hinsdale area through Glasgow and toward Nashua and Frazer. Around Glasgow, the highway meets roads that extend north and south, including routes marked 24 and 42. Route 24 provides an important northward connection toward St. Marie and the Opheim area, while the east-west highway keeps the central communities linked across a very wide county.
Hinsdale appears near the Milk River on the western side, while Frazer and Prairie Elk Colony are labeled toward the southeast along the U.S. 2 corridor. St. Marie sits farther north in the interior. Other numbered roads on the map include 246, 248, 438, and 537, illustrating that travel away from Glasgow depends on a smaller set of long north-south and rural routes rather than a dense street network.
The map is useful for orientation, but it should not be treated as a live road-status product. Seasonal conditions, construction, surface type, and temporary closures are not shown. For an actual drive across the county, especially on rural roads north or south of the main highway, current transportation and routing information should be checked before departure.
Glasgow, Nashua, Fort Peck, and Opheim are separated by very different distances
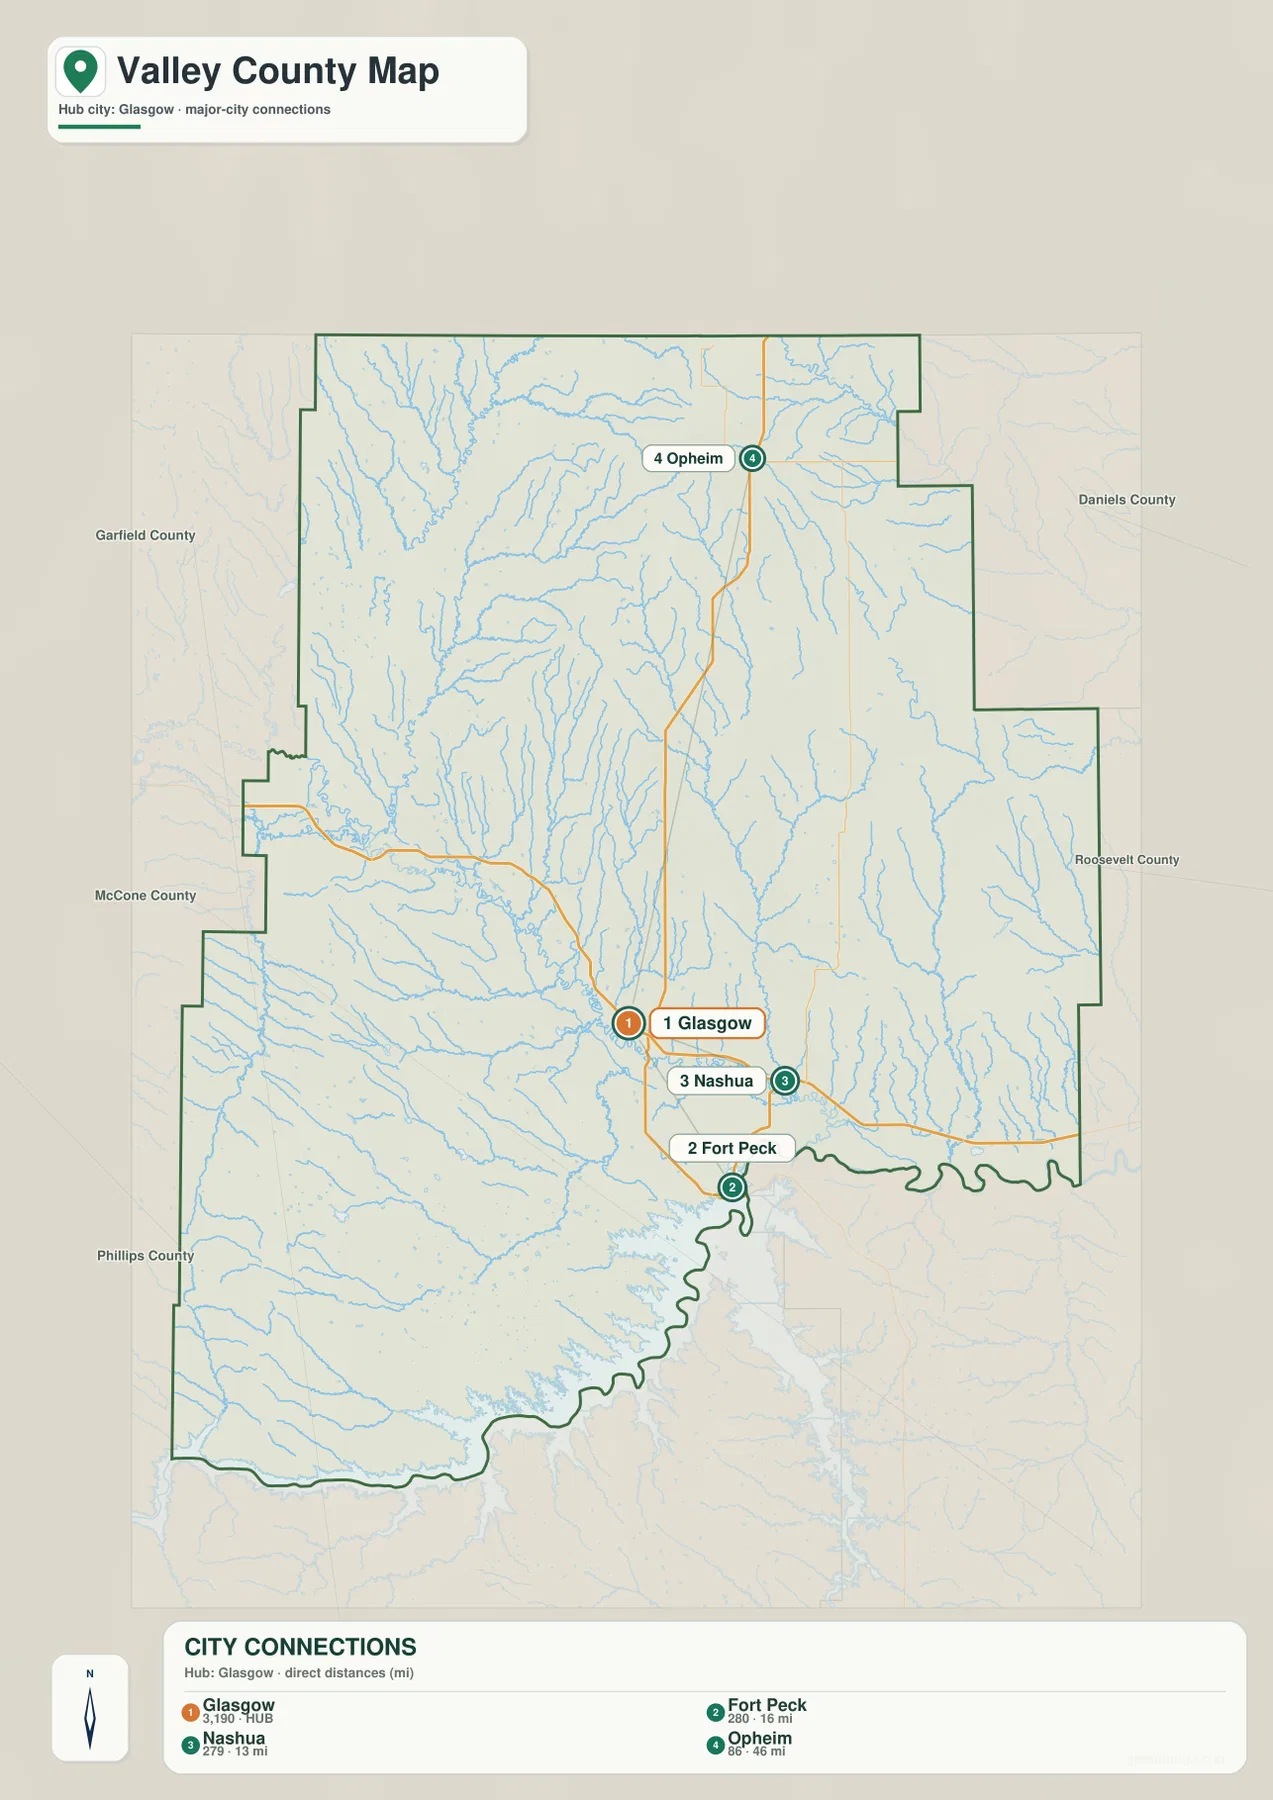
The city-connection map uses Glasgow as the hub and compares it with Fort Peck, Nashua, and Opheim. The displayed distances are straight-line measurements: about 13 miles from Glasgow to Nashua, 16 miles to Fort Peck, and 46 miles to Opheim. They are not driving distances, so road mileage will be longer and can vary depending on the route used.
Nashua and Fort Peck sit relatively close to Glasgow in the central and southern part of the county, while Opheim is far to the north near the Canadian border. This contrast is one of the most useful pieces of information in the city map because it shows how a single county can contain both a compact central group of communities and a much more remote northern municipality. The Valley County growth policy identifies Glasgow, Fort Peck, Nashua, and Opheim as the county’s four incorporated municipalities.
Comparing this map with the road layer adds another level of context. Glasgow and Nashua are tied to the U.S. 2 corridor, whereas a trip toward Opheim turns north through a much less densely settled part of the county. Fort Peck lies near the Missouri River and the Fort Peck Lake system, so water and shoreline geography become especially important when understanding its setting.
The Milk River and Missouri River organize the central and southern landscape
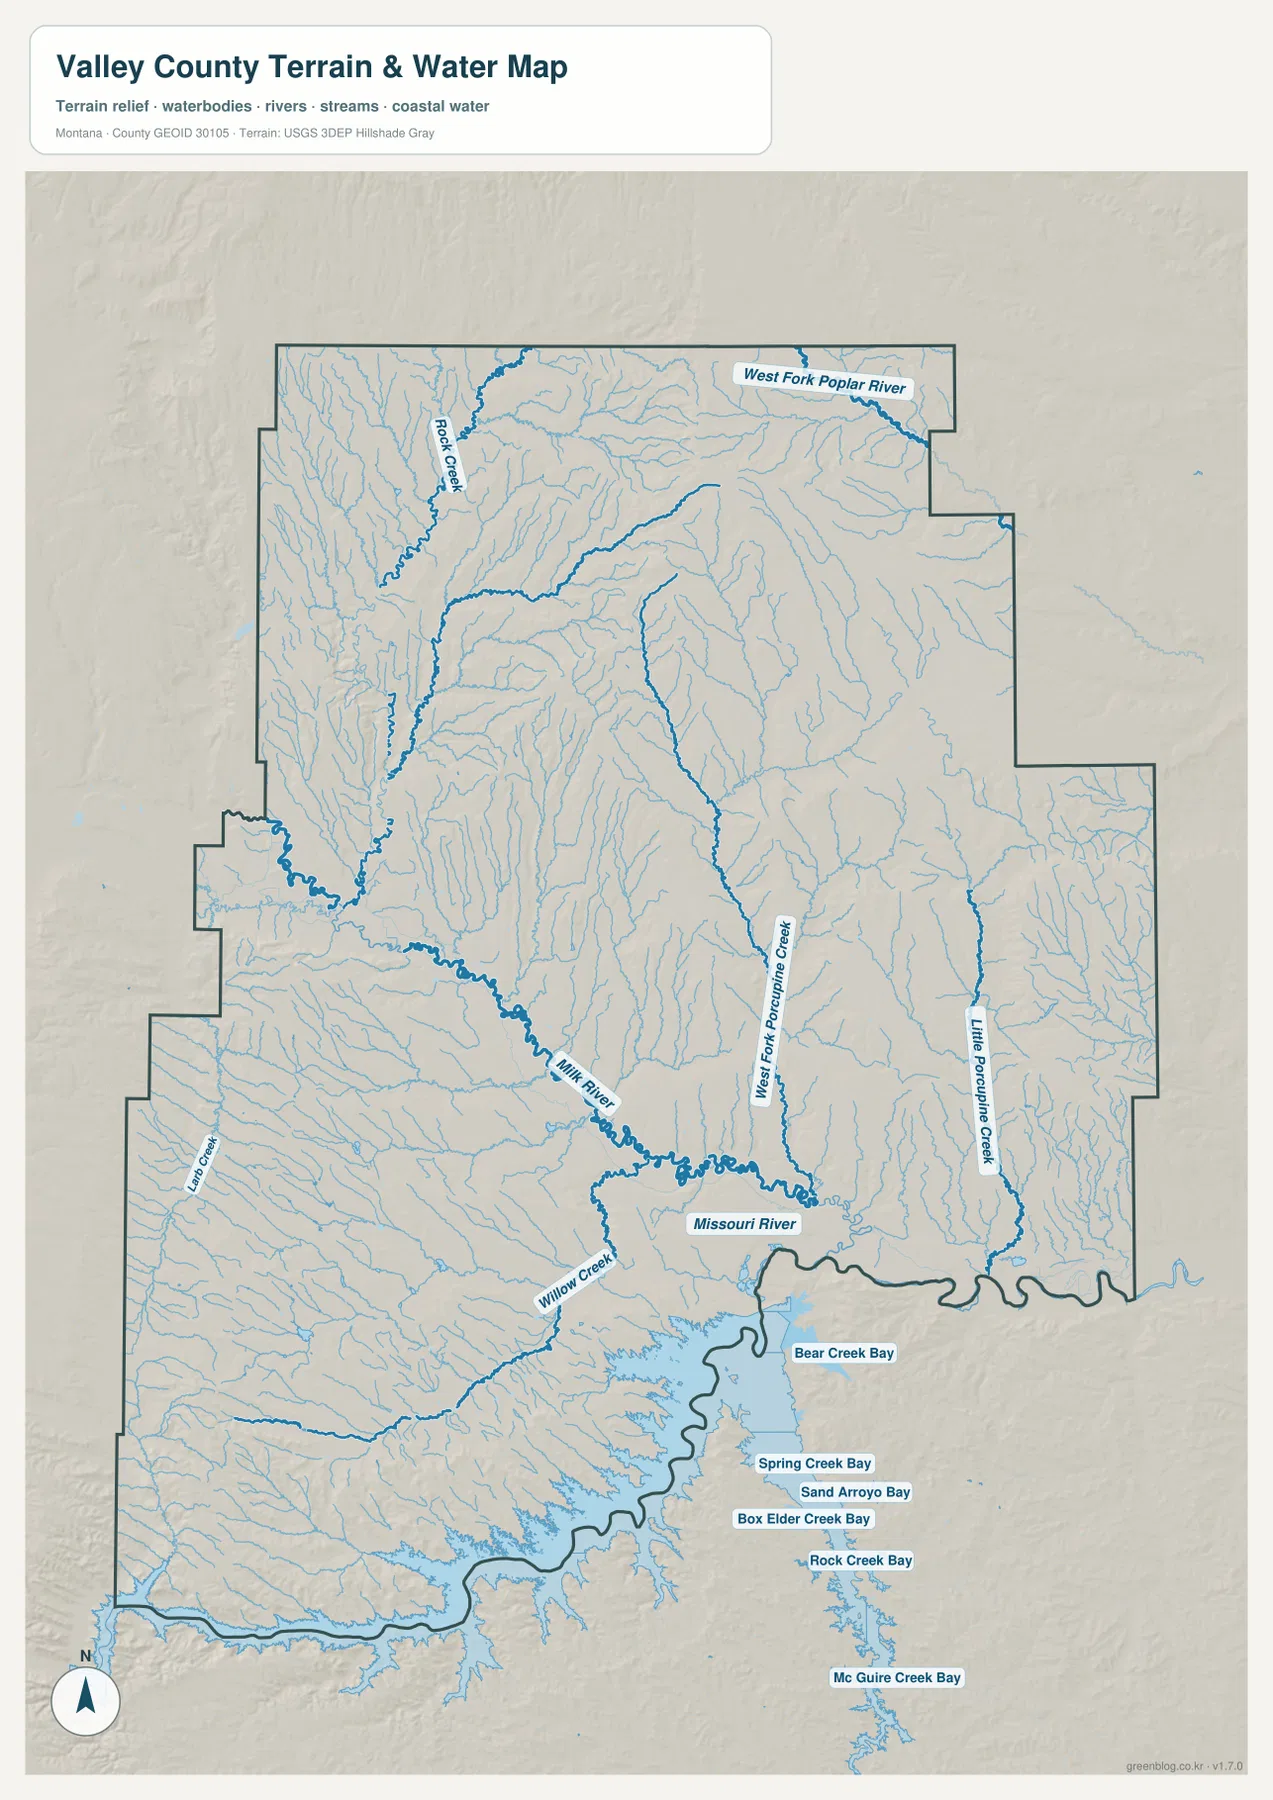
The Milk River is the most prominent waterway across the central part of the county. It enters from the west and follows a broad low corridor toward Glasgow and the Missouri River system. Willow Creek approaches from the southwest, while Rock Creek and many smaller tributaries descend from the higher country to the north. The concentration of roads and communities near this lower river corridor is easy to see when the water map is compared with the county map.
Farther south, the Missouri River curves along the county’s lower edge and Fort Peck Lake sends long reservoir arms into the surrounding valleys. Bear Creek Bay, Spring Creek Bay, Sand Arroyo Bay, Box Elder Creek Bay, Rock Creek Bay, and Mc Guire Creek Bay are all labeled on the supplied map. These bays make the shoreline extremely irregular, which helps explain why simple straight-line measurements are often poor guides to actual travel around the reservoir.
The northern drainage network is different. West Fork Poplar River crosses the north and northeast, while West Fork Porcupine Creek and Little Porcupine Creek run through the eastern interior. These streams drain the higher uplands rather than the broad Milk-Missouri lowlands. The water map is intended for geographic reference only; it is not a floodplain map, water-right record, navigation chart, or legal boundary survey.
Elevation rises from 606-meter river lowlands to 1,009-meter northern uplands
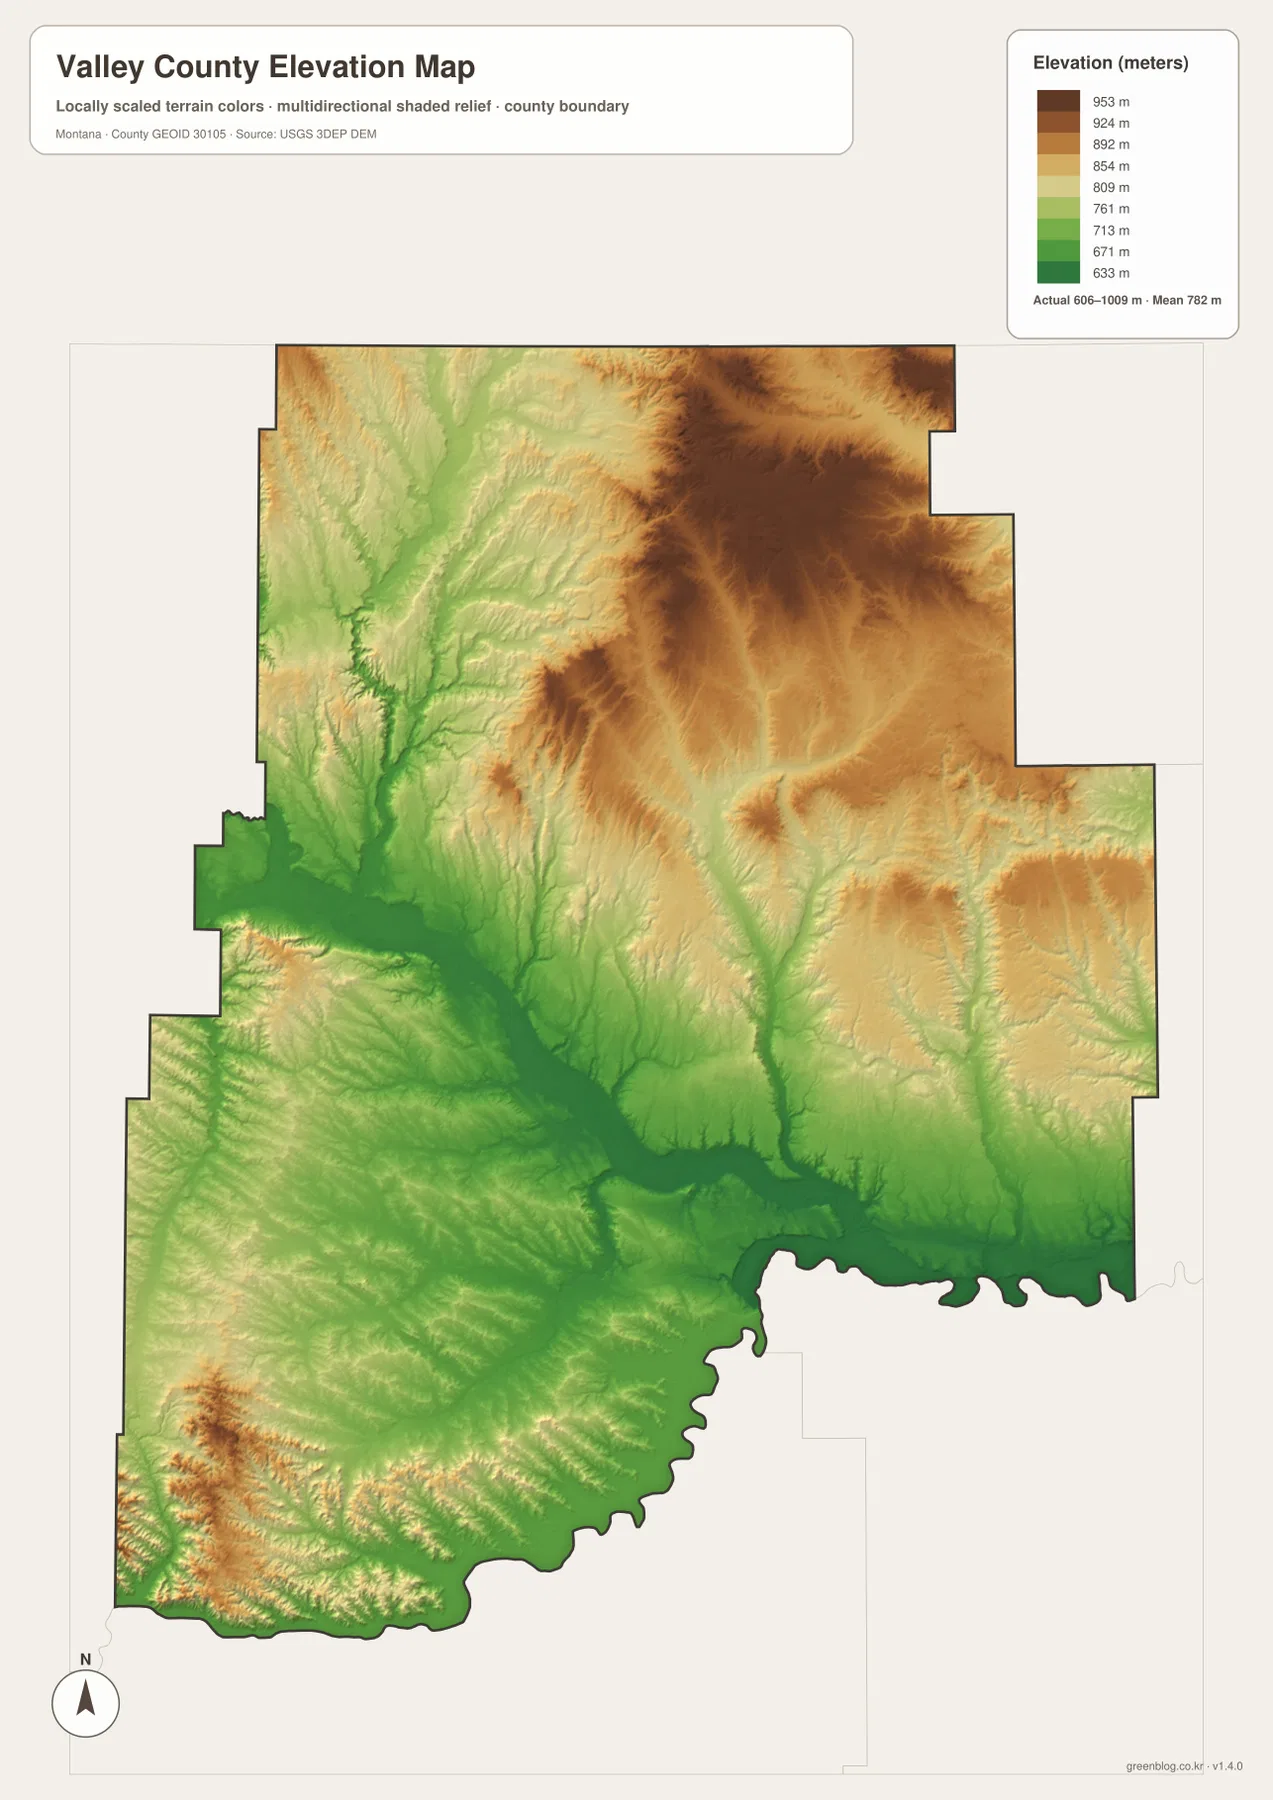
The elevation map reports an actual range of roughly 606 to 1,009 meters, with a mean near 782 meters. The lowest greens follow the Milk River corridor and the Missouri River-Fort Peck Lake area. Glasgow and Nashua sit near this lower central band, which is noticeably different from the higher terrain north of the main highway.
Brown and darker tan colors spread across the northern and northeastern sections, especially in the broad uplands south and west of Opheim and toward the northeast corner. Narrow green valleys cut through those higher areas as streams descend toward larger drainage systems. The north-central transition is particularly clear, where elevated ground falls toward the Milk River corridor through a dense network of small valleys.
Some higher ridges also appear in the far southwest, but the largest continuous high area is in the north. The colors are locally scaled to show differences within Valley County, so the same shade on another county map may represent a different elevation. The surface is generalized and should not be used as survey-grade data for construction, drainage engineering, property work, or other precision tasks.
Why the lower river corridor holds more roads and communities
Reading the road, city, water, and elevation layers together shows why Glasgow functions as the county’s practical center. U.S. 2 follows the lower Milk River corridor, Glasgow sits within that corridor, and Nashua lies nearby to the east. Roads to Fort Peck also remain close to the lower Missouri system. The combination of lower relief and a continuous east-west route creates a very different setting from the broad uplands farther north.
Opheim illustrates the other side of Valley County’s geography. It is about 46 straight-line miles from Glasgow and lies in the northern high country rather than the Milk River lowland. Streams there feed the Poplar and Porcupine systems, and the road network is thinner. This does not divide the county into strict geographic halves, but it does show why travel direction, water drainage, and settlement patterns vary substantially within one jurisdiction.
Fort Peck Lake requires a different way of judging distance
The southern reservoir shoreline is one of the most distinctive features on the Valley County maps. Long bays extend north from Fort Peck Lake into former creek valleys, creating peninsulas and narrow inlets that interrupt direct east-west or north-south movement. Two points can appear close on the page while the usable road route between them is much longer.
Named inlets such as Bear Creek Bay, Spring Creek Bay, Box Elder Creek Bay, and Rock Creek Bay provide useful reference points for understanding the shoreline. They are geographic labels, not a substitute for marina information, boating charts, current lake levels, or access notices. Anyone planning travel or recreation at Fort Peck Lake should pair this overview with current information from the responsible management agencies.
How the county reached its present boundaries
Valley County was created in 1893 from the northern part of Dawson County, with Glasgow selected as the county seat. The official county growth policy notes that its original territory was much larger than today’s county. Later divisions created Sheridan County in 1913, Phillips County in 1915, Roosevelt County in 1919, and Daniels County in 1920.
That history helps explain the present relationship between Valley County and its neighbors. Glasgow developed as a railroad town, and the construction of Fort Peck Dam in the 1930s brought another major period of regional growth. On today’s maps, the railroad history is less visually dominant than the roads, rivers, and reservoir, but it provides useful background for understanding why Glasgow became the county’s administrative and service center.
Choosing the most useful Valley County map for your purpose
Use the general county map when you need roads, community locations, and the outer boundary in one view. Glasgow and U.S. 2 provide a simple orientation line for finding Hinsdale, Nashua, Frazer, and St. Marie. The city-connection map is better when the main question is how Glasgow relates to Fort Peck, Nashua, and the much more distant Opheim.
For physical geography, the water and elevation maps work best as a pair. The water map shows how the Milk River, Missouri River, Fort Peck Lake, Poplar drainage, and Porcupine creeks fit together. The elevation map then explains the broad contrast between low central and southern corridors and the higher northern terrain. Using the two together prevents the drainage network from looking like a collection of unrelated blue lines.
Frequently Asked Questions
Why is Opheim much farther from Glasgow than Nashua or Fort Peck?
Glasgow sits in the central Milk River and U.S. 2 corridor, while Opheim is far north near the Canadian border. The city map gives a straight-line distance of about 46 miles between Glasgow and Opheim, compared with about 13 miles to Nashua and 16 miles to Fort Peck. Road distance is longer than the straight-line value.
Why can travel around Fort Peck Lake be much longer than it looks on the map?
Long reservoir arms such as Bear Creek Bay, Spring Creek Bay, Box Elder Creek Bay, and Rock Creek Bay cut deeply into the shoreline. Two places may look close across water while the available road has to travel around an inlet or ridge. Use current routing and access information when planning a trip near the lake.
Are the 13-, 16-, and 46-mile city distances driving distances?
No. They are straight-line distances from Glasgow: approximately 13 miles to Nashua, 16 miles to Fort Peck, and 46 miles to Opheim. Actual driving distance depends on the road network and the exact starting and ending points.
Map File Information
The ZIP contains the original high-resolution JPG files for the Valley County boundary and road map, city-connection map, terrain and water map, and elevation map.
- Included Files: Use only the versions confirmed in the article and supplied images
- File Type: Use the confirmed download contents
- Intended Use: Printing, education, presentations, and map-based projects
Related Maps
Sources and references
- Valley County official website
- Valley County Growth Policy Update
- U.S. Census Bureau TIGER/Line Shapefiles
- USGS National Hydrography
- USGS 3D Elevation Program
These maps are intended for geographic reference. For legal boundaries, land ownership, flood determinations, water rights, navigation, construction, surveying, or other decisions requiring current authoritative information, consult Valley County and the responsible state or federal agency.
Green Map creates custom-edited map images using open geographic data sources such as geoBoundaries, Natural Earth, OpenStreetMap, and government open data. These maps are edited visual materials, not raw data files, and are provided for education, documents, presentations, and graphic reference.