Households and NPISHs final consumption expenditure growth measures the annual real change in spending used for final consumption by households and nonprofit institutions serving households. The verified World Bank file contains 178 latest non-empty observations, but they are not all from one year. 130 observations are dated 2025 and 31 are dated 2024, while the rest are older latest-available values. For that reason, the full latest-observation list and the 2025 same-year comparison should be read as two different views.
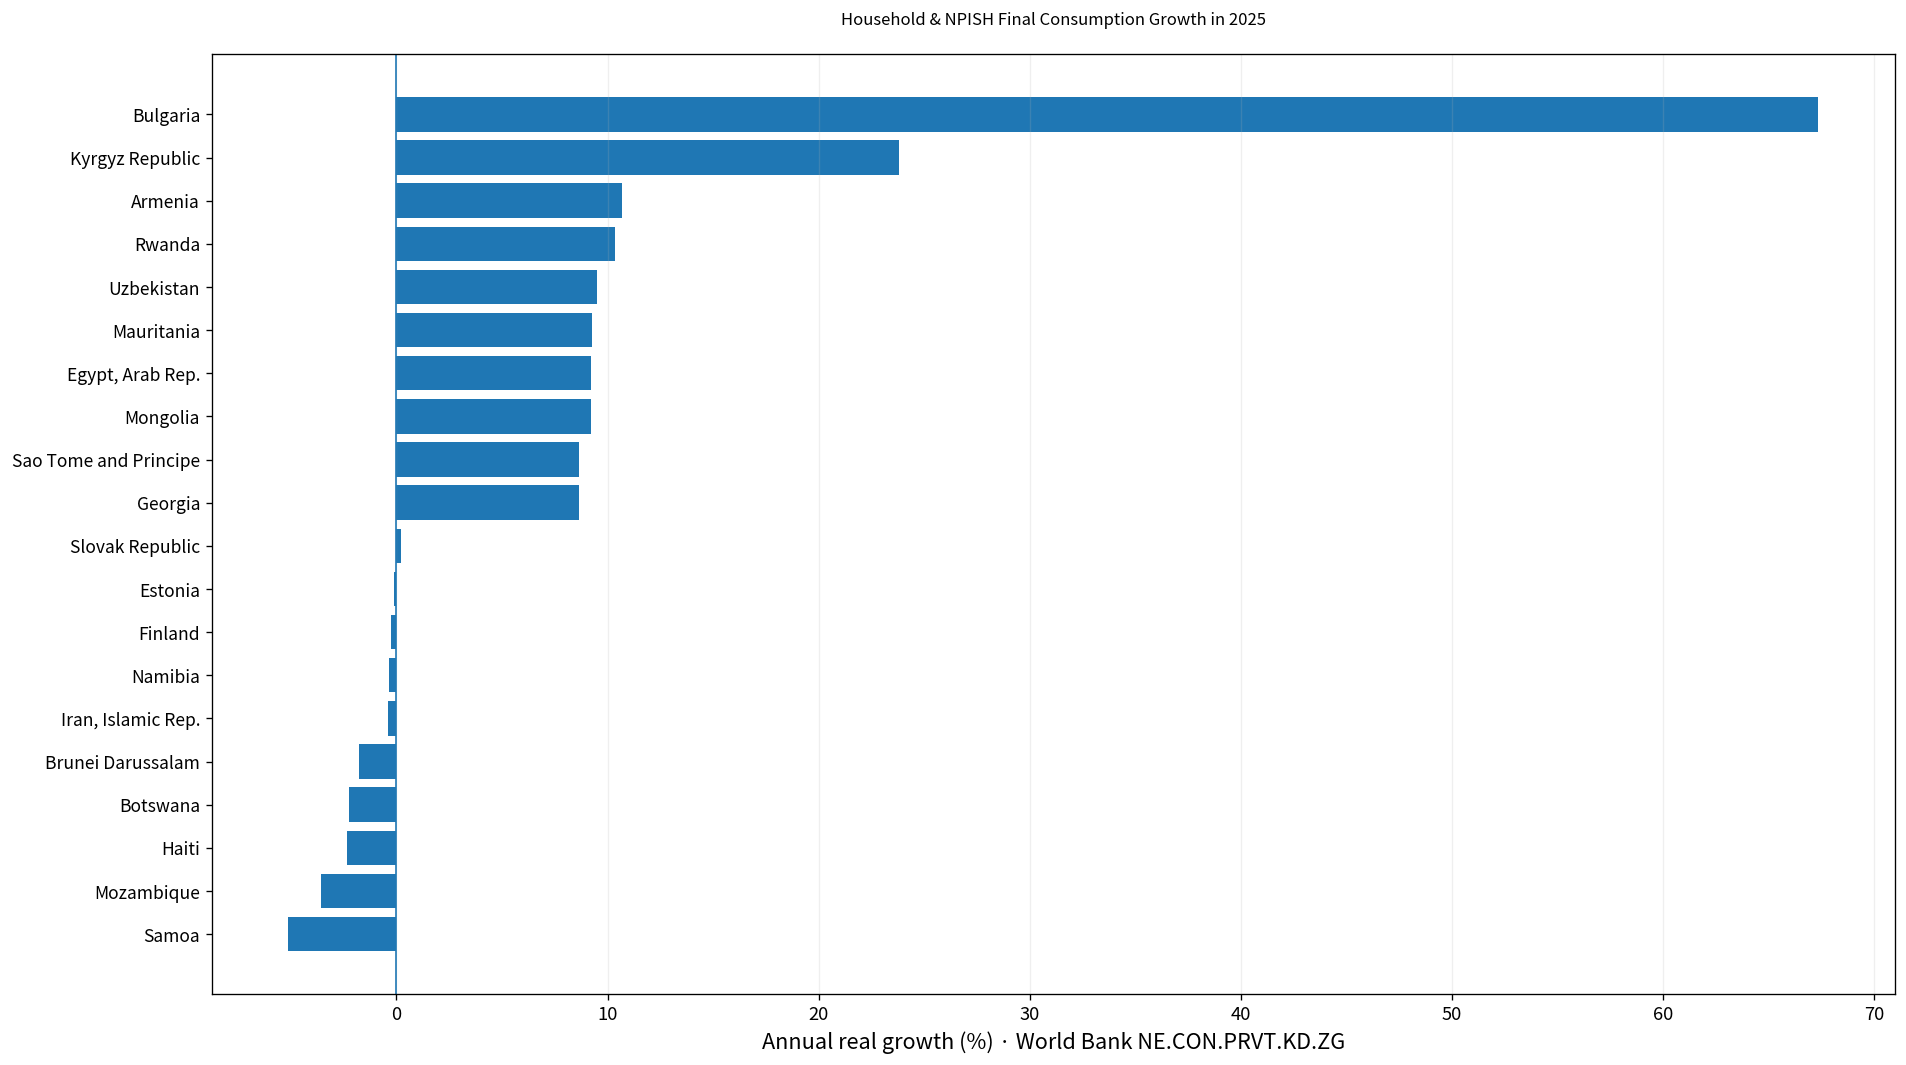
Table of Contents
What household and NPISH final consumption growth measures
The indicator reports a growth rate rather than a level of spending. Households purchase goods and services for final use, while NPISHs are nonprofit institutions that serve households. A value of 4% means the real volume of this final consumption expenditure increased by about 4% from the previous year. It does not say how many dollars households spent, how much was spent per person, or what share of GDP consumption represented.
Household consumption growth is also not the same as overall GDP growth. Government consumption, investment, inventories and net exports can move differently from private consumption. A country can have strong household consumption growth and weaker GDP growth if other components are soft, or the reverse if investment or exports are particularly strong. The comparison here therefore stays focused on the verified consumption-growth indicator itself.
The 178 latest observations span multiple years
The verified file holds the latest non-empty value for 178 economies and territories. The largest group is 2025 with 130 observations, followed by 2024 with 31, 2023 with 4, and 2022 with 5. A small number of latest observations are older, extending through 2020, 2018, 2016, 2014, 2012, 2011, 2004 and 1991. The year label is therefore essential whenever the full set is displayed.
| Observation year | Economies/territories | Share of 178 |
|---|---|---|
| 2025 | 130 | 73.0% |
| 2024 | 31 | 17.4% |
| 2023 | 4 | 2.2% |
| 2022 | 5 | 2.8% |
| 2020 | 1 | 0.6% |
| 2018 | 1 | 0.6% |
| 2016 | 1 | 0.6% |
| 2014 | 1 | 0.6% |
| 2012 | 1 | 0.6% |
| 2011 | 1 | 0.6% |
| 2004 | 1 | 0.6% |
| 1991 | 1 | 0.6% |
Across the mixed-year set, the simple mean is 6.53% and the median is 3.28%. There are 159 positive values and 19 negative values. The mean is heavily influenced by Eritrea’s 2011 observation of 459.21%, which is far outside the center of the distribution. These mixed-year statistics should not be described as a 2025 world average.
The 2025 median is 3.26% across 130 observations
Restricting the data to the same year gives 130 observations for 2025. Their median is 3.26% and the simple mean is 4.16%. The first quartile is 2.14% and the third quartile is 4.99%, so the middle half lies roughly between those values. 121 observations are positive and 9 are negative.
31 of the 2025 observations are at or above 5%, while 4 are at or above 10%. Bulgaria’s 67.34% observation is a very large upper-tail outlier and raises the simple mean. If Bulgaria is excluded, the mean for the remaining 129 observations is about 3.67%. That is why the median and interquartile range are more informative than the mean alone when describing the center of this distribution.
Bulgaria is the highest 2025 observation at 67.34%
Bulgaria records 67.34% in 2025, far above the second-highest value of 23.79% in Kyrgyz Republic. Armenia and Rwanda are also above 10%, while Uzbekistan, Mauritania, Egypt, Arab Rep., Mongolia, Sao Tome and Principe and Georgia are among the higher observations. This ranking orders annual real consumption-growth rates; it is not a ranking of household spending levels, income levels or living standards.
| 2025 rank | Economy | Household & NPISH consumption growth |
|---|---|---|
| 1 | Bulgaria | 67.34% |
| 2 | Kyrgyz Republic | 23.79% |
| 3 | Armenia | 10.70% |
| 4 | Rwanda | 10.34% |
| 5 | Uzbekistan | 9.49% |
| 6 | Mauritania | 9.26% |
| 7 | Egypt, Arab Rep. | 9.21% |
| 8 | Mongolia | 9.20% |
| 9 | Sao Tome and Principe | 8.66% |
| 10 | Georgia | 8.63% |
| 11 | Argentina | 7.87% |
| 12 | India | 7.67% |
| 13 | Uganda | 7.62% |
| 14 | Benin | 7.51% |
| 15 | Ukraine | 7.35% |
An unusually high annual rate deserves context, but the indicator alone does not supply a causal explanation. Base effects, statistical revisions, normalization after a weak prior year, or other macroeconomic changes could matter, but those possibilities are not demonstrated by this file. A country-specific explanation would require the underlying national-accounts series and related evidence. Here the official observation is reported without inventing a cause.
Nine 2025 observations show a decline
Among the 130 observations dated 2025, 9 are below zero. Samoa is the lowest at -5.12%, followed by Mozambique, Haiti, Botswana and Brunei Darussalam. Iran, Islamic Rep., Namibia, Finland and Estonia also record small-to-moderate declines. The size of the change matters: a value just below zero is very different from a decline of five percent.
| Position among lower 2025 values | Economy | Household & NPISH consumption growth |
|---|---|---|
| 1 | Samoa | -5.12% |
| 2 | Mozambique | -3.58% |
| 3 | Haiti | -2.33% |
| 4 | Botswana | -2.24% |
| 5 | Brunei Darussalam | -1.77% |
| 6 | Iran, Islamic Rep. | -0.40% |
| 7 | Namibia | -0.34% |
| 8 | Finland | -0.24% |
| 9 | Estonia | -0.13% |
| 10 | Slovak Republic | 0.24% |
| 11 | France | 0.37% |
| 12 | Austria | 0.45% |
| 13 | Romania | 0.52% |
| 14 | Latvia | 0.75% |
| 15 | United Kingdom | 1.01% |
A negative rate means real household and NPISH final consumption expenditure was lower than in the previous year. It does not reveal by itself whether income, inflation, credit conditions, employment, saving behavior or another factor was decisive. The indicator describes the change in final consumption expenditure; causal interpretation requires additional variables and usually a time series.
Why 2024 and 2025 should not be merged into one current ranking
The file contains 31 observations from 2024. Their median is 3.84% and mean is 4.23%, with a range from -4.64% to 15.45%. Placing those values directly beside 2025 observations without a visible year would make changes from different economic periods look simultaneous. The mixed-year table is best used to show the latest available observation, while the 2025 subset is the appropriate table for same-year comparison.
The distinction is even more important for much older latest observations. A figure from 2011 or 1991 remains a valid historical observation, but it does not represent current household consumption conditions. Dropping the row would hide the data gap, whereas relabeling it as recent would distort the time dimension. Keeping the original observation year beside the value preserves both availability and chronology.
Household consumption growth is only one part of GDP
In the expenditure approach to GDP, household and NPISH final consumption expenditure is one component alongside government final consumption, investment and net exports. Those components can move in different directions. Strong consumption does not guarantee equally strong GDP growth, and weak consumption does not necessarily imply that total output contracted. This is one reason the indicator should be compared with GDP growth rather than substituted for it.
The measure is useful for tracking the pace of real consumption, but it is not a complete measure of household welfare. Per-capita consumption, income distribution, prices, access to housing, health and education, and household debt can all change the lived experience behind the national aggregate. It is also distinct from broader concepts of actual final consumption that may incorporate individual services provided to households through government.
The 2025 distribution is centered near 2% to 5%
The middle half of 2025 observations falls between 2.14% and 4.99%, with a median of 3.26%. That cluster is much tighter than the full upper range because of the very large Bulgaria observation. The distribution is therefore right-skewed: the mean sits above the median and a small number of high values stretch the upper tail.
The lower tail is less extreme. The 2025 minimum is -5.12%, while only 4 observations exceed 10%. Most economies in the 2025 subset record moderate positive growth, with a smaller group showing contraction and a few unusually rapid increases. That pattern can identify cases for deeper research, but it does not by itself establish a common regional cause.
Complete list of the 178 latest observations
The table below lists every verified latest non-empty observation in alphabetical order. The observation year is shown alongside the growth rate because values from different years should not be treated as one common-period ranking. No missing value is replaced with zero and no older observation is projected forward.
| Economy | Observation year | Household & NPISH consumption growth |
|---|---|---|
| Afghanistan | 2024 | 14.69% |
| Albania | 2025 | 2.77% |
| Algeria | 2025 | 4.40% |
| American Samoa | 2022 | -7.95% |
| Angola | 2024 | 5.69% |
| Argentina | 2025 | 7.87% |
| Armenia | 2025 | 10.70% |
| Australia | 2025 | 1.10% |
| Austria | 2025 | 0.45% |
| Azerbaijan | 2012 | 2.20% |
| Bahamas, The | 2024 | 3.23% |
| Bahrain | 2024 | 3.72% |
| Bangladesh | 2025 | 6.57% |
| Belarus | 2025 | 5.92% |
| Belgium | 2025 | 1.71% |
| Belize | 2024 | 4.69% |
| Benin | 2025 | 7.51% |
| Bermuda | 2024 | 1.54% |
| Bhutan | 2024 | -2.14% |
| Bolivia | 2024 | 1.69% |
| Bosnia and Herzegovina | 2025 | 2.31% |
| Botswana | 2025 | -2.24% |
| Brazil | 2025 | 1.31% |
| Brunei Darussalam | 2025 | -1.77% |
| Bulgaria | 2025 | 67.34% |
| Burkina Faso | 2025 | 2.34% |
| Burundi | 2025 | 2.75% |
| Cabo Verde | 2025 | 2.88% |
| Cambodia | 2025 | 4.59% |
| Cameroon | 2025 | 7.13% |
| Canada | 2025 | 2.32% |
| Central African Republic | 2025 | 3.20% |
| Chad | 2025 | 6.31% |
| Chile | 2025 | 2.68% |
| China | 2024 | 5.02% |
| Colombia | 2025 | 3.63% |
| Comoros | 2025 | 3.16% |
| Congo, Dem. Rep. | 2025 | 3.10% |
| Congo, Rep. | 2025 | 4.00% |
| Costa Rica | 2025 | 3.83% |
| Cote d’Ivoire | 2025 | 6.34% |
| Croatia | 2025 | 2.54% |
| Cuba | 2024 | 0.14% |
| Cyprus | 2025 | 3.32% |
| Czechia | 2025 | 2.96% |
| Denmark | 2025 | 2.29% |
| Djibouti | 2025 | 5.50% |
| Dominican Republic | 2025 | 2.48% |
| Ecuador | 2025 | 2.74% |
| Egypt, Arab Rep. | 2025 | 9.21% |
| El Salvador | 2025 | 2.79% |
| Equatorial Guinea | 2025 | 2.36% |
| Eritrea | 2011 | 459.21% |
| Estonia | 2025 | -0.13% |
| Eswatini | 2024 | 0.69% |
| Ethiopia | 2025 | 6.42% |
| Finland | 2025 | -0.24% |
| France | 2025 | 0.37% |
| Gabon | 2025 | 3.64% |
| Gambia, The | 2025 | 3.09% |
| Georgia | 2025 | 8.63% |
| Germany | 2025 | 1.56% |
| Ghana | 2024 | 4.47% |
| Greece | 2025 | 1.97% |
| Greenland | 2023 | 0.07% |
| Guam | 2022 | 1.23% |
| Guatemala | 2025 | 4.66% |
| Guinea | 2025 | 5.00% |
| Guinea-Bissau | 2025 | 6.79% |
| Haiti | 2025 | -2.33% |
| Honduras | 2025 | 3.46% |
| Hong Kong SAR, China | 2025 | 1.67% |
| Hungary | 2025 | 3.11% |
| Iceland | 2025 | 4.32% |
| India | 2025 | 7.67% |
| Indonesia | 2025 | 4.98% |
| Iran, Islamic Rep. | 2025 | -0.40% |
| Iraq | 2024 | 13.66% |
| Ireland | 2025 | 2.91% |
| Israel | 2025 | 2.58% |
| Italy | 2025 | 1.07% |
| Japan | 2024 | -0.60% |
| Kazakhstan | 2024 | 6.74% |
| Kenya | 2025 | 4.67% |
| Kiribati | 2024 | 10.57% |
| Korea, Rep. | 2025 | 1.32% |
| Kosovo | 2025 | 3.44% |
| Kuwait | 2024 | 2.56% |
| Kyrgyz Republic | 2025 | 23.79% |
| Lao PDR | 2016 | 4.53% |
| Latvia | 2025 | 0.75% |
| Lebanon | 2024 | -4.64% |
| Lesotho | 2025 | 1.52% |
| Libya | 2025 | 4.99% |
| Lithuania | 2025 | 2.13% |
| Luxembourg | 2025 | 2.26% |
| Macao SAR, China | 2025 | 1.33% |
| Madagascar | 2025 | 2.97% |
| Malawi | 2025 | 2.00% |
| Malaysia | 2025 | 5.15% |
| Maldives | 2024 | 7.45% |
| Mali | 2025 | 4.12% |
| Malta | 2025 | 3.34% |
| Marshall Islands | 2024 | -1.58% |
| Mauritania | 2025 | 9.26% |
| Mauritius | 2025 | 2.94% |
| Mexico | 2025 | 1.11% |
| Moldova | 2025 | 4.16% |
| Mongolia | 2025 | 9.20% |
| Montenegro | 2025 | 5.22% |
| Morocco | 2025 | 4.50% |
| Mozambique | 2025 | -3.58% |
| Namibia | 2025 | -0.34% |
| Nepal | 2025 | 2.39% |
| Netherlands | 2025 | 1.50% |
| New Zealand | 2024 | 0.01% |
| Nicaragua | 2025 | 5.77% |
| Niger | 2025 | 5.10% |
| North Macedonia | 2025 | 2.12% |
| Northern Mariana Islands | 2022 | -3.31% |
| Norway | 2025 | 2.71% |
| Oman | 2024 | 3.84% |
| Pakistan | 2025 | 2.16% |
| Palau | 2024 | 4.35% |
| Panama | 2024 | 6.48% |
| Papua New Guinea | 2004 | 16.57% |
| Paraguay | 2025 | 5.11% |
| Peru | 2025 | 3.32% |
| Philippines | 2025 | 4.51% |
| Poland | 2025 | 3.66% |
| Portugal | 2025 | 3.55% |
| Puerto Rico (US) | 2025 | 3.53% |
| Qatar | 2020 | -10.46% |
| Romania | 2025 | 0.52% |
| Russian Federation | 2025 | 3.60% |
| Rwanda | 2025 | 10.34% |
| Samoa | 2025 | -5.12% |
| San Marino | 2023 | 8.26% |
| Sao Tome and Principe | 2025 | 8.66% |
| Saudi Arabia | 2025 | 3.53% |
| Senegal | 2025 | 2.63% |
| Serbia | 2025 | 3.12% |
| Seychelles | 2025 | 3.91% |
| Sierra Leone | 2025 | 2.49% |
| Singapore | 2025 | 3.88% |
| Slovak Republic | 2025 | 0.24% |
| Slovenia | 2025 | 1.72% |
| Solomon Islands | 2024 | 8.19% |
| Somalia, Fed. Rep. | 2025 | 3.10% |
| South Africa | 2025 | 3.56% |
| Spain | 2025 | 3.36% |
| Sri Lanka | 2025 | 6.26% |
| Sudan | 2025 | 4.80% |
| Sweden | 2025 | 1.64% |
| Switzerland | 2025 | 1.54% |
| Syrian Arab Republic | 2022 | -11.21% |
| Tajikistan | 2024 | 15.45% |
| Tanzania | 2025 | 3.36% |
| Thailand | 2025 | 2.68% |
| Timor-Leste | 2024 | 4.11% |
| Togo | 2023 | 6.02% |
| Tonga | 2024 | 1.28% |
| Tunisia | 2025 | 4.31% |
| Turkiye | 2025 | 4.04% |
| Turkmenistan | 1991 | 16.18% |
| Uganda | 2025 | 7.62% |
| Ukraine | 2025 | 7.35% |
| United Arab Emirates | 2023 | 14.11% |
| United Kingdom | 2025 | 1.01% |
| United States | 2024 | 2.95% |
| Uzbekistan | 2025 | 9.49% |
| Vanuatu | 2024 | 5.42% |
| Venezuela, RB | 2014 | -3.36% |
| Viet Nam | 2025 | 7.31% |
| Virgin Islands (U.S.) | 2022 | -1.00% |
| West Bank and Gaza | 2025 | 6.81% |
| Yemen, Rep. | 2018 | 0.18% |
| Zimbabwe | 2024 | 1.53% |
How to interpret the comparison
First, separate the latest-observation view from the 2025 same-year subset. Second, remember that a growth rate is not a level of consumption or a per-capita measure. Third, one-year movements can be volatile and should not be presented as a long-run trend without a multi-year series. Fourth, the indicator alone does not identify a policy, shock or behavioral change as the cause of the result.
International national-accounts data can also be revised as new information becomes available. For a current country-specific decision or a detailed interpretation of an extreme observation, the latest World Bank time series and the relevant national statistical source should be checked together. The calculations in this article are tied to the verified CSV included in the package.
Source and calculation
The source is World Bank World Development Indicators, NE.CON.PRVT.KD.ZG: Households and NPISHs Final consumption expenditure (annual % growth). The package contains the latest non-empty observation for each economy. The 2025 statistics are calculated only from the 130 rows dated 2025. Means, medians, quartiles, sign counts and the high/low tables are derived directly from the verified data; missing values are not imputed as zero.
Frequently Asked Questions
Are all 178 latest observations from 2025?
No. 130 observations are from 2025, 31 are from 2024, and the remainder are older latest non-empty values.
What is the median household and NPISH consumption growth rate in the 2025 subset?
The median across the 130 observations dated 2025 is 3.26%, while the simple mean is 4.16%.
Does faster household consumption growth imply the same GDP growth rate?
No. Household and NPISH final consumption is only one component of expenditure-based GDP, so the two growth rates can differ substantially.
Related Articles
Green Map creates custom-edited map images using open geographic data sources such as geoBoundaries, Natural Earth, OpenStreetMap, and government open data. These maps are edited visual materials, not raw data files, and are provided for education, documents, presentations, and graphic reference.