World Bank indicator EN.GHG.CH4.IC.MT.CE.AR5 reports 2024 methane emissions from industrial combustion for 193 countries and economies. The 217-economy master frame contains 24 source-missing rows. The sum of reported values is 19.4702 Mt CO₂e, the unweighted mean is 0.1009, and the median is 0.0058. India records the highest value at 4.3877 Mt CO₂e, followed by China, Brazil, and the United States.
Industrial combustion is an energy-sector category, not the industrial-process category. It corresponds to fuel combustion in IPCC 2006 category 1.A.2 Manufacturing Industries and Construction. Methane emitted by chemical or physical production processes is classified separately under Industrial Processes.
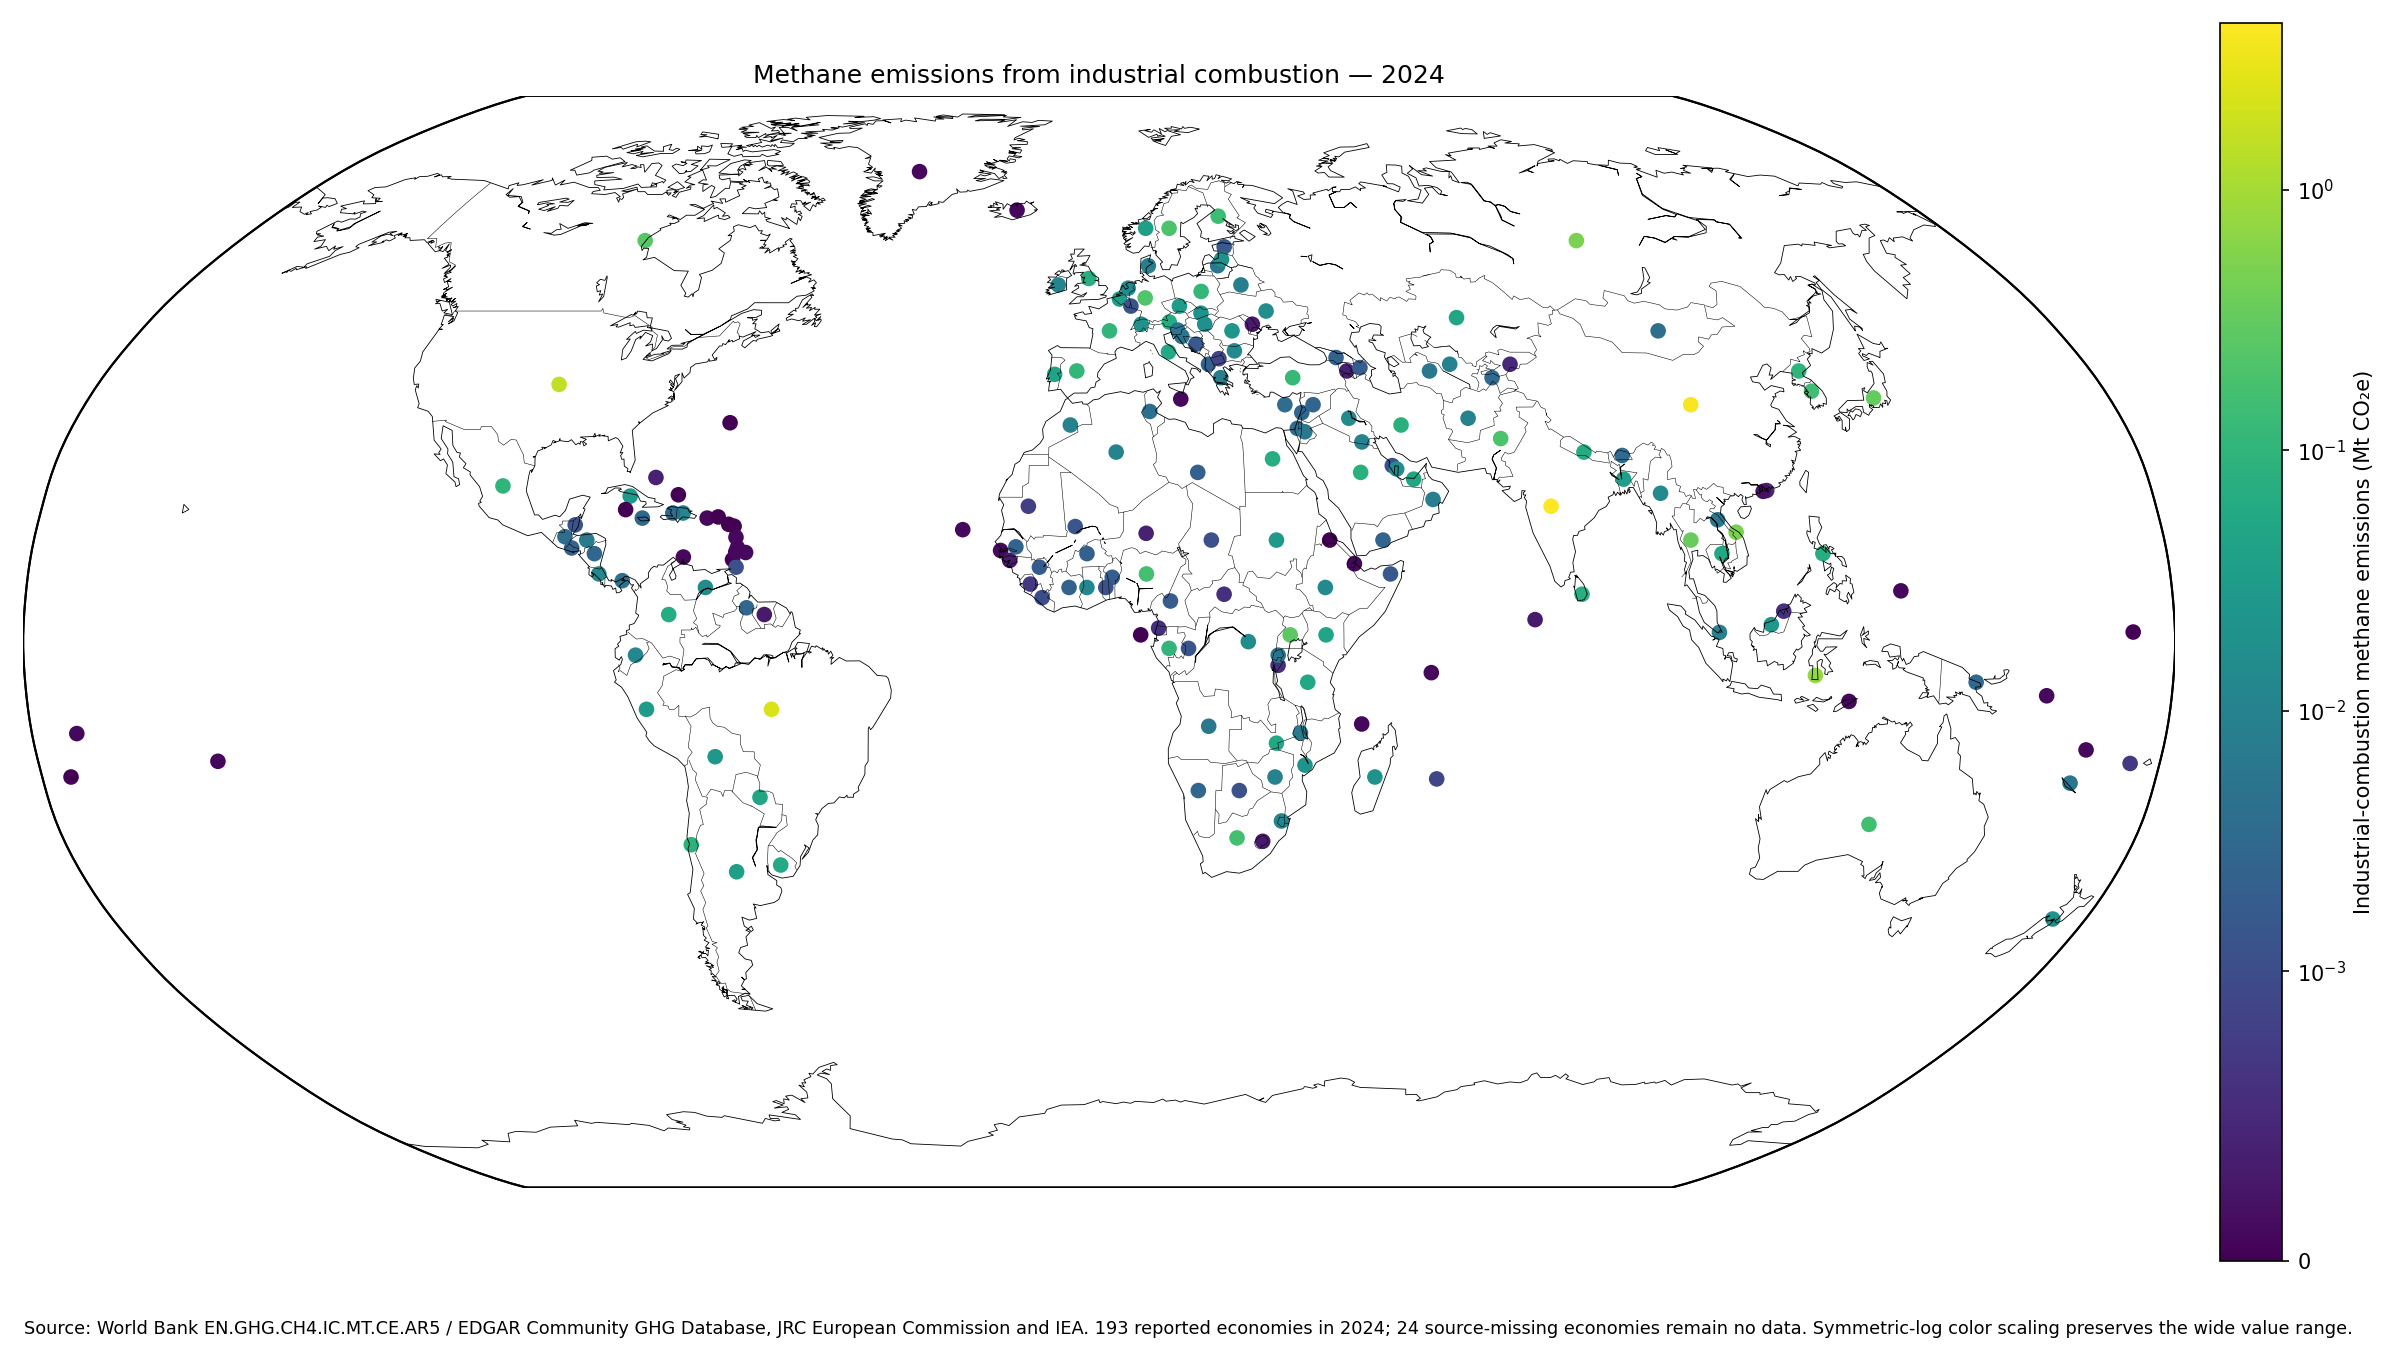
Table of Contents
What industrial-combustion methane covers
The indicator isolates methane associated with fuel combustion in manufacturing industries and construction within the energy sector. IPCC category 1.A covers fuel-combustion activities and 1.A.2 identifies manufacturing industries and construction.
The World Bank data page lists the indicator as Methane (CH4) emissions from Industrial Combustion (Energy) and identifies the EDGAR Community GHG Database, the European Commission Joint Research Centre, and IEA as sources.
Industrial Combustion is not Industrial Processes
The distinction matters because the words sound similar. Industrial combustion concerns fuels burned to provide energy in manufacturing and construction. Industrial processes concern greenhouse gases released by the production process itself, such as transformations in mineral, chemical, metal, or other product manufacture.
Combining the two without checking their definitions would change the sector boundary. Every table and calculation here stays with World Bank code EN.GHG.CH4.IC.MT.CE.AR5 only.
The unit is Mt CO₂e rather than tonnes of methane
Mt CO₂e means million tonnes of carbon-dioxide equivalent. The value expresses methane’s climate effect on a common carbon-dioxide-equivalent basis instead of reporting the raw physical mass of CH₄.
The AR5 suffix indicates use of Global Warming Potential factors associated with the IPCC Fifth Assessment Report framework. A value of 1 Mt CO₂e therefore must not be described as one million tonnes of methane itself.
India and China have the largest reported 2024 totals
India records 4.3877 Mt CO₂e, China 3.8999, Brazil 2.3739, the United States 1.5402, and Indonesia 0.7499. The Russian Federation, Viet Nam, Thailand, Japan, and Uganda complete the top ten.
These are absolute national totals. They are not divided by population, manufacturing output, GDP, or industrial energy consumption, so the ranking should not be interpreted as a ranking of industrial efficiency.
| Rank | Country or economy | 2024 industrial-combustion CH₄ |
|---|---|---|
| 1 | India | 4.3877 Mt CO₂e |
| 2 | China | 3.8999 Mt CO₂e |
| 3 | Brazil | 2.3739 Mt CO₂e |
| 4 | United States | 1.5402 Mt CO₂e |
| 5 | Indonesia | 0.7499 Mt CO₂e |
| 6 | Russian Federation | 0.4996 Mt CO₂e |
| 7 | Viet Nam | 0.4864 Mt CO₂e |
| 8 | Thailand | 0.3490 Mt CO₂e |
| 9 | Japan | 0.3162 Mt CO₂e |
| 10 | Uganda | 0.2833 Mt CO₂e |
| 11 | Canada | 0.2499 Mt CO₂e |
| 12 | Germany | 0.2198 Mt CO₂e |
| 13 | Sweden | 0.2019 Mt CO₂e |
| 14 | Pakistan | 0.1976 Mt CO₂e |
| 15 | South Africa | 0.1686 Mt CO₂e |
The top five account for about two-thirds of reported emissions
Within the 19.4702 Mt CO₂e sum of the 193 reported economies, the largest economy accounts for 22.5%, the top two 42.6%, and the top three 54.8%. The top five together account for 66.5%.
The top ten reach 76.5% and the top twenty 85.6%. This shows strong concentration in a relatively small number of industrial economies. Because 24 master economies are missing, these percentages are shares of the reported-economy sum rather than a complete world total.
The median is only 0.0058 Mt CO₂e
The median across the 193 observations is 0.0058 Mt CO₂e, with a first quartile of 0.0008 and a third quartile of 0.0355. The mean of 0.1009 is much higher than the median because a few large values create a long upper tail.
The country distribution is therefore highly skewed. For a typical reported economy, the median and value bands are more informative than the mean alone.
Most reported values are very small
There are 11 exact zeros, 40 positive values below 0.001 Mt CO₂e, and 62 values from 0.001 to under 0.01. Together those groups contain 113 of the 193 reported economies.
Another 36 are from 0.01 to under 0.05, 31 from 0.05 to under 0.2, 9 from 0.2 to under 1, and only 4 are at least 1 Mt CO₂e.
| 2024 emission band | Economies | Share of reported values |
|---|---|---|
| Exactly 0 | 11 | 5.7% |
| >0 to under 0.001 | 40 | 20.7% |
| 0.001 to under 0.01 | 62 | 32.1% |
| 0.01 to under 0.05 | 36 | 18.7% |
| 0.05 to under 0.2 | 31 | 16.1% |
| 0.2 to under 1 | 9 | 4.7% |
| 1 or more | 4 | 2.1% |
Reported zero and no data are different states
11 numeric observations are exactly 0.0000 Mt CO₂e. Those are genuine reported zeros and remain zeros in the statistics. The 24 source-missing rows have no numeric observation and are excluded from the map, mean, median, and reported-economy sum.
Replacing missing rows with zero would artificially increase the number of zero-emission economies and lower summary statistics. The dataset therefore keeps the two states separate.
| Economy with reported zero | 2024 value |
|---|---|
| Antigua and Barbuda | 0.0000 Mt CO₂e |
| Bermuda | 0.0000 Mt CO₂e |
| British Virgin Islands | 0.0000 Mt CO₂e |
| Cayman Islands | 0.0000 Mt CO₂e |
| Eritrea | 0.0000 Mt CO₂e |
| Grenada | 0.0000 Mt CO₂e |
| Kiribati | 0.0000 Mt CO₂e |
| Sao Tome and Principe | 0.0000 Mt CO₂e |
| St. Kitts and Nevis | 0.0000 Mt CO₂e |
| Tonga | 0.0000 Mt CO₂e |
| Turks and Caicos Islands | 0.0000 Mt CO₂e |
The smallest positive values remain distinct from zero
Among positive observations, Greenland, Djibouti, Dominica, Iceland, and Aruba are around 0.0001 Mt CO₂e. Four decimal places are retained in the low-end table so that genuinely small positive values are not visually rounded to zero.
Such small totals can reflect the scale and energy profile of manufacturing and construction, but the five-column dataset does not contain enough explanatory variables to assign a country-specific cause.
| Country or economy | Small positive observation |
|---|---|
| Aruba | 0.0001 Mt CO₂e |
| Barbados | 0.0001 Mt CO₂e |
| Comoros | 0.0001 Mt CO₂e |
| Gambia, The | 0.0001 Mt CO₂e |
| Dominica | 0.0001 Mt CO₂e |
| Djibouti | 0.0001 Mt CO₂e |
| Cabo Verde | 0.0001 Mt CO₂e |
| Greenland | 0.0001 Mt CO₂e |
| Malta | 0.0001 Mt CO₂e |
| St. Lucia | 0.0001 Mt CO₂e |
| Iceland | 0.0001 Mt CO₂e |
| Seychelles | 0.0001 Mt CO₂e |
| Solomon Islands | 0.0001 Mt CO₂e |
| French Polynesia | 0.0001 Mt CO₂e |
| Puerto Rico (US) | 0.0001 Mt CO₂e |
Twenty-four missing economies are not zero emitters
The source-missing group includes Andorra, American Samoa, Channel Islands, Curacao, Faroe Islands, Micronesia, Gibraltar, Guam, Isle of Man, Liechtenstein, Montenegro, Serbia, South Sudan, Tuvalu, Kosovo, and other small economies or territories.
No data means the source did not supply a usable 2024 numeric observation for this indicator. It does not mean industrial-combustion methane emissions were zero.
| Source-missing economy | 2024 status |
|---|---|
| American Samoa | No data |
| Andorra | No data |
| Channel Islands | No data |
| Curacao | No data |
| Faroe Islands | No data |
| Gibraltar | No data |
| Guam | No data |
| Isle of Man | No data |
| Kosovo | No data |
| Liechtenstein | No data |
| Marshall Islands | No data |
| Micronesia, Fed. Sts. | No data |
| Monaco | No data |
| Montenegro | No data |
| Naoero | No data |
| Northern Mariana Islands | No data |
| San Marino | No data |
| Serbia | No data |
| Sint Maarten (Dutch part) | No data |
| South Sudan | No data |
| St. Martin (French part) | No data |
| Tuvalu | No data |
| Virgin Islands (U.S.) | No data |
| West Bank and Gaza | No data |
Industrial combustion is different from fugitive methane
Methane released while fuel is burned in manufacturing is separate from fugitive methane released during extraction, processing, storage, and transport of coal, oil, and natural gas. The IPCC framework places those sources in different energy categories.
A fossil-fuel-producing economy can therefore have modest industrial-combustion methane and large fugitive emissions, or the reverse. The appropriate sector-specific indicator depends on the question being asked.
It is also narrower than total methane emissions
The World Bank total methane series covers a much broader set of sources, including agriculture, waste, and multiple energy subsectors. Industrial combustion is only one component of that total.
In many economies, agriculture, waste, or fugitive fuel emissions can dominate methane totals. This map should not be used as a proxy for a country’s complete methane footprint.
A common 2024 year improves temporal comparability
All 193 numeric observations refer to 2024. Unlike latest-value datasets that mix observation years, the rank order and distribution here do not combine old and new country values.
A common year does not eliminate inventory uncertainty. Emission databases combine activity data, emission factors, sector definitions, and international methodologies rather than directly measuring every molecule emitted.
Absolute totals do not measure industrial efficiency
A country with a large manufacturing base can have a larger absolute total even if its emissions per unit of output are low. Efficiency or emissions intensity requires a denominator such as manufacturing value added, physical production, or industrial energy use.
Per-capita analysis is also a separate question. Dividing by population could change the ordering substantially; the source indicator used here is the absolute Mt CO₂e total.
The reported-economy sum is not labeled the official world total
Adding all 193 numeric observations gives 19.4702 Mt CO₂e. With 24 master economies missing and potential differences between country sums and official aggregates, this value is presented only as the sum of reported economies.
For a formal world total, an official World Bank or EDGAR aggregate with documented geographic coverage is preferable.
Source and calculation notes
The source is World Bank World Development Indicators series EN.GHG.CH4.IC.MT.CE.AR5, based on EDGAR Community GHG Database, JRC European Commission and IEA data. The analysis uses 193 numeric observations from 2024, preserves 11 reported zeros, and excludes 24 source-missing rows from numeric calculations.
All 193 reported country codes are joined to geographic centroids for the map, producing a 100% match. A symmetric-log color normalization makes the large value range readable without changing the underlying data.
Frequently Asked Questions
Are industrial-combustion methane and industrial-process methane the same indicator?
No. Industrial combustion is fuel combustion in IPCC 1.A.2 manufacturing and construction, while industrial processes cover emissions from production processes themselves.
Does Mt CO₂e mean the physical mass of methane?
No. It expresses methane's warming effect in carbon-dioxide-equivalent units using the IPCC AR5 framework.
Are the 24 source-missing economies counted as zero?
No. They remain no data and are distinct from the 11 economies with an actual reported value of zero.
Related Articles
Green Map creates custom-edited map images using open geographic data sources such as geoBoundaries, Natural Earth, OpenStreetMap, and government open data. These maps are edited visual materials, not raw data files, and are provided for education, documents, presentations, and graphic reference.