World Bank indicator NY.GDP.PCAP.KN provides a latest non-empty GDP-per-capita observation in constant local currency for 214 countries and territories. 186 observations are from 2025, equal to 86.9% of coverage, and 14 are from 2024. Together, 2024–2025 accounts for 200 economies or 93.5% of the dataset. The raw numeric levels should not be ranked across countries because each economy uses a different local currency and the constant-price reference year varies by country.
The indicator is designed primarily for tracking real GDP per person through time within an economy. The World Bank defines GDP per capita as GDP divided by midyear population. The constant-price treatment adjusts for price changes, while the local-currency format preserves the national monetary unit rather than converting every economy into dollars or a common purchasing-power unit.
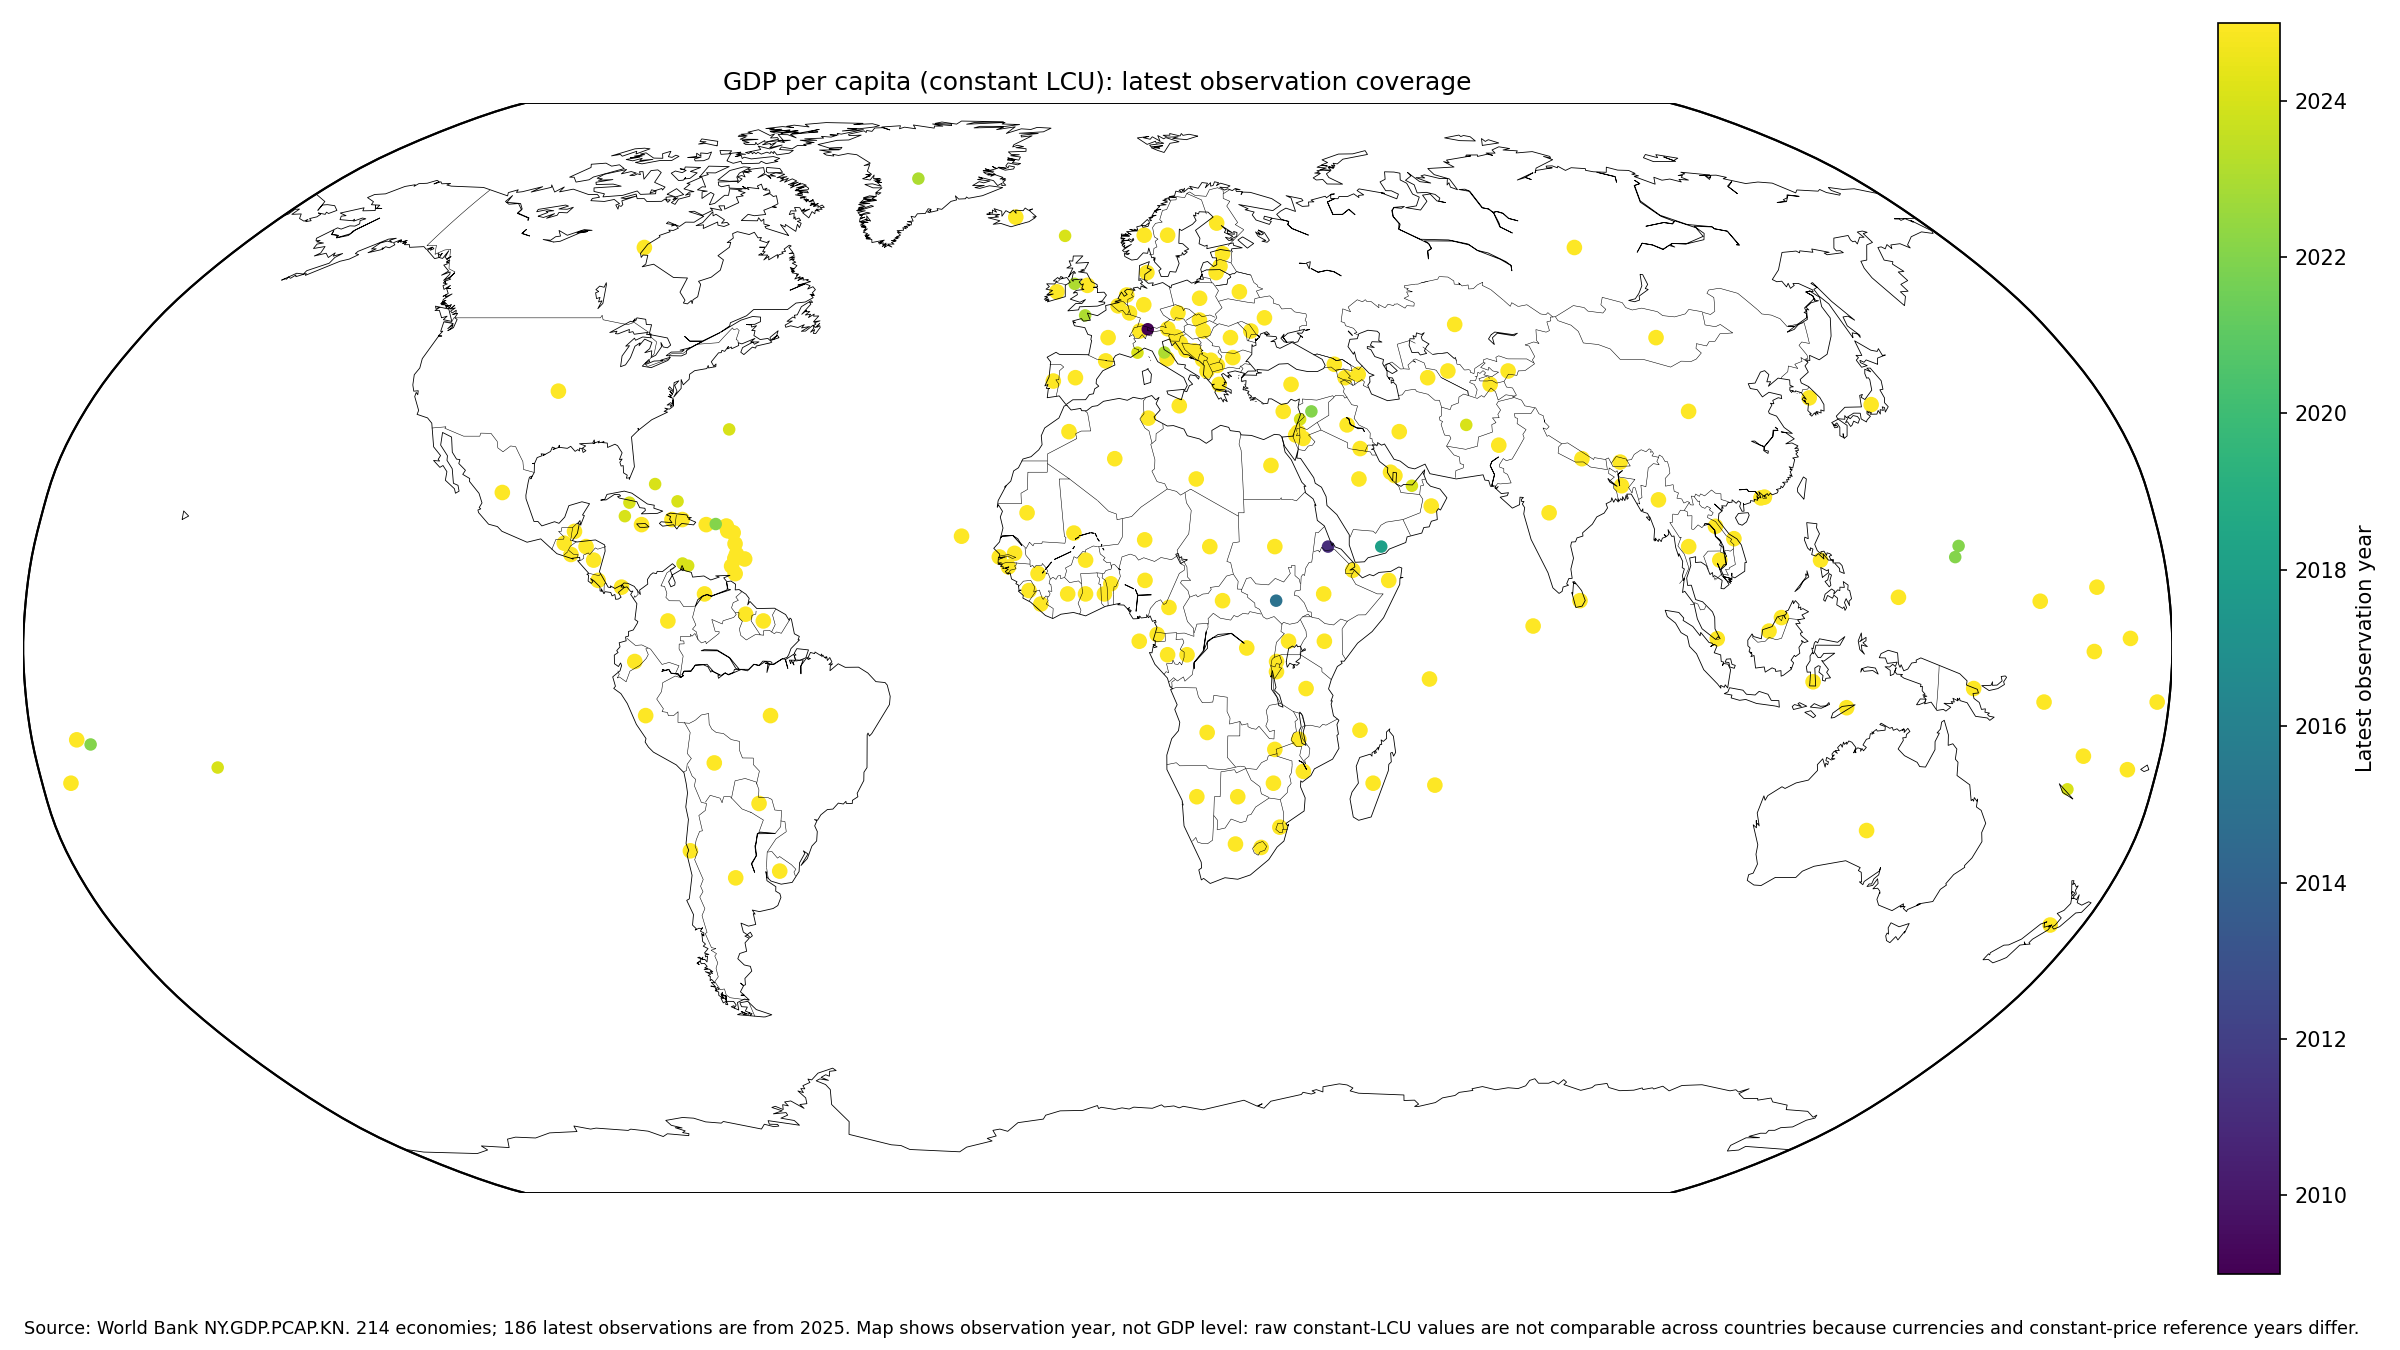
Table of Contents
What GDP per capita in constant local currency means
GDP measures value added generated by resident producers plus product taxes less subsidies not already included in output values. Dividing GDP by midyear population creates a per-capita measure. Using constant prices removes the effect of changing domestic prices so that changes through time are more closely related to changes in real production per person.
The World Bank metadata glossary states that the series is expressed in constant local currency and that the base or reference period varies by country. The World Bank API provides the latest non-empty country observations.
Why a raw global ranking would be invalid
Local currencies use different units. A figure measured in yen, pesos, dinars, or another national currency cannot be compared by numeric size without conversion. A value of one million local-currency units in one economy is not automatically larger in economic terms than fifty thousand units in another.
Constant-price reference years add a second comparability problem. Each country’s constant-price series can be anchored to a different reference year, so even countries observed in 2025 do not necessarily share the same price basis.
The 186 observations from 2025 are still not a level ranking
186 of the 214 economies have a 2025 value, which gives excellent temporal coverage. But a common observation year does not solve differences in currency denomination or constant-price reference periods. Sorting the raw 2025 numbers from highest to lowest would therefore create a visually precise but economically invalid ranking.
For cross-country GDP-per-capita levels, current US-dollar series or PPP-adjusted series are better choices because they create a common monetary basis. For cross-country real growth comparisons, a percentage growth indicator is more suitable than a raw local-currency level.
Example raw values illustrate the unit problem
The dataset contains very different numeric magnitudes even among 2025 observations. Those magnitudes reflect national currency denominations and price-reference systems as well as underlying economic output. The table below is deliberately not ranked; it is an illustration of why the raw values should remain country-specific.
| Example economy | Observation year | GDP per capita, constant LCU |
|---|---|---|
| Albania | 2025 | 904,310 constant LCU |
| Argentina | 2025 | 16,119 constant LCU |
| Armenia | 2025 | 2,529,930 constant LCU |
| Australia | 2025 | 98,362 constant LCU |
| Austria | 2025 | 45,265 constant LCU |
| Azerbaijan | 2025 | 3,312 constant LCU |
| Bangladesh | 2025 | 197,100 constant LCU |
| Cambodia | 2025 | 8,972,239 constant LCU |
| Canada | 2025 | 62,597 constant LCU |
| Japan | 2025 | 4,792,376 constant LCU |
A value in the millions should not be interpreted as many times richer than a value in the tens of thousands. Without a common unit, the ratio between the two raw numbers has no useful cross-country economic meaning.
The map focuses on data recency rather than false level comparisons
The map uses latest observation year as its visual variable. There are 186 observations from 2025, 14 from 2024, 4 from 2023, and 5 from 2022. 209 of the 214 economies have observations from 2022 or later.
Recent observations are broadly distributed across Europe, Asia, Africa, the Americas, and Oceania. The older exceptions are scattered among several small territories and a limited number of countries, making data freshness—not raw local-currency magnitude—the meaningful geographic pattern in this package.
Only five latest observations are older than 2022
5 economies have latest observations before 2022. Liechtenstein is 2009, Eritrea 2011, South Sudan 2015, Yemen 2018, and St. Martin (French part) 2021. These values are the last non-empty observations in the series, not measurements of 2025 economic conditions.
| Country or territory | Latest observation year |
|---|---|
| Liechtenstein | 2009 |
| Eritrea | 2011 |
| South Sudan | 2015 |
| Yemen, Rep. | 2018 |
| St. Martin (French part) | 2021 |
| American Samoa | 2022 |
| Guam | 2022 |
| Northern Mariana Islands | 2022 |
| Syrian Arab Republic | 2022 |
| Virgin Islands (U.S.) | 2022 |
| Channel Islands | 2023 |
| Greenland | 2023 |
| Isle of Man | 2023 |
| San Marino | 2023 |
| Afghanistan | 2024 |
| Aruba | 2024 |
| Bahamas, The | 2024 |
| Bermuda | 2024 |
| Cayman Islands | 2024 |
| Cuba | 2024 |
The 2022 group includes American Samoa, Guam, the Northern Mariana Islands, the Syrian Arab Republic, and the U.S. Virgin Islands. Channel Islands, Greenland, Isle of Man, and San Marino are from 2023.
Spatial coverage is broad even though a few gaps are old
With 86.9% of observations from 2025 and 93.5% from 2024–2025, the dataset does not show a continent-scale block of stale observations. Instead, older points appear as isolated exceptions, many of them small jurisdictions or individual economies with less recent national-accounts updates.
This is why observation year belongs on an economic map. Treating a 2009 and a 2025 observation as if they represented the same moment would create a time-comparability problem even before considering the currency issue.
The series is strongest for within-country time analysis
Constant local currency is useful when the objective is to follow an economy’s real GDP per person through time. The monetary unit remains national and the price effect is adjusted, making the series suitable for assessing whether real output per person has risen or fallen within that economy.
This package contains only the latest non-empty observation for each economy, so it does not support a new historical growth calculation. A full time series of the same World Bank indicator is required for trend analysis.
Constant prices do not equal purchasing-power parity
Constant prices adjust an economy’s own price changes across time. They do not equalize the price level between countries. PPP conversion is a different operation designed to improve international comparisons of purchasing power.
If the question is which economies have higher GDP per person on a comparable international basis, PPP GDP per capita is usually more informative. If the question is the domestic real trajectory of one economy, constant LCU has a clear advantage.
Constant LCU is also different from current LCU
Current-LCU GDP per capita uses prices from the current year, so inflation is embedded in the nominal number. Constant LCU removes much of that price effect. In a high-inflation economy, current LCU can rise rapidly even when real output per person changes little.
The choice therefore depends on the question: current LCU for nominal domestic amounts, constant LCU for real domestic changes, and common-currency or PPP series for international level comparisons.
Population changes also move GDP per capita
GDP per capita divides total GDP by population. Real GDP can increase while GDP per capita falls if population grows faster, and GDP per capita can rise with weak total GDP if population declines.
That makes the indicator different from total economic size. Total GDP and GDP per capita answer related but distinct questions.
Rebasing can change the scale of a constant-price series
National statistical systems periodically update reference years and revise national accounts. The World Bank metadata explicitly notes that the base period varies by country. Rebasing can change the numerical scale of a constant-LCU series without implying that the underlying economy suddenly changed by the same amount.
Long-run analysis should therefore use a consistent published time series and, when needed, review national statistical notes on rebasing and methodological revisions.
Why no global mean or median is reported
This analysis intentionally does not calculate a mean or median of the 214 raw constant-LCU values. Combining numbers expressed in different currencies and reference-price systems would produce a statistic that is mathematically computable but economically meaningless.
Instead, the analysis summarizes comparable attributes: observation year, coverage, and data freshness. Distinguishing what can be calculated from what can be validly interpreted is essential with local-currency indicators.
Source and map method
The source is World Bank World Development Indicators series NY.GDP.PCAP.KN. The package contains 214 latest non-empty country observations: 186 from 2025, 14 from 2024, 4 from 2023, and 5 from 2022, with a small older remainder. The official World Bank API provides the series.
All 214 reported country codes are joined to geographic centroids for the map, producing a 100% match. The map uses observation year rather than raw constant-LCU magnitude to avoid a false cross-country GDP-level comparison.
Frequently Asked Questions
Can constant-LCU GDP per capita be ranked across countries?
Not reliably. Local currency units and constant-price reference years differ by country, so raw numeric levels do not share a common scale.
What is this indicator best used for?
It is most useful for tracking real GDP per person through time within the same economy.
Are all 214 observations from 2025?
No. 186 are from 2025 and 28 are latest available observations from 2009–2024.
Related Articles
Green Map creates custom-edited map images using open geographic data sources such as geoBoundaries, Natural Earth, OpenStreetMap, and government open data. These maps are edited visual materials, not raw data files, and are provided for education, documents, presentations, and graphic reference.