World Bank indicator GC.LBL.TOTL.GD.ZS provides a latest non-empty observation for net incurrence of government liabilities as a share of GDP in 149 countries and territories. Observation years range from 1978 to 2024, with 59 observations from 2024 and 20 from 2023. The unweighted mean is 3.71% and the median 3.06%. Palau has the highest latest observation at 20.29%, but that value is from 2020; Ukraine leads the 2024 subset at 18.26%.
This is not the stock of government debt. World Bank metadata defines net incurrence of liabilities as domestic and foreign financing used by government to cover a budget deficit or allocate financial resources arising from a budget surplus. It is a flow over an accounting period: new liabilities net of reductions, expressed relative to GDP.
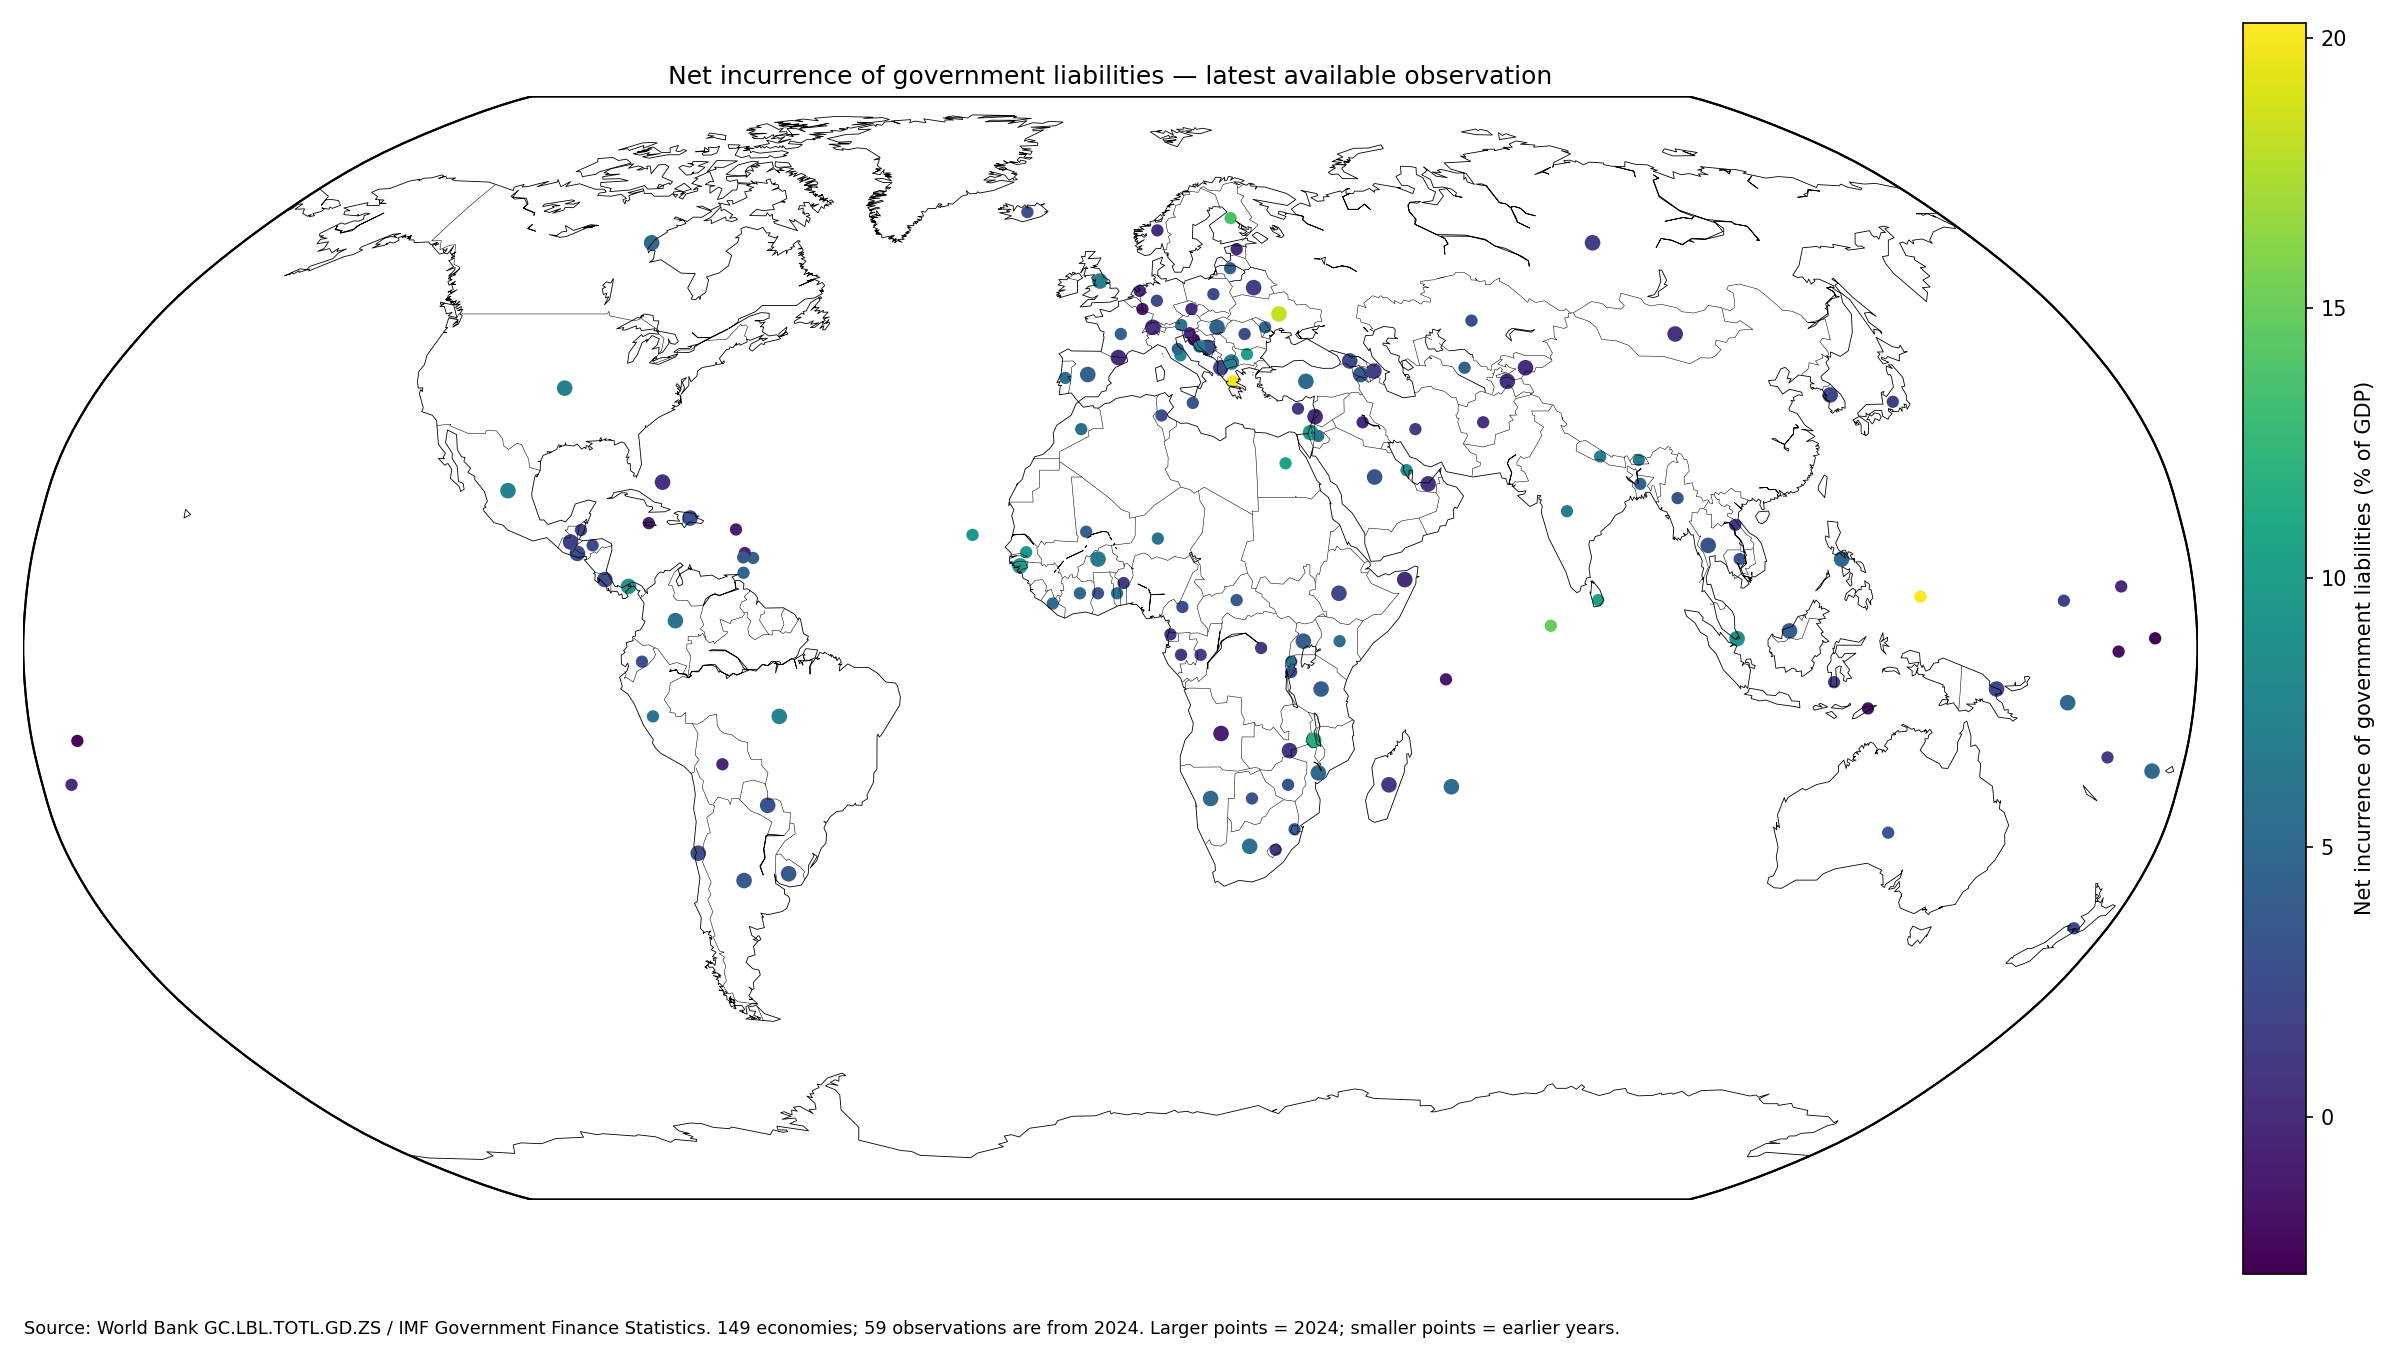
Table of Contents
What net incurrence of liabilities means
Governments can obtain financing from residents or nonresidents. During a deficit, that financing can help cover the gap between revenues and expenditures; during a surplus, financial resources can be allocated in ways that affect assets and liabilities. The word net matters because liability reductions and repayments offset new incurrence.
The World Bank metadata glossary explains that the measure includes domestic and foreign financing and is linked to net acquisition of financial assets. The World Bank API provides country observations, sourced from IMF Government Finance Statistics.
This is a flow, not the debt stock
Government debt indicators report outstanding liabilities at a point in time. Net incurrence reports how liabilities change through financing transactions during a period. A country with a high debt stock can have low or negative net incurrence in one year, while a country with a lower debt stock can record a large positive financing flow.
A central-government-debt-to-GDP indicator is therefore a different measure. The current series is better suited to annual financing analysis than accumulated debt-level comparisons.
The full latest-value ranking mixes very different years
Palau records 20.29%, Greece 19.93%, Ukraine 18.26%, Maldives 14.91%, Finland 13.51%, and Malawi 11.76%. Palau is from 2020, Greece 1990, Maldives 2021, and Finland 1994.
The full 149-economy table should therefore not be labeled a 2024 world ranking. Latest-value data maximize geographic coverage but can combine observations separated by decades, so every value should remain paired with its year.
| Rank | Country or territory | Observation year | Net incurrence / GDP |
|---|---|---|---|
| 1 | Palau | 2020 | 20.29% |
| 2 | Greece | 1990 | 19.93% |
| 3 | Ukraine | 2024 | 18.26% |
| 4 | Maldives | 2021 | 14.91% |
| 5 | Finland | 1994 | 13.51% |
| 6 | Malawi | 2024 | 11.76% |
| 7 | Egypt, Arab Rep. | 2012 | 10.45% |
| 8 | Bulgaria | 1994 | 10.08% |
| 9 | Sri Lanka | 2023 | 10.07% |
| 10 | Israel | 2024 | 9.92% |
| 11 | Guinea-Bissau | 2024 | 9.52% |
| 12 | Senegal | 2023 | 9.38% |
| 13 | Cabo Verde | 2020 | 9.31% |
| 14 | Panama | 2024 | 9.03% |
| 15 | Singapore | 2024 | 8.72% |
The 2024 subset covers 59 economies
Restricting the data to 2024 leaves 59 economies. Ukraine leads at 18.26%, followed by Malawi at 11.76%, Israel at 9.92%, Guinea-Bissau at 9.52%, and Panama at 9.03%.
| 2024 rank | Country or territory | Net incurrence / GDP |
|---|---|---|
| 1 | Ukraine | 18.26% |
| 2 | Malawi | 11.76% |
| 3 | Israel | 9.92% |
| 4 | Guinea-Bissau | 9.52% |
| 5 | Panama | 9.03% |
| 6 | Singapore | 8.72% |
| 7 | Brazil | 7.35% |
| 8 | Mexico | 7.20% |
| 9 | United States | 7.05% |
| 10 | United Kingdom | 7.03% |
| 11 | North Macedonia | 6.63% |
| 12 | Burkina Faso | 6.42% |
| 13 | Colombia | 5.78% |
| 14 | South Africa | 5.64% |
| 15 | Mauritius | 5.23% |
The 2024 subset has an unweighted mean of 3.95% and a median of 3.59%. Its first quartile is 1.31% and third quartile 5.19%. 2 economies are at 10% or more, while 2 have negative values.
Negative values indicate net liability reduction
17 of the 149 latest observations are negative. Kiribati records -2.91%, Samoa -2.44%, Croatia -2.35%, Naoero -2.02%, and Timor-Leste -1.86%. Among 2024 observations, Angola is -0.75% and Somalia is close to -0.01%.
A negative value can indicate liabilities fell on a net basis during the period. It does not automatically mean fiscal conditions are strong. Asset transactions, the fiscal balance, debt repayments, and other financing operations still matter.
| Low-end rank | Country or territory | Observation year | Net incurrence / GDP |
|---|---|---|---|
| 1 | Kiribati | 2023 | -2.91% |
| 2 | Samoa | 2023 | -2.44% |
| 3 | Croatia | 1994 | -2.35% |
| 4 | Naoero | 2020 | -2.02% |
| 5 | Timor-Leste | 2022 | -1.86% |
| 6 | Luxembourg | 1994 | -1.28% |
| 7 | Seychelles | 2008 | -1.21% |
| 8 | St. Kitts and Nevis | 2020 | -1.01% |
| 9 | Jamaica | 2013 | -0.93% |
| 10 | Angola | 2024 | -0.75% |
| 11 | St. Lucia | 2010 | -0.58% |
| 12 | Iraq | 2019 | -0.37% |
| 13 | Bolivia | 2007 | -0.31% |
| 14 | Netherlands | 1994 | -0.13% |
| 15 | Marshall Islands | 2020 | -0.10% |
The median is 3.06% of GDP
The median across the 149 latest observations is 3.06%, with a first quartile of 1.09% and third quartile of 5.33%. 8 observations are below -1%, 9 are from -1% to under zero, 35 from zero to under 2%, 54 from 2% to under 5%, 34 from 5% to under 10%, and 9 are at least 10%.
The mean of 3.71% is above the median because a small number of large positive financing flows pull up the upper tail. Annual fiscal-financing ratios can be volatile, so distribution bands and observation year are essential context.
Net incurrence is not the fiscal deficit
A budget deficit often requires financing, but the net incurrence of liabilities does not have to equal the deficit. Governments can acquire or sell financial assets, incur new liabilities, and repay existing liabilities within the same accounting period.
World Bank metadata notes that net incurrence of liabilities should be offset by net acquisition of financial assets. A fiscal-balance or net-lending/borrowing series is the appropriate measure for the deficit itself.
Domestic and foreign financing are combined
The measure includes financing obtained from residents and from nonresidents. A high positive value therefore should not automatically be described as an increase in external debt.
Separating domestic and foreign sources requires more detailed government-finance or public-debt data by creditor residence, instrument, or currency. This series combines them into total net incurrence.
A high positive flow is not automatically a fiscal crisis
Governments can raise substantial financing during large investment programs, economic shocks, disaster response, financial support operations, or other policy episodes. A high annual flow alone does not establish insolvency or debt distress.
Debt stock, interest burden, maturity profile, currency composition, revenue capacity, and economic growth all matter for fiscal sustainability. Net incurrence is one annual financing measure, not a complete risk assessment.
Older latest observations should not be presented as current
79 observations are from 2023–2024, while 45 are from 2019 or earlier. The oldest latest observation is from 1978. High older values such as Greece in 1990 and Finland in 1994 require especially clear year labels.
For current-period comparison, the 2024 subset is safer. The full latest-observation map is still useful when wider geographic coverage is the priority and the observation year remains visible.
The GDP denominator changes the ratio
The same amount of net liability incurrence produces a larger percentage in a smaller-GDP economy and a smaller percentage in a larger-GDP economy. The indicator is therefore not a ranking of absolute financing amounts.
A current local-currency series is better for comparing monetary amounts. The GDP ratio is useful for comparing annual financing relative to the scale of each economy.
The country mean is not a GDP-weighted world ratio
The 3.71% simple mean gives every one of the 149 economies equal weight. A very large economy and a small economy each count once, so it is not equivalent to global net incurrence divided by world GDP.
A world-weighted ratio would require GDP weights or aggregated financing amounts and GDP. The median likewise summarizes the distribution of country ratios rather than a global financing total.
Source and calculation notes
The source is World Bank World Development Indicators series GC.LBL.TOTL.GD.ZS, sourced from IMF Government Finance Statistics. The analysis uses the latest non-empty observation for 149 economies and separately examines the 59 observations from 2024. The official World Bank API provides the series.
All 149 reported country codes are joined to geographic centroids for the map, producing a 100% match. Larger points mark 2024 observations and smaller points earlier years. Missing economies are not converted to zero.
Frequently Asked Questions
Is net incurrence of liabilities the same as the government debt stock?
No. It is a flow of net liability incurrence during an accounting period, not the accumulated stock of government debt.
What does a negative value mean?
It can indicate liabilities fell on a net basis during the period. It does not by itself show that overall fiscal conditions are strong.
Are all 149 observations from 2024?
No. Only 59 are from 2024; the latest observation years across the full dataset range from 1978 to 2024.
Related Articles
Green Map creates custom-edited map images using open geographic data sources such as geoBoundaries, Natural Earth, OpenStreetMap, and government open data. These maps are edited visual materials, not raw data files, and are provided for education, documents, presentations, and graphic reference.