Methane released through the World Bank’s Fugitive Emissions (Energy) category varies by orders of magnitude across economies. Indicator EN.GHG.CH4.FE.MT.CE.AR5 reports 2024 methane (CH₄) emissions from that energy subsector in million tonnes of CO₂ equivalent. There are 192 numeric non-aggregate country and economy observations, while 25 rows have no source value and remain missing. The scope is narrower than national methane emissions and different from methane assigned to other energy subsectors such as Building (Energy).
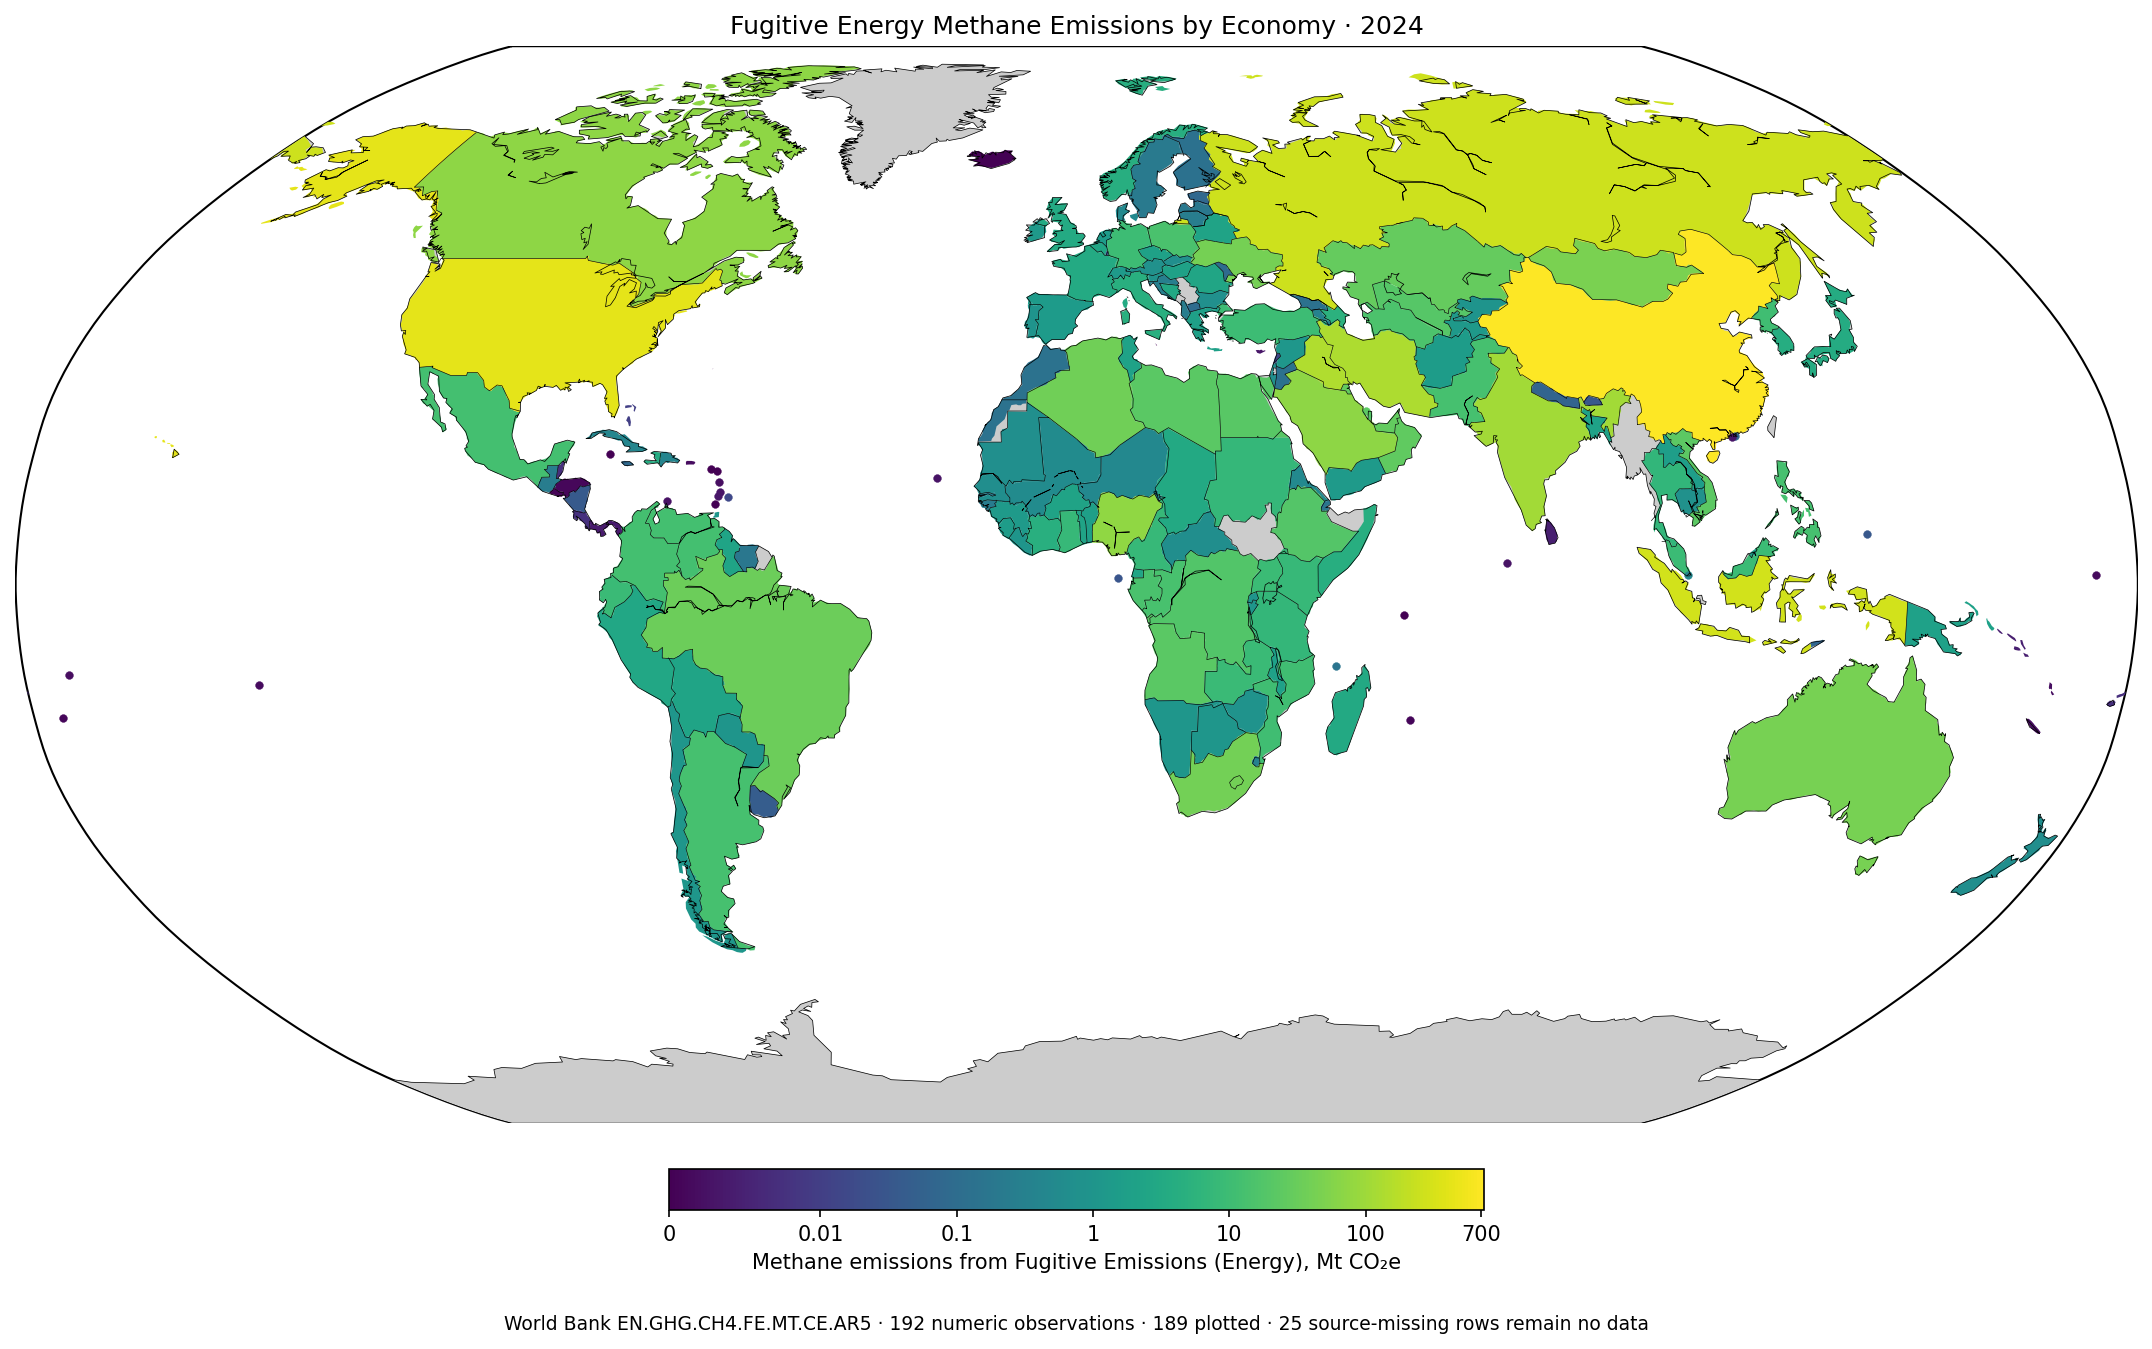
Table of Contents
China recorded 736.7607 Mt CO₂e
China is the largest 2024 observation at 736.7607 Mt CO₂e. The United States follows at 418.8684, Indonesia at 283.2002, the Russian Federation at 263.0854, and Iraq at 145.3413. Iran records 132.9178, India 108.1151, Nigeria 75.6290, Canada 71.7201, and Saudi Arabia 69.5496. The arithmetic sum of the 192 numeric rows is 3,222.5142 Mt CO₂e. China represents 22.86% of that reported-row sum, the top three 44.65%, and the top ten 71.53%.
| Rank | Economy | 2024 emissions | Share of 192-row sum |
|---|---|---|---|
| 1 | China | 736.7607 | 22.86% |
| 2 | United States | 418.8684 | 13.00% |
| 3 | Indonesia | 283.2002 | 8.79% |
| 4 | Russian Federation | 263.0854 | 8.16% |
| 5 | Iraq | 145.3413 | 4.51% |
| 6 | Iran, Islamic Rep. | 132.9178 | 4.12% |
| 7 | India | 108.1151 | 3.35% |
| 8 | Nigeria | 75.6290 | 2.35% |
| 9 | Canada | 71.7201 | 2.23% |
| 10 | Saudi Arabia | 69.5496 | 2.16% |
Concentration is pronounced: the five largest observations make up 57.32% of the arithmetic sum and the top 20 account for 82.35%. These shares are calculated directly from the published numeric rows; they are not presented as a separately published official world total. They also describe absolute emissions, not emissions intensity. No population, energy-production, or economic-output denominator is applied.
The median was only 1.1236 Mt CO₂e
The mean across 192 observations is 16.7839 Mt CO₂e, while the median is 1.1236. The first quartile is 0.0883 and the third quartile 7.7942. The mean is about 14.9 times the median because a small number of very large values pull it upward. A typical position in the country distribution is therefore much closer to the median than to the average.
| 2024 emissions band (Mt CO₂e) | Observations |
|---|---|
| 0 | 8 |
| >0–<0.1 | 42 |
| 0.1–<1 | 39 |
| 1–<10 | 62 |
| 10–<100 | 34 |
| ≥100 | 7 |
Eight observations are exactly zero. Another 42 are above zero but below 0.1 Mt CO₂e, 39 are between 0.1 and 1, 62 are between 1 and 10, 34 are between 10 and 100, and only seven are at or above 100. The world map uses a nonlinear color scale so that the many small observations remain visible even though the maximum is more than 700 Mt CO₂e.
High values appear across several major energy-producing regions
The geographic pattern includes very high observations in China, the United States, Indonesia and Russia, along with substantial values in Iraq, Iran and Saudi Arabia. Nigeria and Algeria stand out in Africa, while Canada, Australia, Kazakhstan, Kuwait, Oman and the United Arab Emirates also appear toward the upper part of the distribution. The map is useful for locating where the reported absolute quantity is large, but it should not be treated as an explanation of those values.
Fugitive Emissions (Energy) is an energy-sector classification for methane released outside ordinary fuel combustion and associated with energy supply systems. Countries differ in coal, oil and natural-gas production and processing, infrastructure, operating practices, and inventory structure. The single national indicator does not break the total into those underlying sources, so it cannot establish which fuel or activity dominates an individual country’s value.
Twenty-five source-missing rows are not zero emissions
The 2024 non-aggregate master coverage contains 217 rows. Of these, 192 have numeric values and 25 are missing at source. The missing group includes Andorra, American Samoa, the Faroe Islands, Greenland, Liechtenstein, Monaco, Montenegro, Serbia, South Sudan, Kosovo and other separately reported geographic units. None is assigned a zero merely to complete the map or the calculations.
That is different from the eight official zero observations: Antigua and Barbuda, Bermuda, the Cayman Islands, Grenada, Iceland, St. Kitts and Nevis, Malta, and Seychelles. Those values remain in the numeric distribution. The map directly represents 189 of the 192 numeric rows through polygons or centroid points. Myanmar, the Turks and Caicos Islands, and the British Virgin Islands remain in all statistics but are not drawn because compatible plotting geometry was unavailable.
Mt CO₂e is not the physical mass of CH₄
Although the indicator is explicitly about methane, its unit is million tonnes of CO₂ equivalent. The number represents the climate-accounting equivalent of the methane emissions rather than the physical mass of CH₄ itself. The AR5 suffix is part of the indicator identity and identifies the conversion basis used for this series. A physical-methane-mass series or another CO₂e conversion version should not be merged into the same time series without checking definitions.
CO₂e also does not turn this into an all-greenhouse-gas indicator. Carbon dioxide, nitrous oxide and other gases are not added to the values shown here. Nor does the series include methane assigned to agriculture, waste, buildings or other sectors. The valid scope remains methane from Fugitive Emissions within the Energy category.
This is distinct from Building Energy methane
A closely related World Bank series can measure methane from Building (Energy). Its indicator identity uses a different sector component from the FE code used here. Both series can share the same year, gas and Mt CO₂e unit while describing different parts of the emissions inventory. Their numbers are therefore not substitutes and should not be combined simply because both headlines contain energy methane emissions.
This distinction is also important for duplicate detection. Statistical identity should be based on indicator code, greenhouse gas, sector, conversion basis, year, unit, and geographic coverage rather than text similarity alone. FE and BU represent different sector questions, while a national-total methane indicator would be broader again.
Absolute emissions are not emissions intensity
The ranking compares absolute emissions. It does not tell us which economy releases more methane per person, per unit of fossil-fuel production, or per unit of energy supplied. Those analyses require compatible denominators. Large energy-producing economies can rank high in absolute terms while having very different intensity profiles. Calling the table an efficiency ranking would therefore go beyond the evidence.
A single 2024 cross-section also cannot establish a trend. The fact that China has the largest value in 2024 does not tell us whether its fugitive methane emissions increased or decreased from earlier years. A trend needs multiple observations from the same EN.GHG.CH4.FE.MT.CE.AR5 definition. Mixing another sector or conversion version into the sequence could make a methodological change look like a real emissions change.
Five checks keep the comparison precise
- Use the exact indicator EN.GHG.CH4.FE.MT.CE.AR5 for methane from Fugitive Emissions (Energy).
- Keep the unit as million tonnes CO₂e rather than relabeling it as physical tonnes of CH₄.
- Use the 192 numeric observations and preserve the 25 source-missing rows as missing.
- Treat the values as absolute emissions, not per-capita or per-unit-energy intensity.
- Do not infer a cause or time trend from one 2024 cross-section.
The direct source is the World Bank World Development Indicators EN.GHG.CH4.FE.MT.CE.AR5 API series. The comparison uses the 2024 non-aggregate numeric observations and does not impute missing source values.
Frequently Asked Questions
Which economy had the largest Fugitive Energy methane emissions in 2024?
Among 192 numeric observations, China was highest at 736.7607 Mt CO₂e, followed by the United States at 418.8684 and Indonesia at 283.2002.
Does Mt CO₂e mean the physical mass of methane?
No. The indicator expresses methane emissions in carbon-dioxide-equivalent terms. It should not be relabeled as million tonnes of physical CH₄.
Were source-missing economies treated as zero?
No. The non-aggregate 2024 master coverage contains 217 rows, 192 with numeric values and 25 missing at source. Missing values remain missing.
Related Articles
Green Map creates custom-edited map images using open geographic data sources such as geoBoundaries, Natural Earth, OpenStreetMap, and government open data. These maps are edited visual materials, not raw data files, and are provided for education, documents, presentations, and graphic reference.