U.S. state distillate fuel oil consumption can look repetitive across EIA series until the sector and field are fixed. This 2024 comparison uses fueltypeid=DFO, sectorid=99 (All Sectors), field=total-consumption, annual frequency, and the EIA-published unit of thousand short tons. The data contain 51 jurisdictions—the 50 states plus the District of Columbia. That makes this a broader scope than the Electric Power sector 98 or the Electric Power Sector Non-CHP category 90. It also differs from an electricity-generation-only consumption field. Keeping those dimensions visible is essential to understanding what the state values mean.
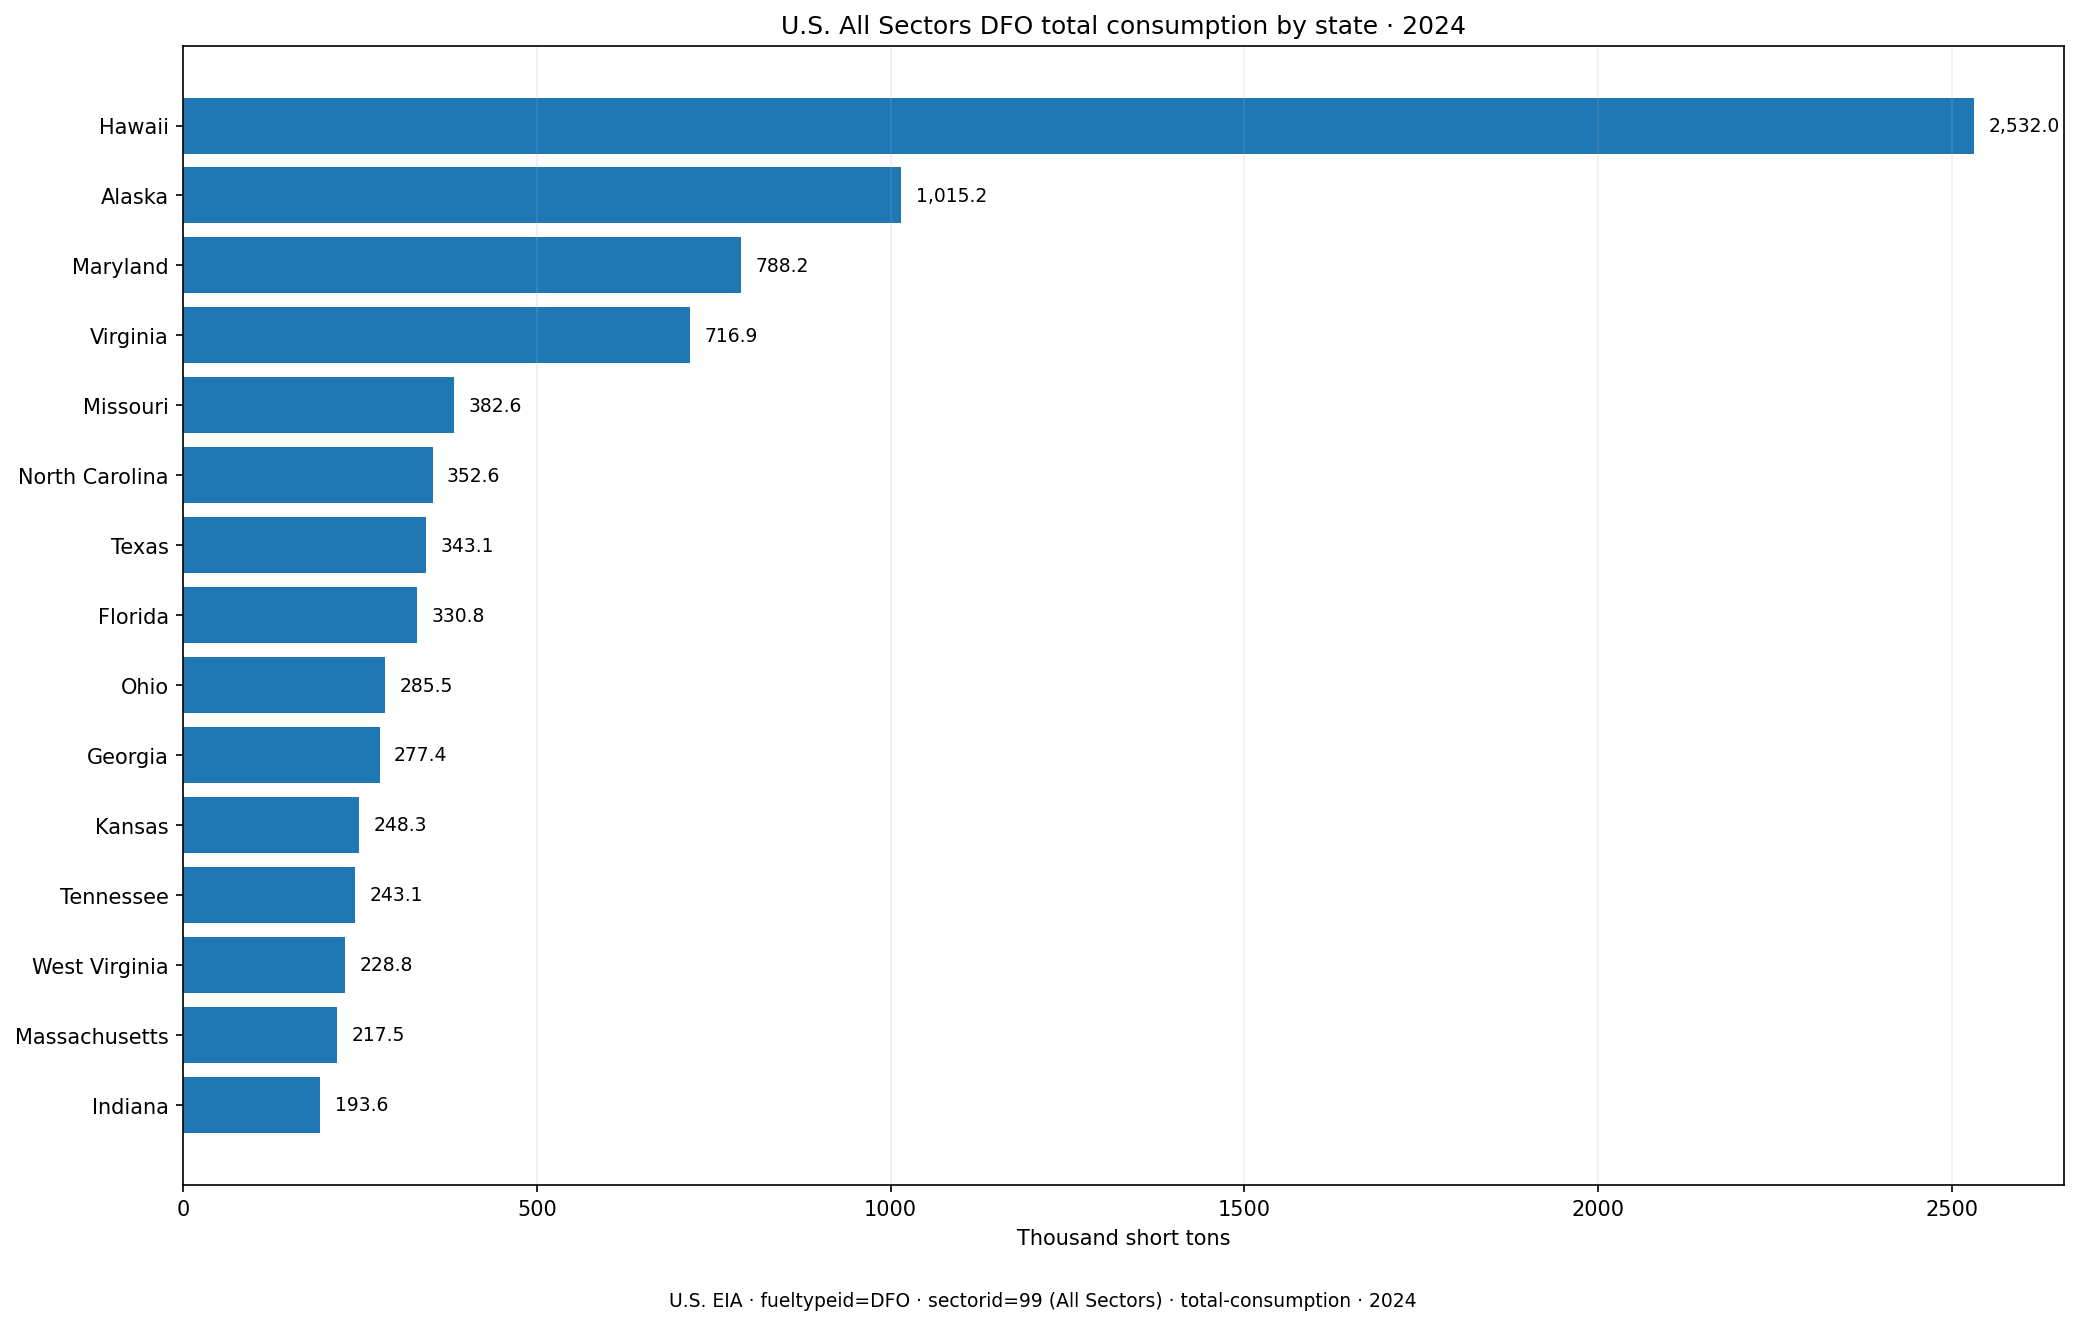
Table of Contents
Hawaii recorded 2,531.977 thousand short tons
The simple sum across all 51 jurisdictions is 10,690.873 thousand short tons. Hawaii is the largest observation at 2,531.977, equal to 23.68% of that sum. Alaska follows at 1,015.218 (9.50%), while Maryland records 788.208 (7.37%). Virginia is also prominent at 716.887. The top three jurisdictions account for 40.55% of the total, the top five for 50.84%, and the top ten for 65.70%. The distribution is therefore strongly concentrated toward a small number of high-value states.
| Rank | State or jurisdiction | Total consumption | Share of 51-row sum |
|---|---|---|---|
| 1 | Hawaii | 2,531.977 | 23.68% |
| 2 | Alaska | 1,015.218 | 9.50% |
| 3 | Maryland | 788.208 | 7.37% |
| 4 | Virginia | 716.887 | 6.71% |
| 5 | Missouri | 382.612 | 3.58% |
| 6 | North Carolina | 352.558 | 3.30% |
| 7 | Texas | 343.150 | 3.21% |
| 8 | Florida | 330.793 | 3.09% |
| 9 | Ohio | 285.497 | 2.67% |
| 10 | Georgia | 277.401 | 2.59% |
The arithmetic mean is 209.625, while the median is only 95.881. The first quartile is 39.495 and the third quartile is 223.169. The large gap between the mean and median reflects a long upper tail dominated by Hawaii and, to a lesser degree, Alaska, Maryland, and Virginia. For describing a typical jurisdiction, the median and quartiles are therefore more informative than the mean alone.
The dataset includes the District of Columbia
Unlike several related electric-power slices that contain only the 50 states, this All Sectors selection includes the District of Columbia, producing 51 rows. D.C. is the minimum at 0.075 thousand short tons, but it is not zero. In fact, the number of exact-zero observations is 0. That matters because the lower end of the distribution is made up of published numeric values rather than missing observations replaced with zeros.
Coverage is part of the statistical identity. Two EIA articles can both mention U.S. state distillate fuel oil in 2024 while differing in whether D.C. is present, which sector is selected, or which consumption field is used. A 50-state table should not automatically be combined with a 51-jurisdiction table unless the other dimensions also match.
Sector 99 means All Sectors
The defining sector facet here is 99, labeled All Sectors. The same EIA operational route contains narrower categories such as sector 98, Electric Power, and sector 90, Electric Power Sector Non-CHP. Changing the sector changes the population of activity included in the statistic, even when DFO, year, and unit are unchanged. That is why the values in this comparison legitimately differ from related 2024 DFO pages on the site.
For duplicate checking, the safest identity test is not the headline. Fuel, sector, field, frequency, year, unit, and geographic coverage should be checked together. If those dimensions match, a second article would likely repeat the same statistic. If sector 98, 90, or 99 differs, the observed universe differs. This article therefore keeps All Sectors visible in the title and interpretation rather than using a generic electricity fuel consumption label.
Total consumption is broader than fuel used only for electricity generation
The field is total-consumption. EIA also publishes fields that isolate fuel consumed for electricity generation and fuel assigned to useful thermal output. A total-consumption series is broader because it reflects the combined total within the selected sector scope. This distinction can matter where combined heat and power activity or useful thermal output is present. A state value from a generation-only field should not be substituted for the total-consumption value even if the state ranking looks similar.
This also explains why field names must travel with the numbers when data are reused. Consumption-for-eg answers where physical fuel use for electricity generation is largest. Consumption-uto isolates fuel associated with useful thermal output. Total-consumption asks for the broader total. Generation fields measure electricity output rather than fuel input. Similar words in article titles do not make these measures interchangeable.
Thousand short tons is a physical fuel unit
The EIA unit carried by this series is thousand short tons. It is a physical quantity of fuel, not an electricity-output unit such as MWh and not a heat-content unit such as million MMBtu. Physical fuel quantity, energy input, and electricity output are related but distinct measurements. Converting from one to another requires additional information such as heat content and conversion efficiency, neither of which is supplied by this single state series.
Hawaii’s 23.68% share must therefore be stated narrowly. It is Hawaii’s share of the sum of the 51 published observations for DFO, sector 99, total-consumption, and 2024. It is not Hawaii’s share of all U.S. petroleum consumption, and it is not the share of Hawaii’s electricity generated from oil. A dependence measure would require an appropriate denominator such as total fuel input or total generation under a consistent scope.
The top ten account for about 65.7% of the reported total
The concentration remains high beyond the first few states. The top ten jurisdictions together contribute 65.70% of the 51-row sum, and the top five alone contribute 50.84%. This makes a linear chart visually dominated by the leaders. Smaller values should not be dismissed, however, because they are genuine observations and together describe the long lower portion of the distribution.
States around the middle of the ranking often fall near or below a few hundred thousand short tons, far below Hawaii. That spread is one reason the median is much lower than the mean. Looking only at Hawaii and Alaska would miss the broad set of states with modest but positive reported consumption; looking only at the mean would overstate the center of the distribution.
Sector and field must be checked together
The EIA operational API is multidimensional, so nearly identical article titles can hide different statistics. All Sectors total-consumption and Electric Power total-consumption share the same fuel and year but not the same sector scope. Within one sector, total-consumption and consumption-for-eg answer different questions. Conversely, small numerical differences do not automatically establish a new metric. The identity comes from the dimensions and unit, not from the prose title or the size of the values.
A single 2024 cross-section does not establish causes
These data identify where All Sectors DFO total consumption was large in 2024, but they do not explain why. Plant fleets, combined heat and power activity, operating schedules, fuel-delivery arrangements, backup or peaking use, and other local system characteristics could contribute. Testing those explanations would require plant-level or sector-specific evidence beyond the state totals in this series. The high values in Hawaii, Alaska, Maryland, or Virginia should therefore be treated as descriptive findings rather than causal conclusions.
The same limitation applies to trends. One year cannot establish whether a state is rising or falling. A valid time series would need the same DFO fuel facet, sector 99, total-consumption field, unit, and geographic coverage for each year. Pulling a sector 98 or generation-only value from another article and treating it as an earlier observation would mix different metrics.
Four checks keep comparisons consistent
- Fuel: DFO is distillate fuel oil and should not be merged with broader petroleum categories.
- Sector: sectorid=99 is All Sectors, distinct from sector 98 Electric Power and sector 90 Non-CHP.
- Field: total-consumption is broader than generation-only or useful-thermal-output-only consumption fields.
- Unit: thousand short tons is a physical fuel quantity and should not be relabeled as MWh, MMBtu, cost, emissions, or a power-mix percentage.
The direct source is U.S. Energy Information Administration Open Data. The comparison keeps annual 2024, DFO, sector 99, total-consumption, and thousand short tons fixed across every jurisdiction. Those dimensions should remain unchanged in any future refresh or year-to-year comparison.
Frequently Asked Questions
Which jurisdiction had the highest 2024 All Sectors DFO total consumption?
Hawaii was highest at 2,531.977 thousand short tons, equal to 23.68% of the sum of the 51 published observations.
Are sector 99 and sector 98 the same scope?
No. Sector 99 is All Sectors, while sector 98 is Electric Power. Changing the sector changes the activity included even when fuel and year stay the same.
Does total-consumption mean fuel used only for electricity generation?
No. It is broader than consumption-for-eg and represents total fuel consumption within the selected sector scope, including use associated with electricity generation and useful thermal output.
Related Articles
Green Map creates custom-edited map images using open geographic data sources such as geoBoundaries, Natural Earth, OpenStreetMap, and government open data. These maps are edited visual materials, not raw data files, and are provided for education, documents, presentations, and graphic reference.