Households and NPISHs final consumption expenditure per capita is a national-accounts measure of the goods and services consumed by the household sector and nonprofit institutions serving households, divided by the general population. This analysis uses World Bank indicator NE.CON.PRVT.PC.KD, expressed in constant 2015 U.S. dollars. The dataset contains the most recent non-empty observation for 180 economies, not a uniform 2025 cross-section. Of those 180 observations, 129 are dated 2025. To avoid turning mixed-year data into a false 2025 ranking, the article separates the 129-economy 2025 comparison from the broader latest-available dataset.
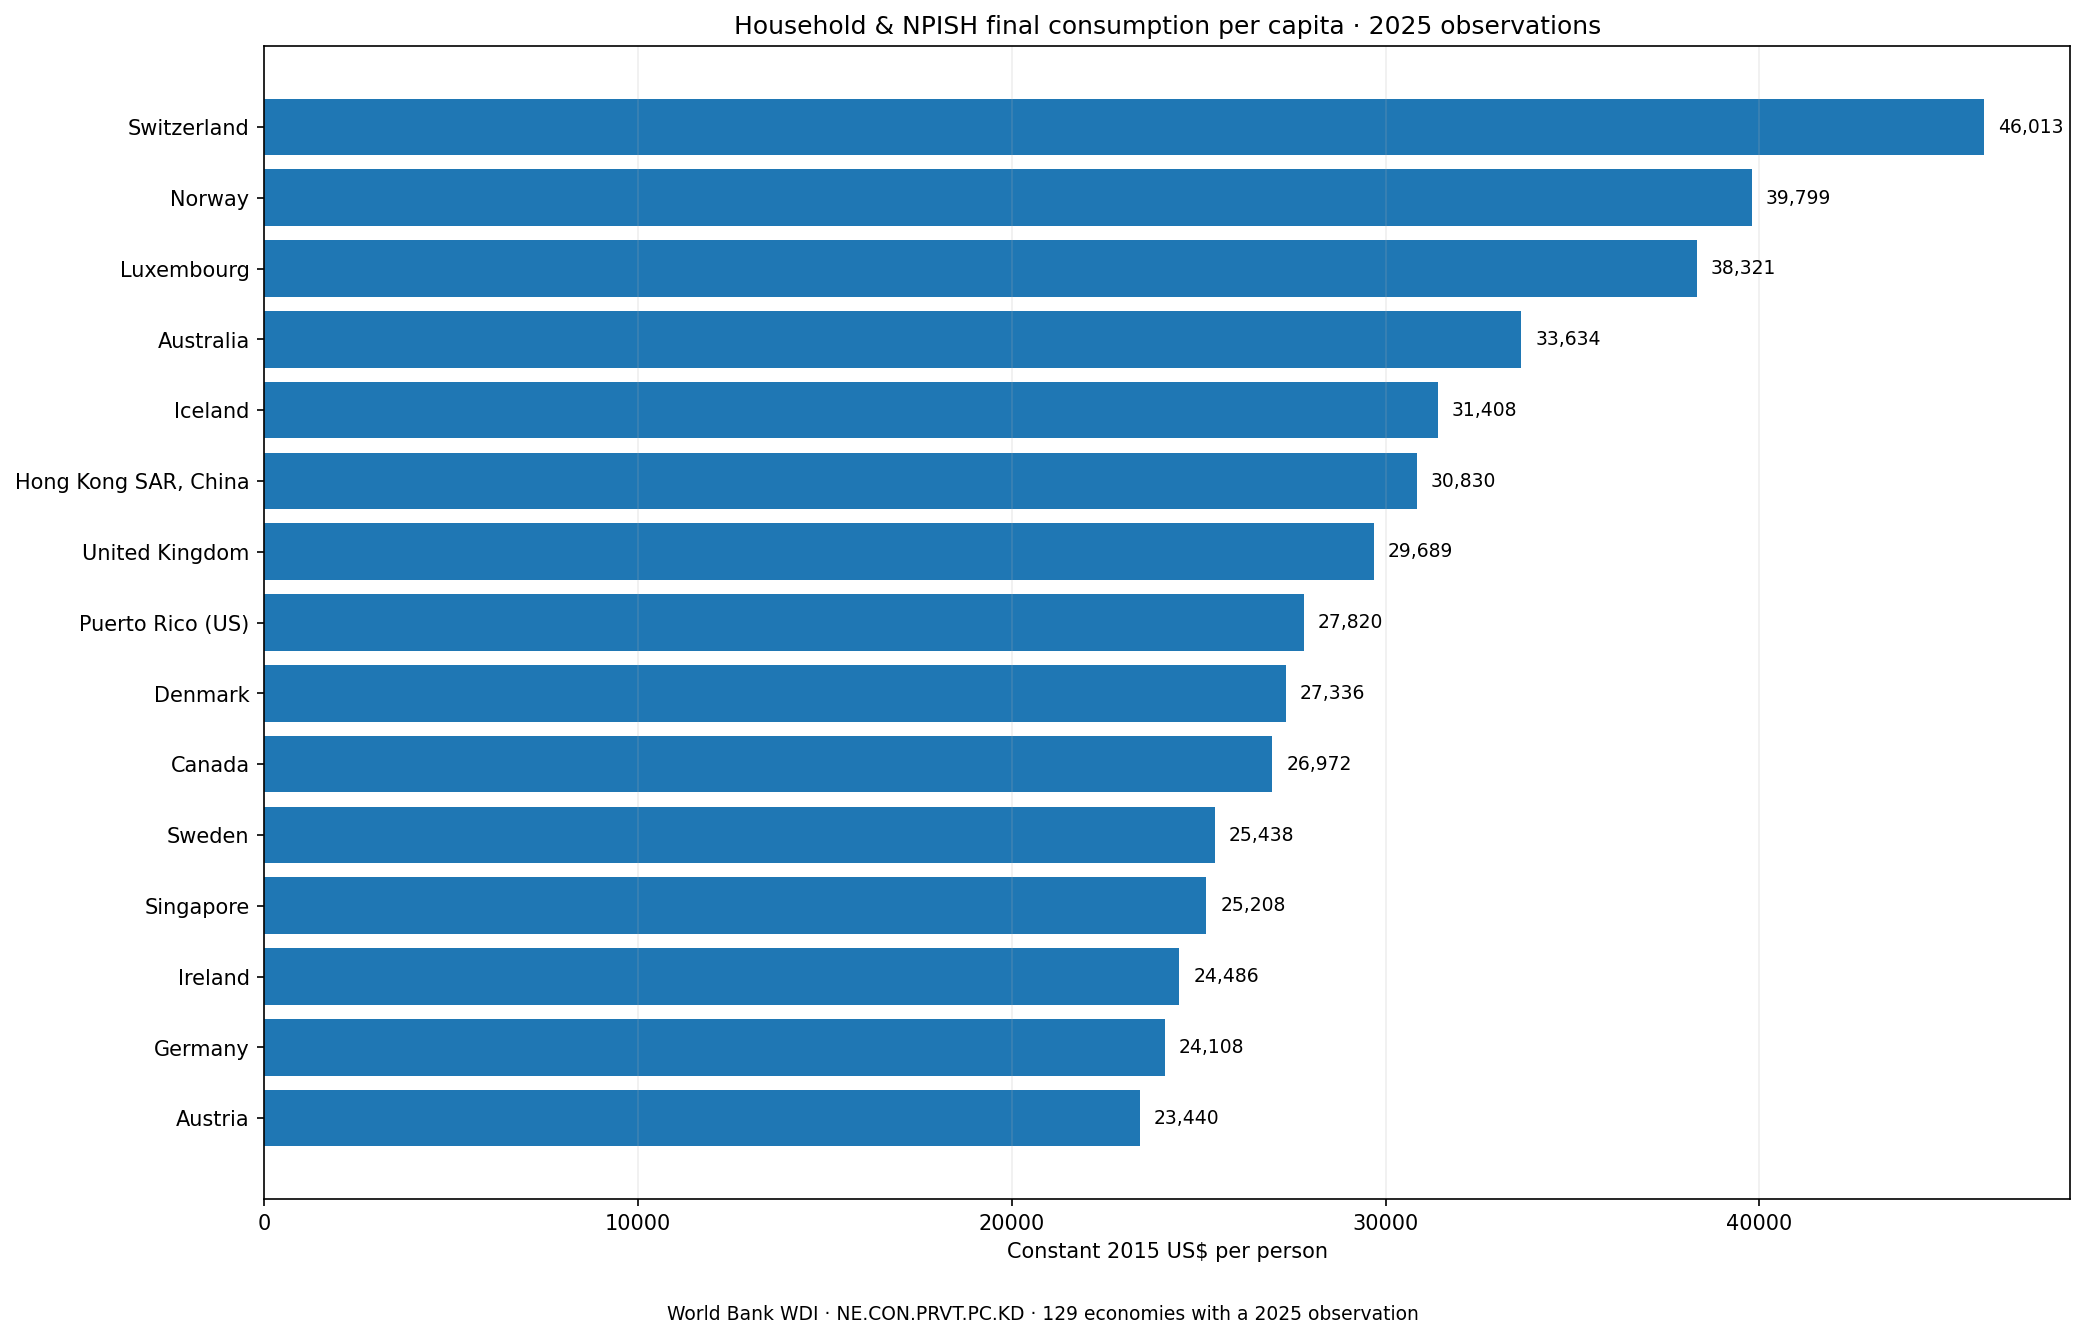
Table of Contents
Switzerland led the economies with a 2025 observation
Among the 129 economies that actually have a 2025 observation in the supplied dataset, Switzerland recorded the highest value at about $46,013 per person. Norway followed at $39,799 and Luxembourg at $38,321. Australia reached $33,634, Iceland $31,408, and Hong Kong SAR, China $30,830. The United Kingdom, Puerto Rico, Denmark, and Canada completed the top ten, all above roughly $26,900 per person. These figures are not current-dollar household spending totals. They are constant-price national-accounts values designed to remove general price change over time using 2015 as the reference year.
| Rank | Economy | Constant 2015 US$ per person | Year |
|---|---|---|---|
| 1 | Switzerland | 46,013 | 2025 |
| 2 | Norway | 39,799 | 2025 |
| 3 | Luxembourg | 38,321 | 2025 |
| 4 | Australia | 33,634 | 2025 |
| 5 | Iceland | 31,408 | 2025 |
| 6 | Hong Kong SAR, China | 30,830 | 2025 |
| 7 | United Kingdom | 29,689 | 2025 |
| 8 | Puerto Rico (US) | 27,820 | 2025 |
| 9 | Denmark | 27,336 | 2025 |
| 10 | Canada | 26,972 | 2025 |
A high value should not be treated as a complete score of living standards. The indicator covers final consumption by households and NPISHs, then divides the aggregate by population. It does not directly describe how consumption is distributed across households, how much wealth households own, whether housing costs are affordable, or how much health and education are supplied through government consumption instead of household consumption. Two economies can therefore have similar values while differing substantially in public-service provision, inequality, prices, household composition, and the mix of goods and services consumed.
The 2025 median was about $4,095 per person
The 129 observations dated 2025 had a median of about $4,095 per person. The first quartile was approximately $1,532, while the third quartile was about $11,278. The mean, roughly $8,749, was more than twice the median because a relatively small group of high-value economies pulled the average upward. For a skewed cross-country distribution like this one, the median and quartiles give a better sense of the middle of the dataset than the mean alone.
| 2025 value band | Number of economies |
|---|---|
| <2,000 | 38 |
| 2,000–4,999 | 31 |
| 5,000–9,999 | 21 |
| 10,000–19,999 | 17 |
| ≥20,000 | 22 |
The distribution reinforces that point. Thirty-eight economies were below $2,000 per person, 31 were between $2,000 and $4,999, 21 were between $5,000 and $9,999, 17 were between $10,000 and $19,999, and 22 were at or above $20,000. Switzerland’s value was about 11.2 times the 2025 median. At the lower end, Burundi was about $195, the Democratic Republic of the Congo about $303, and Madagascar about $337. The spread is economically meaningful, but the dataset by itself does not identify a single cause for those differences. Income, prices, economic structure, demographics, public provision, measurement systems, and many other factors can matter.
The 180 latest observations do not form a single-year ranking
Only 71.7% of the 180 rows are dated 2025. Another 30 observations are dated 2024, four are from 2023, and five are from 2022. Twelve rows use still older latest observations from 2015, 2016, 2018, or 2020. Combining 2024 and 2025 covers 88.3% of the dataset, which is substantial, but it still leaves 21 economies whose latest available value predates 2024. A table that sorts all 180 rows can be useful as a latest-available reference, yet it should not be labeled a 2025 world ranking.
| Latest observation year | Economies |
|---|---|
| 2025 | 129 |
| 2024 | 30 |
| 2023 | 4 |
| 2022 | 5 |
| 2020 | 1 |
| 2018 | 1 |
| 2016 | 1 |
| 2015 | 9 |
The median across all 180 latest-available values is about $4,844, but that number mixes observation years. Bermuda, for example, has a 2024 value near $49,424 and the United States a 2024 value near $46,041, so they appear above Switzerland when every latest observation is sorted together. The Faroe Islands, by contrast, retain a 2015 observation as their latest value in the dataset. This illustrates why year labels are essential. The values are valid observations from the World Bank series, but the older rows have weaker same-period comparability with 2025 observations.
Constant 2015 U.S. dollars are not the same as PPP dollars
The World Bank metadata defines the underlying concept as expenditure on goods and services by the household and NPISH sector for the direct satisfaction of human needs or wants. The per-capita series divides the core indicator by the general population. It is then expressed at constant prices, with 2015 as the reference year, and reported in U.S. dollars. The constant-price treatment is intended to reduce the effect of price changes over time, which makes the series useful for tracking real consumption within an economy across years.
That does not make the measure a purchasing-power-parity indicator. PPP-based consumption series address cross-economy price-level differences through a different conversion framework, and the World Bank lists PPP consumption measures separately from NE.CON.PRVT.PC.KD. This distinction is especially important because a PPP article may look similar at first glance while answering a different question. The present article is specifically about household and NPISH final consumption per person in constant 2015 U.S. dollars, not current dollars and not current international dollars at PPP.
What this indicator can and cannot tell you
The indicator is useful for comparing the scale of household-sector real consumption per person and for following its change through time when a consistent series is available. It can help identify economies with relatively high or low national-accounts consumption per capita and can serve as one component of broader analysis of living conditions or domestic demand. However, this dataset contains only the latest non-empty observation for each economy. It therefore does not provide enough information to calculate a new multi-year growth rate, identify turning points, or establish whether an economy has been rising or falling over a specified interval.
It is also not a household survey measure. Dividing an aggregate national-accounts value by population creates an average per person; it does not mean each person consumed that amount. Distribution within the population is invisible here. Nor is the indicator a measure of disposable income, wealth, savings, or total welfare. Analysts who want to compare material living standards across economies should normally read it alongside PPP measures, household income, price levels, inequality, public services, and other indicators rather than treating one series as a complete ranking of well-being.
Three checks make this dataset easier to use correctly
- Check the observation year for each row. The dataset uses the most recent non-empty value for each economy, so a row can be older than 2025.
- Keep the unit exact: constant 2015 U.S. dollars per person. Do not relabel the figures as current U.S. dollars or PPP international dollars.
- Keep the concept exact: household and NPISH final consumption expenditure divided by population is not personal income, household wealth, or government final consumption.
The primary source is the World Bank NE.CON.PRVT.PC.KD indicator page. The World Bank metadata identifies the series as part of the World Development Indicators and reports official national statistics, national-accounts files, central-bank data, and World Bank staff estimates among its sources. The data used here were retrieved on September 16, 2026. Because the API can receive later revisions or newer observations, future reproductions should record both the extraction date and each economy’s observation year.
Frequently Asked Questions
Are all 180 observations from 2025?
No. The dataset contains 129 observations dated 2025 and 51 latest-available observations from earlier years. The full 180-row table should therefore be described as latest available, not as a 2025 ranking.
Is constant 2015 U.S. dollars the same as PPP?
No. Constant 2015 U.S. dollars adjust for price change over time, while PPP-based measures use a separate conversion intended to account for price-level differences across economies.
Does this indicator measure personal income?
No. It measures household and NPISH final consumption expenditure in the national accounts divided by population. It is not disposable income, household wealth, or a household survey statistic.
Related Articles
Green Map creates custom-edited map images using open geographic data sources such as geoBoundaries, Natural Earth, OpenStreetMap, and government open data. These maps are edited visual materials, not raw data files, and are provided for education, documents, presentations, and graphic reference.