World Bank indicator SI.POV.UMIC.GP measures the poverty gap at $8.30 a day in 2021 PPP. It calculates the shortfall of income or consumption from the $8.30 poverty line, assigns a zero shortfall to people above the line, averages the shortfall across the whole population, and expresses the result as a percentage of the poverty line. The measure therefore reflects both how widespread poverty is and how far below the line people are.
The latest-available dataset contains 171 economies, but the observation years range from 1992 to 2025. The map is therefore a latest-value map, not a same-year global ranking. The median across those latest observations is 10.9% and the mean is 20.2%, but neither number should be described as the current world poverty gap because the survey years differ widely.
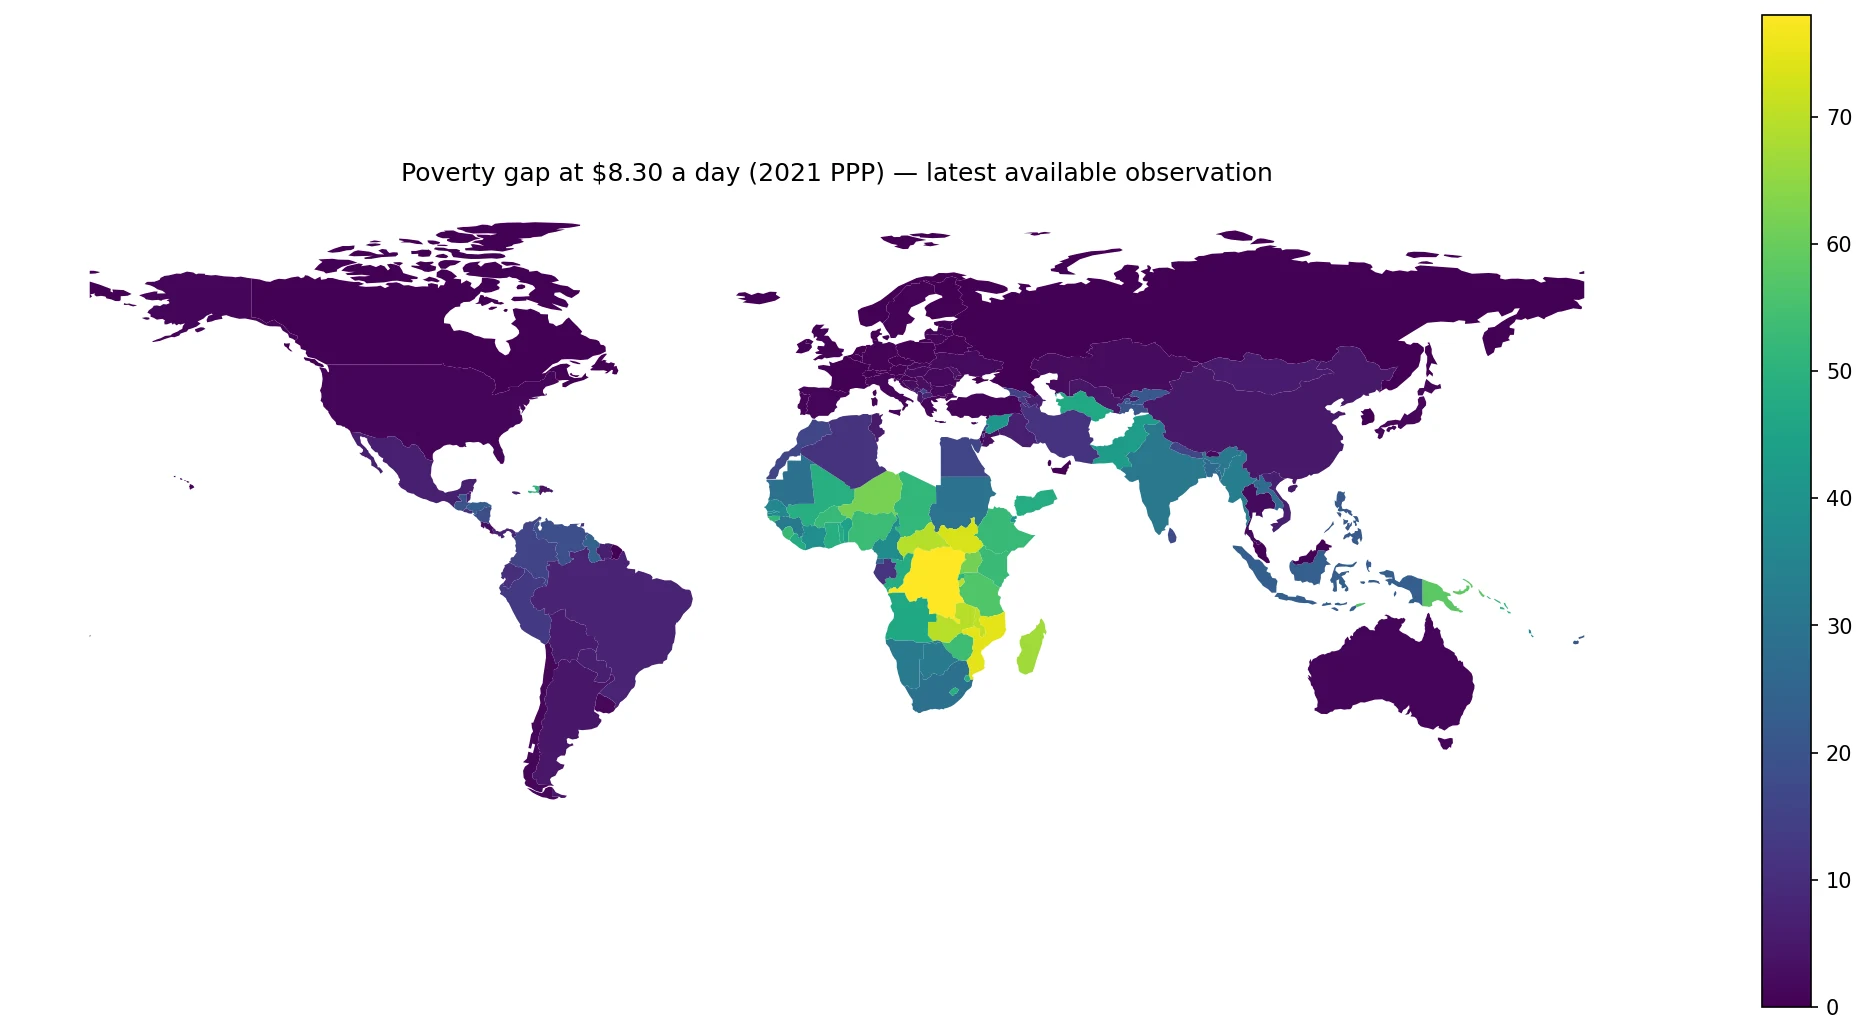
Table of Contents
How the poverty gap differs from the poverty headcount
The poverty headcount asks what percentage of people live below the line. The poverty gap adds information about depth. Two economies can have the same headcount but different poverty gaps if poor households in one economy are clustered just below $8.30 while poor households in the other are much further below the line.
The nonpoor are included in the calculation with a shortfall of zero. That detail is essential. A poverty gap of 20% does not mean that poor people, on average, are 20% below the line. It means the average shortfall across the entire population equals 20% of the poverty line. This is why the indicator combines incidence and depth rather than measuring depth among poor people alone.
$8.30 is a 2021 PPP poverty line, not an observation year
The World Bank uses several international poverty lines. The $8.30 line in 2021 PPP represents a higher standard associated with upper-middle-income countries. Purchasing power parity adjusts for differences in price levels across economies, so $8.30 in this context is not simply converted with market exchange rates.
The phrase “2021 PPP” refers to the purchasing-power benchmark used to express the poverty line. It does not mean the household survey was conducted in 2021. A country’s value may come from 2023, 2020 or another year. Keeping the PPP benchmark separate from the observation year prevents a common misreading of poverty statistics.
The latest-value map combines observations from 1992 to 2025
Only four of the 171 latest observations are from 2025. Twenty-one are from 2024 and 37 from 2023. Another 45 are from 2021–2022, 40 from 2016–2020, and several are older still. The oldest latest observation in this set dates to 1992. Household-survey schedules are not synchronized across countries, which creates this uneven timing.
| Observation period | Economies | Treatment in this article |
|---|---|---|
| 2025 | 4 | Latest year, but very few economies |
| 2024 | 21 | Part of latest-available coverage |
| 2023 | 37 | Largest same-year subset |
| 2021–2022 | 45 | Included in latest-value map with year caveat |
| 2016–2020 | 40 | Interpreted with explicit year difference |
| 2010–2015 | 18 | Older latest observations |
| Before 2010 | 6 | Historical latest observations only |
A color difference on the map can therefore reflect both a real difference in poverty and a difference in survey timing. The latest-value view is useful for broad geographic coverage, but same-year subsets are better when the purpose is a tightly synchronized comparison.
Several latest observations show very large poverty gaps
The largest latest values are the Democratic Republic of the Congo at 78.0% in 2020, Mozambique at 74.8% in 2022, South Sudan at 73.2% in 2016, Malawi at 70.4% in 2019, Burundi at 69.9% in 2020, Zambia at 69.6% in 2022, the Central African Republic at 69.2% in 2021 and Madagascar at 66.8% in 2021.
These values indicate very large average shortfalls from the $8.30 line across the whole population. They should not be treated as a current ranking, because the underlying survey dates differ by as much as several years. Economic shocks, growth, inflation and social-policy changes can occur between those observation years.
| Economy | Observation year | Poverty gap |
|---|---|---|
| Congo, Dem. Rep. | 2020 | 78.0% |
| Mozambique | 2022 | 74.8% |
| South Sudan | 2016 | 73.2% |
| Malawi | 2019 | 70.4% |
| Burundi | 2020 | 69.9% |
| Zambia | 2022 | 69.6% |
| Central African Republic | 2021 | 69.2% |
| Madagascar | 2021 | 66.8% |
| Niger | 2021 | 61.9% |
| Uganda | 2019 | 61.6% |
Reported zeros are not missing observations
There are 3 official zero values in the latest-observation set: Cyprus in 2023, Qatar in 2017 and Slovenia in 2023. Several other high-income economies have values of 0.1% or 0.2%. These are reported poverty-gap observations, not blank values that were filled with zero.
Missing data must remain separate. A reported zero says the measured average shortfall at this poverty line is essentially zero in that survey. A missing value says no comparable observation is available. Treating those two states as equivalent would materially distort a poverty map.
| Economy | Observation year | Poverty gap |
|---|---|---|
| Cyprus | 2023 | 0.0% |
| Qatar | 2017 | 0.0% |
| Slovenia | 2023 | 0.0% |
| United Arab Emirates | 2018 | 0.1% |
| Belgium | 2023 | 0.1% |
| France | 2023 | 0.1% |
| Ireland | 2023 | 0.1% |
| Luxembourg | 2023 | 0.1% |
| Netherlands | 2021 | 0.1% |
| Switzerland | 2022 | 0.2% |
The largest same-year subset is 2023 with 37 economies
The year with the most observations in this latest-value file is 2023, with 37 economies. Their median poverty gap is 1.0% and mean 4.5%, with the middle half between 0.3% and 2.9%. These statistics are synchronized by year, but the 37 economies are not a representative sample of the world.
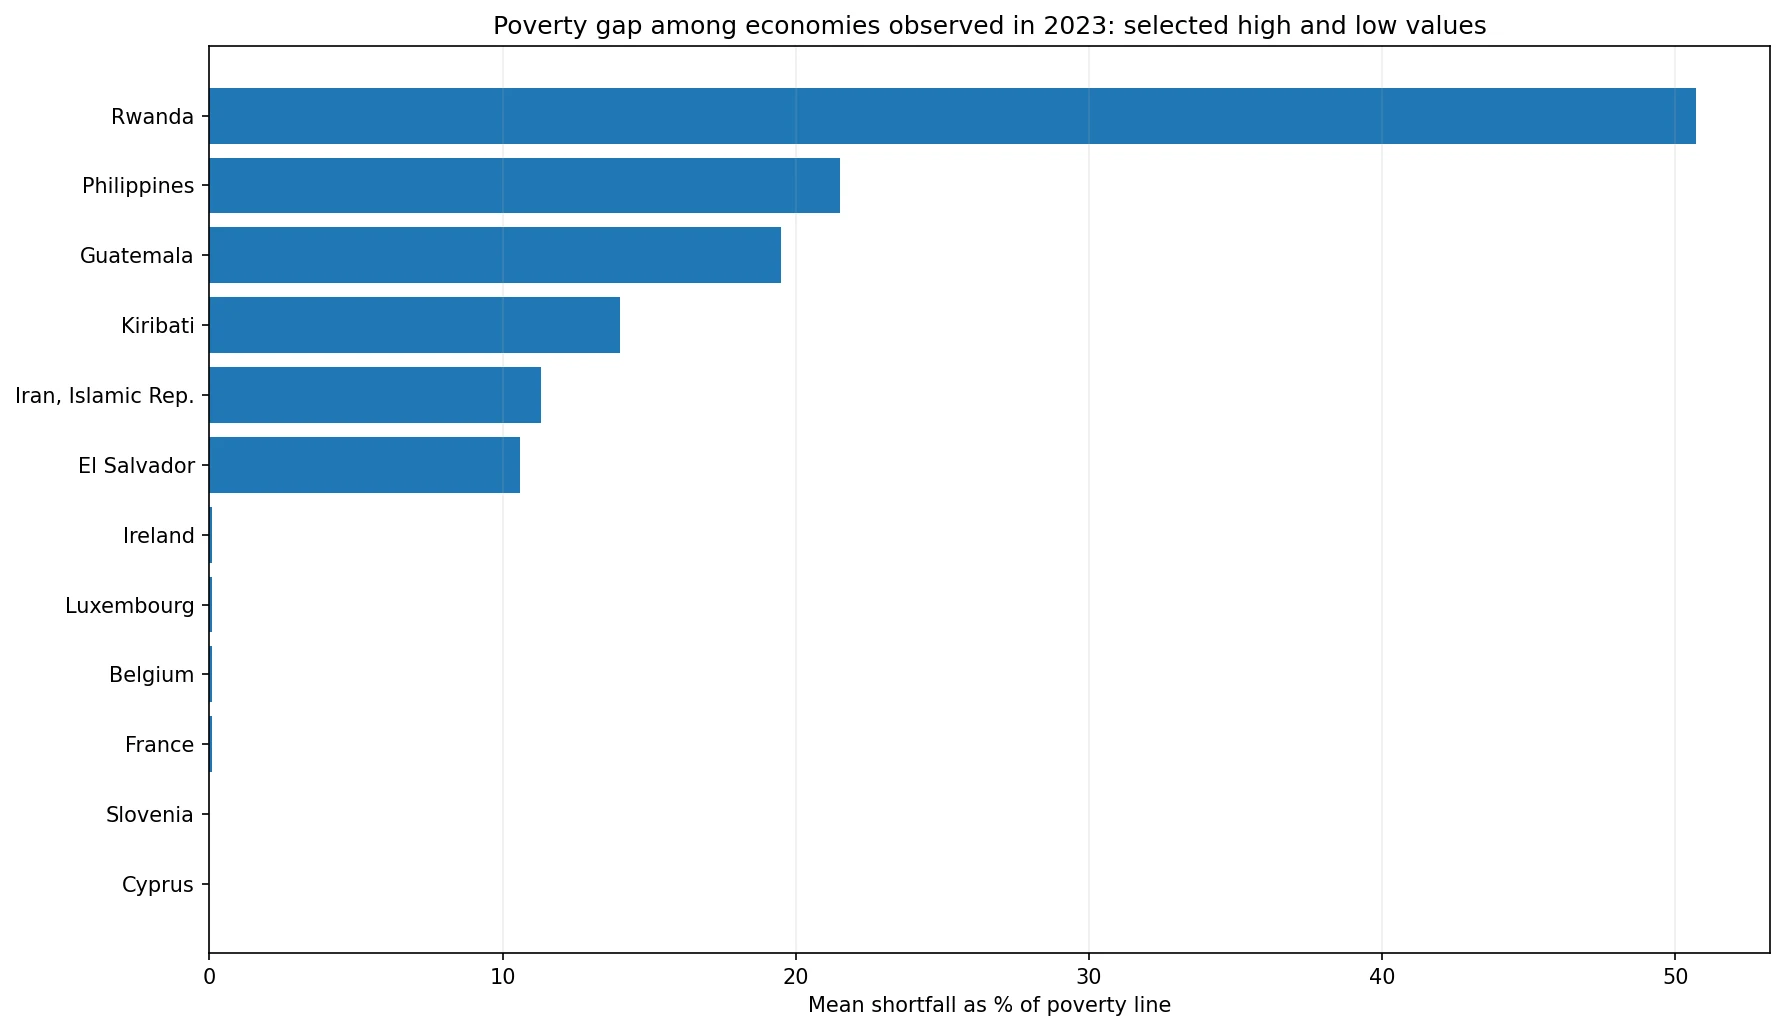
Rwanda has the largest 2023 value at 50.7%, followed by the Philippines at 21.5%, Guatemala at 19.5%, Kiribati at 14.0%, Iran at 11.3% and El Salvador at 10.6%. Same-year timing improves comparability, but differences in whether welfare is measured through income or consumption and differences in survey design still matter.
Many European 2023 observations are near or below 1%
In the 2023 subset, Cyprus and Slovenia report 0.0%. Belgium, France, Ireland and Luxembourg are at 0.1%, Czechia and Norway at 0.2%, Finland and the Russian Federation at 0.3%, and Denmark and Poland at 0.4%. In the same year, Rwanda, the Philippines and Guatemala are much higher.
The geographic contrast demonstrates how differently the $8.30 line intersects national income or consumption distributions. The indicator alone cannot explain why. Average income, inequality, social protection, prices, employment and survey design can all contribute, and causal explanations require additional evidence.
The latest-value median of 10.9% is not a current global median
Across the 171 latest observations, the median is 10.9%, the mean 20.2%, the first quartile 1.8% and the third quartile 36.2%. Those statistics describe the distribution of the latest values stored for each economy, not a single global reference year.
Among these latest observations, 29 are below 1%, 53 are from 1% to under 10%, 39 are from 10% to under 30%, and 50 are at least 30%. These bands are useful for describing latest-known poverty depth, but not for fine comparisons of recent policy performance.
The same poverty-gap value can arise from different poverty patterns
A poverty gap of 10% can be produced by different combinations of headcount and depth. A relatively large group just below the poverty line can generate a similar gap to a smaller group living much further below the line. The gap alone therefore cannot separate the number of poor people from the average depth among poor people.
The closest companion measure is the poverty headcount at the same $8.30 line. Looking at headcount and gap together helps distinguish broad shallow poverty from less widespread but deeper poverty. More detailed distributional measures are still needed for a full picture.
The 2021 PPP revision matters for long-run comparisons
International poverty lines are updated when purchasing-power-parity benchmarks change. The $8.30 threshold used here is expressed in 2021 PPP. Similar-looking poverty lines published under older PPP systems are not automatically comparable point for point because the conversion framework changed.
For long-run trends, the safest approach is to use a consistently recalculated series under the same PPP standard, such as the World Bank Poverty and Inequality Platform series. This article does not splice older-PPP publications into the 2021-PPP indicator.
Income and consumption surveys can differ across economies
World Bank poverty statistics are based on household survey data and may use consumption or income depending on the country’s data system. High-income economies often draw on the Luxembourg Income Study. Survey instruments, nonresponse treatment, price adjustment and the welfare concept can therefore vary even within a harmonized international indicator.
The World Bank standardizes the measure to support comparison, but small decimal differences should not be interpreted as perfectly precise rankings. Broad ranges, repeated observations and larger differences are generally more informative than tiny gaps between neighboring economies.
What the map can and cannot answer
The latest-value map is useful for seeing where large poverty gaps are concentrated, where very low values appear, and where neighboring economies differ sharply. Displaying observation years alongside values helps distinguish recent surveys from old latest observations.
The map cannot identify the causes of poverty, prove that a policy worked, or show whether an economy improved or deteriorated recently. Those questions require a time series for the same economy plus headcount, growth, inflation, employment and social-protection evidence.
Source and interpretation limits
The source is World Bank World Development Indicators series SI.POV.UMIC.GP, based on the Poverty and Inequality Platform. The poverty gap is the mean income or consumption shortfall from the $8.30-a-day poverty line in 2021 PPP, counting the nonpoor as having zero shortfall, expressed as a percentage of the poverty line.
The latest-value map covers 171 economies with observations spanning 1992–2025. The synchronized reference comparison uses the 37 economies observed in 2023, the largest same-year group in this file. Keeping latest-value coverage separate from same-year comparison is the central safeguard for reading the data correctly.
Frequently Asked Questions
What does a poverty gap of 20% mean?
It means the average shortfall from the $8.30 poverty line across the whole population, counting nonpoor people as having zero shortfall, equals 20% of the line.
How is the poverty gap different from the poverty headcount?
The headcount measures how many people are below the line, while the poverty gap also reflects how far below the line incomes or consumption fall.
Does 2021 PPP mean all observations are from 2021?
No. It is the purchasing-power benchmark for the poverty line; household-survey observation years vary across economies.
Related Articles
Green Map creates custom-edited map images using open geographic data sources such as geoBoundaries, Natural Earth, OpenStreetMap, and government open data. These maps are edited visual materials, not raw data files, and are provided for education, documents, presentations, and graphic reference.