U.S. Energy Information Administration data for 2024 show 6.05185 million MMBtu of distillate fuel oil energy allocated to useful thermal output across the 50 states and the District of Columbia. The measure is consumption-uto-btu. It represents fuel energy consumed to produce useful thermal output in combined heat and power systems, not the amount of useful heat delivered itself. Useful thermal output is thermal energy made available for industrial or commercial processes, heating, cooling, or delivery to other end users rather than electricity generation.
The state distribution is extremely concentrated. Maryland reports 1.78865 million MMBtu, or 29.56% of the 51-jurisdiction sum. Virginia is second at 1.62077 million MMBtu, or 26.78%. Together they account for 56.34%. The median is only 0.00849 million MMBtu, while the mean is 0.11866. That large gap shows that a few jurisdictions dominate the reported distillate-fuel heat input.
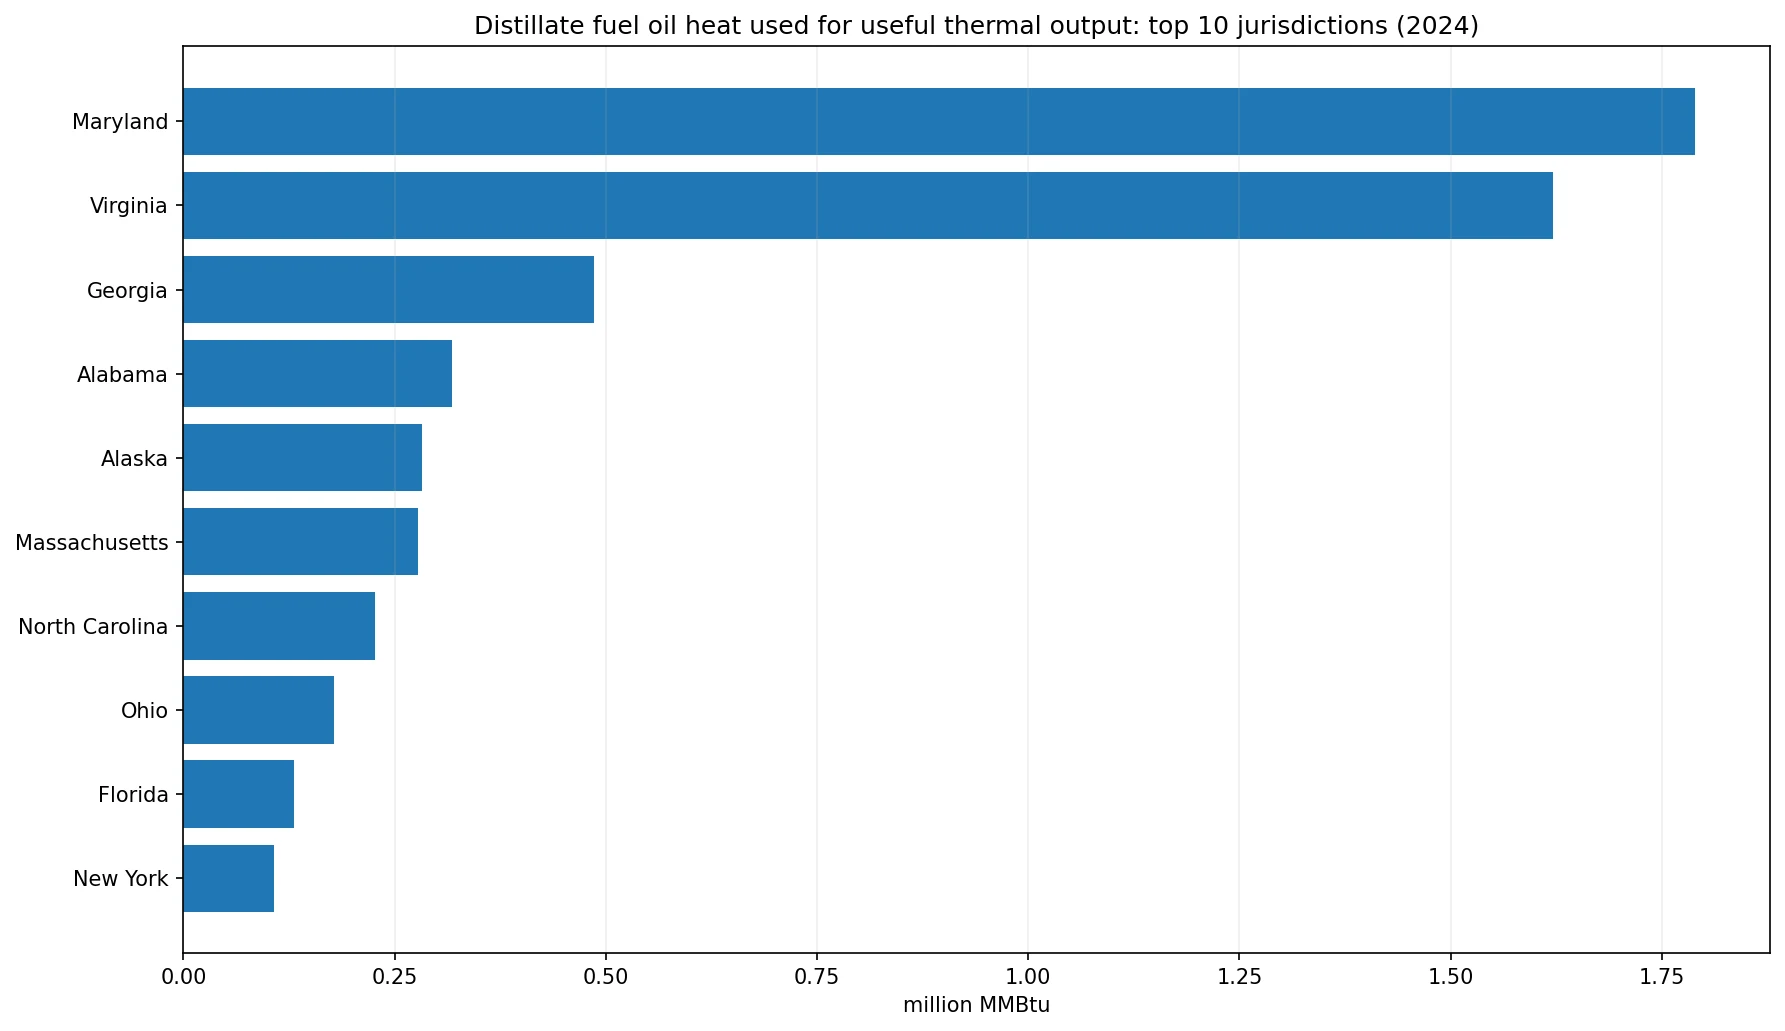
Table of Contents
Useful thermal output is not simply waste heat
EIA defines useful thermal output as thermal energy from a combined heat and power system that is made available for a non-electric use. Examples include industrial processes, commercial processes, space heating, cooling, and heat delivered to other end users. The concept is narrower than all heat produced at a power plant because the thermal energy must be usable outside electricity generation.
The current series measures the fuel input allocated to that useful thermal function. A value of 1 million MMBtu does not mean exactly 1 million MMBtu of useful heat was delivered. CHP systems split fuel input between electricity and thermal output, and conversion losses remain. Actual useful thermal output is a separate measure.
All Sectors is the aggregate sector setting inside EIA’s operational electricity data
The series uses sectorid 99, labelled All Sectors in the EIA electric-power-operational-data route. That label should not be expanded to mean every form of energy consumption in the entire U.S. economy. It is the aggregate sector setting within this electricity operational dataset, which covers the generating and CHP activities represented by the route.
This distinction explains why a similar 2024 distillate-fuel article can have different values when it uses the Electric Power sector, a commercial or industrial slice, a generation field, or a physical-unit field. For this comparison, the identity is fixed at distillate fuel oil, All Sectors, consumption-uto-btu and million MMBtu.
Maryland and Virginia together account for 56.34%
Maryland leads with 1.78865 million MMBtu and Virginia follows with 1.62077. Their combined 3.40942 million MMBtu represents 56.34% of the sum across all 51 jurisdictions. More than half of the observed distillate-fuel energy allocated to useful thermal output is therefore concentrated in only two places.
The series alone does not establish why those two jurisdictions are so prominent. CHP capacity, industrial and commercial heat demand, operating hours, fuel choices and the availability of other fuels can all matter. The direct evidence is narrower: their reported 2024 distillate-fuel heat input for useful thermal output is much larger than in most other jurisdictions.
The top ten account for 89.50% of the total
Georgia ranks third at 0.48617 million MMBtu, followed by Alabama at 0.31781, Alaska at 0.28188, Massachusetts at 0.27788, North Carolina at 0.22673, Ohio at 0.17872, Florida at 0.13098 and New York at 0.10689. The gap after the top two is already very large, so the upper tail is not a smooth progression.
The top five jurisdictions account for 74.28% of the total and the top ten for 89.50%. The remaining 41 jurisdictions collectively contribute only about 10.5%. That pattern is consistent with a fuel used intensively in a relatively small number of CHP thermal applications rather than evenly across the country.
| Jurisdiction | Year | million MMBtu | Share of 51-jurisdiction sum |
|---|---|---|---|
| Maryland | 2024 | 1.78865 | 29.56% |
| Virginia | 2024 | 1.62077 | 26.78% |
| Georgia | 2024 | 0.48617 | 8.03% |
| Alabama | 2024 | 0.31781 | 5.25% |
| Alaska | 2024 | 0.28188 | 4.66% |
| Massachusetts | 2024 | 0.27788 | 4.59% |
| North Carolina | 2024 | 0.22673 | 3.75% |
| Ohio | 2024 | 0.17872 | 2.95% |
| Florida | 2024 | 0.13098 | 2.16% |
| New York | 2024 | 0.10689 | 1.77% |
The median is only 0.00849 million MMBtu
The median among the 51 jurisdictions is 0.00849 million MMBtu. The first quartile is 0.00008 and the third quartile 0.08374. 29 jurisdictions are below 0.01 million MMBtu, while only 11 are at or above 0.1 million MMBtu. Most of the distribution is therefore clustered near very small values compared with Maryland and Virginia.
The mean of 0.11866 million MMBtu is mathematically correct but does not describe a typical jurisdiction well. A few large observations pull it upward. The median and quartiles are more informative for the middle of the distribution, while cumulative shares are better for showing concentration.
Nine official zeros are not missing data
There are 9 reported values of exactly 0.00000 million MMBtu in 2024: Idaho, Kansas, Nebraska, Nevada, New Mexico, Rhode Island, Utah, West Virginia and Wyoming. These are source-reported zeros and should remain distinct from missing observations. Assigning zero to a jurisdiction with no data would create a false statement about fuel use.
Several other values are positive but extremely small. Vermont is at 0.00003, Oregon and Colorado at 0.00005, the District of Columbia at 0.00007 and Oklahoma at 0.00009 million MMBtu. A tiny or zero DFO value does not mean there is no CHP activity or useful thermal output in that jurisdiction; other fuels may supply the thermal function.
| Jurisdiction | Year | million MMBtu | Share of 51-jurisdiction sum |
|---|---|---|---|
| Idaho | 2024 | 0.00000 | 0.00% |
| Kansas | 2024 | 0.00000 | 0.00% |
| Nebraska | 2024 | 0.00000 | 0.00% |
| New Mexico | 2024 | 0.00000 | 0.00% |
| Nevada | 2024 | 0.00000 | 0.00% |
| Rhode Island | 2024 | 0.00000 | 0.00% |
| Utah | 2024 | 0.00000 | 0.00% |
| West Virginia | 2024 | 0.00000 | 0.00% |
| Wyoming | 2024 | 0.00000 | 0.00% |
| Vermont | 2024 | 0.00003 | 0.00% |
This series does not measure distillate fuel oil’s share of useful-heat fuel
The values are absolute heat input from one fuel. They do not show what percentage of all fuel used for useful thermal output is distillate fuel oil in each jurisdiction. Maryland can have the largest DFO heat input without necessarily having the largest DFO share of its total CHP thermal fuel mix.
A dependence or fuel-mix calculation would need all-fuel consumption-uto-btu for the same jurisdiction and sector scope as the denominator. Without that denominator, the appropriate conclusion is about absolute DFO heat input, not how dependent a CHP system is on distillate fuel oil.
Fuel for electricity generation and fuel for useful heat follow different paths
EIA separates fuel allocated to electricity generation from fuel allocated to useful thermal output. The consumption-for-eg-btu field describes fuel energy used on the electricity side, while consumption-uto-btu describes the useful-thermal side. CHP plants produce both products, so the split matters for understanding energy flows.
A state that ranks high for distillate fuel used in electricity generation does not have to rank high in this useful-thermal series. The difference is not a contradiction. It reflects a different output purpose and can also reflect the mix of CHP and non-CHP facilities.
Physical barrels and Btu heat content are not interchangeable
A separate EIA series can express distillate fuel oil consumption in physical units such as thousand barrels. This series uses million MMBtu. Barrels measure volume; MMBtu measure energy. Heat content per barrel can vary, so state rankings and shares do not have to match exactly across the two units.
The Btu measure is useful when comparing fuel energy input, but it still does not reveal efficiency by itself. Efficiency requires an output measure—useful thermal output or electricity generation—relative to the fuel energy consumed. A high MMBtu value can reflect scale rather than high or low conversion efficiency.
The strongest 2024 pattern is concentration
Maryland contributes 29.6% of the 51-jurisdiction sum and Virginia 26.8%. Together they account for 56.3%, and the top ten reach 89.5%. At the same time, the median is just 0.00849 million MMBtu. The contrast between the upper tail and the typical jurisdiction is the most important feature of the distribution.
Four distinctions keep the measure clear: the fuel is distillate fuel oil; the unit is million MMBtu; the fuel is allocated to useful thermal output rather than electricity generation; and All Sectors is the aggregate sector facet within EIA’s electric-power operational dataset, not all energy use in the U.S. economy.
Source and interpretation limits
The source is the U.S. Energy Information Administration Electricity API v2, electric-power-operational-data, with annual 2024 observations. The slice uses fueltypeid DFO, sectorid 99 (All Sectors), the consumption-uto-btu field and million MMBtu units. It contains the 50 states and the District of Columbia, with reported zeros retained as zeros rather than treated as missing.
A useful next step would compare the same jurisdictions with all-fuel useful-thermal consumption, physical DFO consumption and actual useful thermal output. Those measures would separate fuel volume, fuel energy input, fuel mix and thermal output and help explain why Maryland and Virginia dominate this particular DFO heat-input series.
Frequently Asked Questions
What is fuel consumption for useful thermal output?
It is fuel energy allocated to producing useful heat from a CHP system for industrial or commercial processes, heating, cooling, or delivery to other users.
Is this the amount of useful thermal output actually delivered?
No. consumption-uto-btu measures fuel energy input allocated to useful thermal output; actual useful thermal output is a separate measure.
Do zero values mean the data are missing?
No. The zeros in this 2024 series are reported observations and must remain separate from missing data.
Related Articles
Green Map creates custom-edited map images using open geographic data sources such as geoBoundaries, Natural Earth, OpenStreetMap, and government open data. These maps are edited visual materials, not raw data files, and are provided for education, documents, presentations, and graphic reference.