World Bank indicator DT.DOD.DSTC.ZS measures short-term debt as a percentage of total external debt. Short-term debt includes debt with an original maturity of one year or less plus interest in arrears on long-term debt. Total external debt covers debt owed to nonresidents and includes public, publicly guaranteed and private nonguaranteed long-term debt, use of IMF credit and short-term debt. The indicator therefore describes maturity structure rather than the absolute size of external debt.
The latest-value data contain 121 economies, of which 118 have a 2024 observation. One value is from 2023 and two are from 2022. To keep the comparison synchronized, the main analysis uses the 118 economies observed in 2024. Their median short-term-debt share is 9.38% and the simple mean is 11.95%. The distribution ranges from official zeros to values above 50%, showing large differences in the maturity composition of external debt.
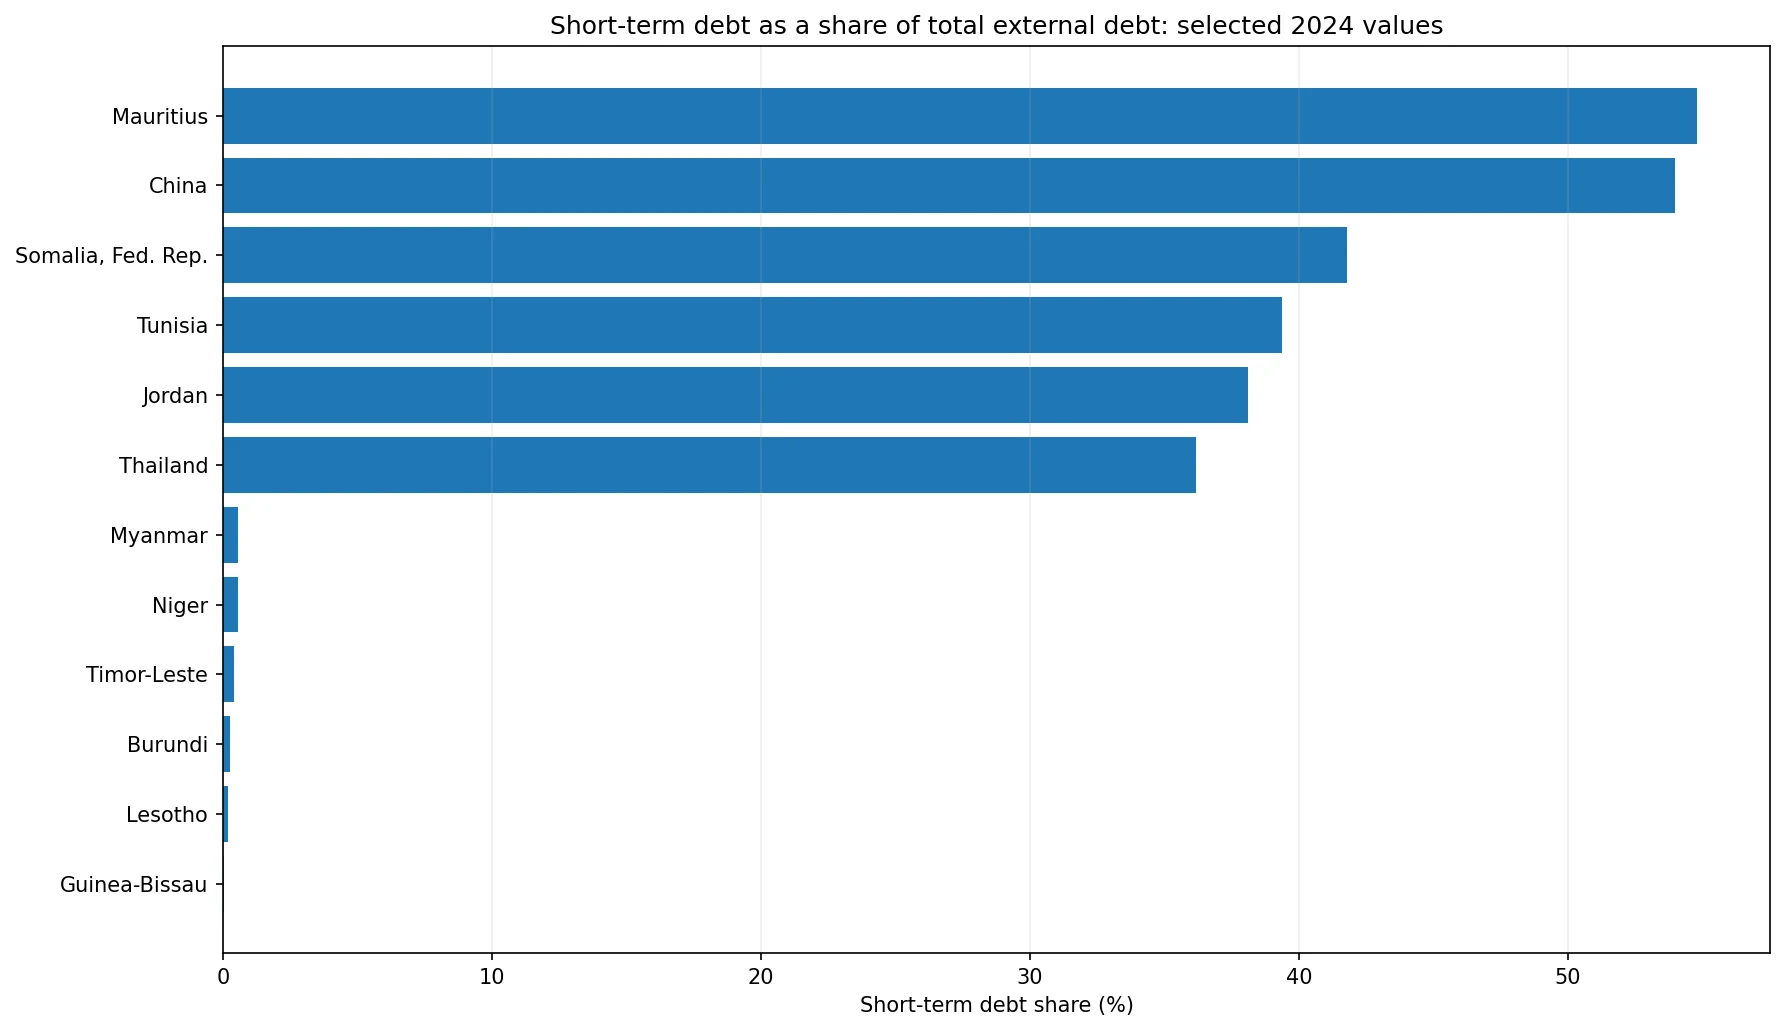
Table of Contents
A high percentage means a larger short-maturity share of external debt
A value of 30% means roughly three tenths of total external debt is classified as short-term under the indicator definition. It does not mean external debt equals 30% of GDP and it does not describe a 30% increase in debt. The denominator is total external debt, so the measure is a composition ratio at a point in time.
This distinction matters because two economies can have the same 30% share but very different amounts of external debt in dollars. The ratio is useful for examining maturity structure and potential refinancing needs, but it cannot replace level measures. Absolute debt, national income, exports and foreign-exchange liquidity all affect the practical importance of a given percentage.
The 2024 median is 9.38%
The median across 118 economies is 9.38%, while the mean is 11.95%. The middle half of observations lies between 2.87% and 17.13%. The mean is higher than the median because several economies have values in the 30% to 50% range, creating an extended upper tail.
26 of the 118 economies have a share of at least 20%, and 16 are at or above 25%. At the lower end, 41 are below 5% and 18 are below 1%. The same-year comparison therefore contains both economies with very little short-term debt relative to total external debt and economies where short maturities represent a substantial fraction.
Mauritius and China are above 50%
Mauritius records the highest 2024 share at 54.78%, followed closely by China at 53.97%. Somalia is at 41.79%, Tunisia 39.37%, Jordan 38.11% and Thailand 36.17%. These values show that short-term obligations account for a comparatively large portion of total external debt in those reported observations.
A high ratio should not automatically be converted into a ranking of debt risk. An economy with large foreign-exchange reserves, strong export receipts or stable access to refinancing may be able to manage a high short-term share differently from an economy with limited liquidity. The indicator signals a maturity structure that deserves additional context; it does not independently measure solvency or crisis probability.
| Economy | Year | Short-term debt share |
|---|---|---|
| Mauritius | 2024 | 54.78% |
| China | 2024 | 53.97% |
| Somalia, Fed. Rep. | 2024 | 41.79% |
| Tunisia | 2024 | 39.37% |
| Jordan | 2024 | 38.11% |
| Thailand | 2024 | 36.17% |
| Kosovo | 2024 | 35.58% |
| Turkiye | 2024 | 34.59% |
Five economies report an official 0%
There are 5 official zero observations in the 2024 data: Burkina Faso, Bhutan, Comoros, Liberia and Tonga. These are reported values, not missing observations that were replaced with zero. That distinction is essential because assigning zero to an economy with no observation would falsely imply that it has no short-term debt share.
Several nonzero values are also extremely small. Guinea-Bissau reports 0.06%, Lesotho 0.18%, Burundi 0.26%, Timor-Leste 0.43%, Niger 0.56% and Myanmar 0.57%. These figures mean short-term debt represents a very small portion of reported total external debt. They do not imply that total external debt itself is small.
| Economy | Year | Short-term debt share |
|---|---|---|
| Burkina Faso | 2024 | 0.00% |
| Bhutan | 2024 | 0.00% |
| Comoros | 2024 | 0.00% |
| Liberia | 2024 | 0.00% |
| Tonga | 2024 | 0.00% |
| Guinea-Bissau | 2024 | 0.06% |
| Lesotho | 2024 | 0.18% |
| Burundi | 2024 | 0.26% |
| Timor-Leste | 2024 | 0.43% |
| Niger | 2024 | 0.56% |
A low share does not necessarily mean a low external-debt burden
An economy can have a short-term share below 1% while still carrying a large stock of total external debt. If most obligations have long maturities, the composition ratio will be low even when the dollar amount is substantial. Conversely, an economy with a 40% short-term share could have a relatively small external-debt stock.
Long-term debt can also generate large interest and principal payments. Maturity composition is only one dimension of external vulnerability. A fuller assessment needs debt-service schedules, total external debt, exports, foreign-exchange reserves, fiscal conditions and private-sector foreign-currency exposure.
Short-term debt relative to reserves answers a different question
Another common indicator compares short-term external debt with total reserves. That ratio is closer to a liquidity-buffer question: how large are near-term external obligations relative to official foreign-exchange assets? The current indicator instead asks what portion of total external debt has a short maturity. Because the denominators differ, the two ratios can move in very different ways.
An economy can have a high short-term share and still have a low short-term-debt-to-reserves ratio if reserves are very large. The reverse is also possible: a modest short-term share can look burdensome relative to reserves if the reserve buffer is small. Reading both measures together separates maturity composition from official liquidity capacity.
Short-term debt relative to exports is different again
Indicators that compare short-term debt with exports of goods and services plus primary income relate debt to a flow of foreign-currency earnings. DT.DOD.DSTC.ZS does not use exports or income in the denominator. A country can therefore look very different on the two measures even though the numerator concerns short-term external debt in both cases.
This is why the denominator should always appear in the title and table labels. ‘Short-term external debt’ alone is not enough to identify what a percentage means. Total debt, reserves and exports each answer a separate question about maturity structure, liquidity or foreign-currency earning capacity.
The 2024 distribution has a long upper tail
The gap between the median of 9.38% and the mean of 11.95% reflects the influence of high observations. The first quartile is 2.87% and the third quartile 17.13%, so half of the economies sit within a relatively compact band while Mauritius and China exceed 50%.
Broad ranges are more informative than fine ranking differences in the middle of the distribution. Grouping economies into under 5%, 5–20% and 20% or more often communicates maturity structure more clearly than assigning importance to small decimal differences between neighboring ranks.
Only three of the 121 latest observations are not from 2024
The latest-value coverage is unusually synchronized. Suriname is the only 2023 observation at 5.08%, while Bulgaria is a 2022 observation at 21.16% and the Russian Federation is a 2022 observation at 17.43%. A latest-value map can include them if the observation year is displayed alongside the percentage.
| Reference year | Economies | How it is used here |
|---|---|---|
| 2024 | 118 | Main same-year comparison |
| 2023 | 1 | Latest-value supplement |
| 2022 | 2 | Latest-value supplement |
The main 2024 comparison excludes those three observations simply to keep the time basis identical. External-debt maturity structures can change with financing conditions, market access and debt management, so even a small year difference is worth making visible when a synchronized comparison is available.
Useful companion indicators for high short-term shares
A high short-term-debt share becomes more informative when paired with the absolute stock of short-term debt and foreign-exchange reserves. Exports and primary income can indicate the scale of foreign-currency earnings, while debt-service measures show actual payment obligations. Total external debt relative to GNI or GDP adds a broader size perspective.
Sector information can add another layer. Short-term borrowing by banks and firms may reflect trade finance or financial intermediation, while public-sector external debt can have a different maturity and risk profile. The aggregate ratio does not identify the debtor sector, so sectoral data are needed before attributing a high share to a particular source of vulnerability.
The clearest finding from the 2024 comparison
The median short-term share is 9.38% across 118 economies, but the range is wide. Mauritius and China exceed 50%, while five economies report 0% and 18 are below 1%. The evidence shows substantial variation in how external debt is split between short and longer maturities.
Three interpretation rules keep the comparison precise. The denominator is total external debt. A high share is not a ranking of absolute debt burden or national risk. And official zeros must remain separate from missing observations. With those distinctions, the indicator provides a clear view of debt maturity structure without overstating what it can prove.
Source and interpretation limits
The source is World Bank indicator DT.DOD.DSTC.ZS, reported in percent. The main comparison uses the 118 economies with 2024 observations from a 121-economy latest-value set. Short-term debt includes original maturity of one year or less plus interest in arrears on long-term debt, while total external debt covers a broad range of public and private obligations to nonresidents.
A stronger follow-up analysis would combine the ratio with short-term debt in levels, reserves, exports, debt service and total external debt relative to national income. That would separate the maturity composition shown here from the actual size of near-term obligations and the resources available to meet them.
Frequently Asked Questions
What does a 30% short-term debt share mean?
It means about 30% of total external debt is classified as short-term. It is not external debt as a share of GDP or a debt growth rate.
Does a higher share always mean greater external-debt risk?
No. Reserves, exports, absolute debt levels, refinancing conditions and creditor composition also matter.
Does 0% mean the data are missing?
No. The zeros in this series are reported observations and must remain separate from missing data.
Related Articles
Green Map creates custom-edited map images using open geographic data sources such as geoBoundaries, Natural Earth, OpenStreetMap, and government open data. These maps are edited visual materials, not raw data files, and are provided for education, documents, presentations, and graphic reference.