UNESCO Institute for Statistics indicator ETOIP.0.PU.GPIA compares the percentage of early childhood education enrolment in public institutions for females and males through the adjusted gender parity index, or GPIA. The 2024 figures cover 81 countries and territories, all in the same reference year. The values are index numbers centred on 1, not percentages. A value of 1 indicates equal public-institution shares for females and males; values below or above 1 show the direction and size of the difference.
The median across the 81 reported observations is 0.951, while the simple mean is 0.948. Using the UNESCO UIS convention that 0.97 to 1.03 represents parity, 18 observations fall inside the parity band. 35 fall within the somewhat wider 0.95 to 1.05 range. There are 67 values below 1 and 14 above 1. That imbalance in direction is descriptive, but it should not be interpreted as a direct measure of unequal access to early childhood education.
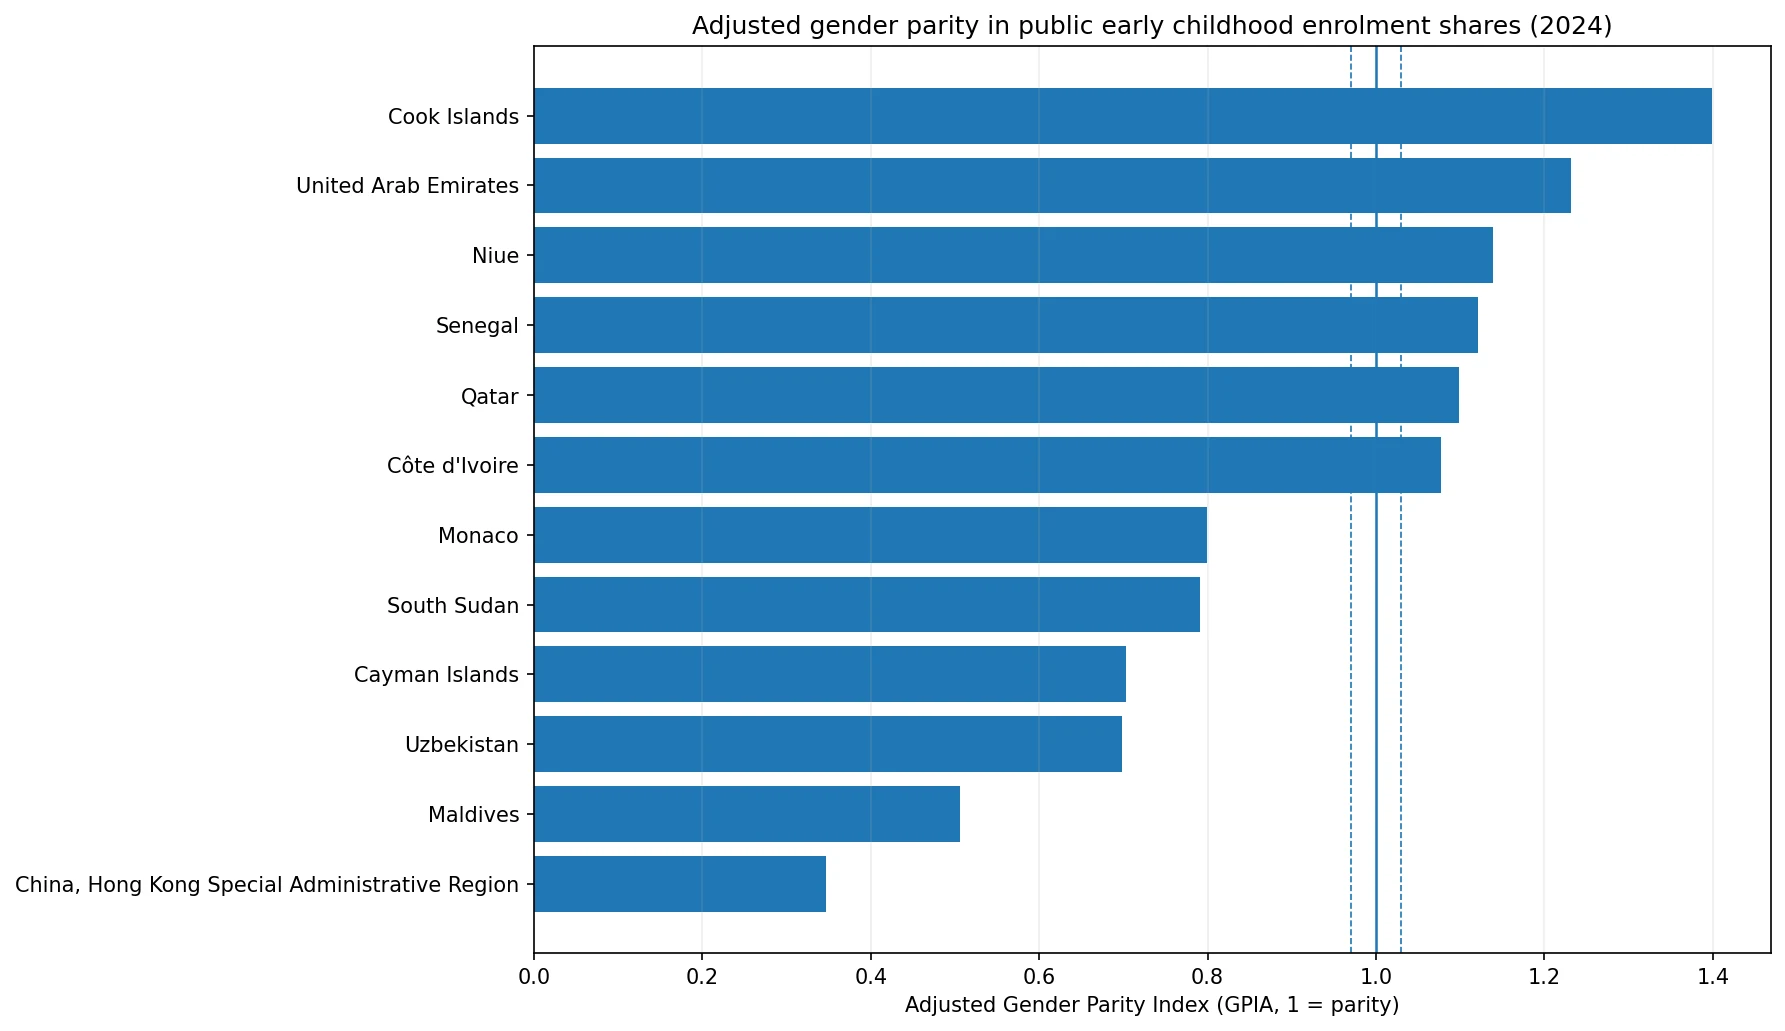
Table of Contents
GPIA is an index centred on 1, not a percentage
The first step in reading this series is to keep its scale intact. Values such as 0.929 or 1.232 should not be rewritten as 92.9% or 123.2%. The adjusted gender parity index compares female and male values of an underlying indicator and transforms ratios above 1 so that the scale is symmetrical around parity. UNESCO UIS describes the adjusted index as bounded from 0 to 2, with 1 representing parity and greater distance from 1 indicating greater disparity between the two groups.
For a standard female-to-male parity ratio, values at or below 1 are retained as the ratio. When the female-to-male ratio exceeds 1, the adjusted formulation uses the inverse ratio to place the result symmetrically above 1. The benefit is that 0.8 and 1.2 are equally distant from parity. This makes the size of a female-higher difference comparable with a male-higher difference on the opposite side of 1.
What is actually being compared
The underlying indicator is the percentage of enrolment in early childhood education programmes that is in public institutions. GPIA compares that public-institution share for females with the corresponding share for males. A value below 1 means the female public-institution share is lower than the male share; a value above 1 means it is higher. A value close to 1 means the public-private composition of enrolment is similar for the two sexes.
This point prevents an important interpretive mistake. A lower female public share does not necessarily mean girls have worse access to early childhood education. Females could have high overall participation while being more concentrated in private institutions. Likewise, a value near 1 does not prove equal access if overall enrolment rates differ. The index describes the distribution between public and other institutions within enrolment, not participation in early childhood education as a whole.
Only 18 of 81 observations fall within the 0.97–1.03 parity band
UNESCO UIS commonly treats values from 0.97 through 1.03 as gender parity for parity indices. In the 2024 observations, 18 of 81 fall in that interval. When the window is widened to 0.95 through 1.05, 35 observations qualify. This shows that a substantial portion of the reported systems have some measurable difference between female and male public-institution shares, although many departures from 1 remain modest.
The middle half of the distribution runs from 0.931 to 0.983. The median of 0.951 is below 1, so the typical reported observation has a somewhat lower public-institution share for females than for males. That does not establish a global pattern for all countries, because the 81 systems are not a complete world set and each system receives equal weight regardless of enrolment size.
The most distant values occur on both sides of parity
Hong Kong records the lowest GPIA at 0.347, followed by Maldives at 0.506, Uzbekistan at 0.698, the Cayman Islands at 0.703, South Sudan at 0.791 and Monaco at 0.799. These values indicate a lower female public-institution share relative to the male share, with Hong Kong and Maldives standing much farther from 1 than most other observations.
At the other end, the Cook Islands record 1.399, the United Arab Emirates 1.232, Niue 1.139, Senegal 1.121, Qatar 1.098 and Côte d’Ivoire 1.077. In those systems the female public-institution share is higher than the male share. Because the adjusted index is symmetrical around 1, high-side and low-side departures can be compared by their distance from parity rather than treated as an ordinary ranking from worst to best.
| Country or territory | Year | GPIA |
|---|---|---|
| Cook Islands | 2024 | 1.399 |
| United Arab Emirates | 2024 | 1.232 |
| Niue | 2024 | 1.139 |
| Senegal | 2024 | 1.121 |
| Qatar | 2024 | 1.098 |
| Côte d’Ivoire | 2024 | 1.077 |
| China, Hong Kong Special Administrative Region | 2024 | 0.347 |
| Maldives | 2024 | 0.506 |
| Uzbekistan | 2024 | 0.698 |
| Cayman Islands | 2024 | 0.703 |
| South Sudan | 2024 | 0.791 |
| Monaco | 2024 | 0.799 |
A value below 1 is not automatically a disadvantage in education access
67 of the 81 observations are below 1, while 14 are above it. It is tempting to describe the larger below-1 group as evidence that girls are disadvantaged. That wording is not appropriate for this underlying indicator. The measure concerns the share of enrolment located in public institutions, and a higher public share is not inherently a better outcome. Public and private provision can play very different roles across education systems.
To assess access, the analysis would need additional measures such as gross or net participation rates, enrolment counts by sex, the size of public and private provision, household costs and geographic availability. GPIA can reveal a gender difference in institutional composition, but it cannot tell whether one sex has more or less opportunity to participate in early childhood education overall.
Why 0.97–1.03 should be used as a band rather than a hard verdict
The parity interval is useful because very small differences should not be given excessive importance. A country at 0.969 and another at 0.971 sit on different sides of the conventional boundary, but their substantive difference is tiny. The band is therefore best understood as an interpretation aid, not a sharp dividing line between equality and inequality.
Large distances from 1 are more informative than marginal crossings of the threshold. A value around 0.50 or 1.23 reflects a much larger difference in the public-institution shares than a value of 0.96 or 1.04. For the same reason, ordering all 81 systems from highest to lowest can be misleading. The highest value is not inherently the ‘best’ because the desirable reference point for parity is 1, not the top of the scale.
Extreme observations need the underlying female and male shares
Hong Kong at 0.347 and the Cook Islands at 1.399 are clear outliers in opposite directions. Yet GPIA alone does not reveal the actual female and male percentages that produced those values. The same parity distance can occur at very different levels of public provision. A country in which almost all enrolment is public can produce a parity value similar to a system in which public institutions account for a much smaller share.
The next analytical step should therefore be to examine the underlying female and male public-enrolment percentages and, ideally, several years of observations. That would show whether a large gap is persistent or temporary and whether it reflects movement in the female share, the male share or both. Small-population systems can also experience larger year-to-year changes when enrolment counts are limited.
The mean of the 81 systems is not a global GPIA
The 2024 observations cover 81 countries and territories, not every education system. The simple mean of 0.948 is an average of country-level index values with equal weight. It is not a student-weighted global estimate, and it should not be presented as the adjusted parity index for the world as a whole.
Systems without a reported 2024 value should also remain missing rather than being assigned zero. In this index, a value near zero has a substantive meaning of a very large difference between the groups, whereas a missing observation simply means no value is available in the reported 2024 set. Replacing missing values with zero would materially distort maps, averages and the lower tail of the distribution.
What the 2024 distribution supports
The most defensible summary is that the distribution is centred somewhat below parity, with a median of 0.951, while only 18 of 81 observations lie within the conventional 0.97–1.03 parity band. There are also substantial outliers in both directions. Hong Kong and Maldives are far below 1, while the Cook Islands and United Arab Emirates stand out above 1.
Those findings describe the gender pattern in the public-institution share of early childhood enrolment. They do not establish a ranking of education quality, identify the cause of country differences or measure overall access for girls and boys. Keeping the scope narrow makes the comparison more useful because it distinguishes a change in institutional composition from a change in participation.
Source and interpretation limits
The figures come from UNESCO Institute for Statistics indicator ETOIP.0.PU.GPIA for 2024. The adjusted gender parity index is interpreted on a scale centred on 1 and bounded between 0 and 2. The commonly used parity range is 0.97 to 1.03. Reported observations are retained as published, and no value is assigned to countries and territories without a 2024 observation.
A stronger follow-up analysis would pair GPIA with the underlying female and male public-institution percentages, total early childhood enrolment and the public-private composition of provision. A time series would also show whether the distance from 1 is persistent. Those additions are necessary before moving from a descriptive parity comparison to an explanation of why the enrolment structure differs.
Common mistakes when reading this indicator
One mistake is converting the index to a percentage simply because the underlying measure is a percentage. Another is treating values above 1 as automatically good and values below 1 as automatically bad. A third is using the parity index as if it were an enrolment-rate measure. A fourth is assigning zero to countries without observations. Each error changes the question the indicator is designed to answer.
The safest reading keeps four elements together: the index value, its distance from 1, the direction of the difference and the institutional context. With those elements in place, the 2024 data can be used to identify systems where female and male public-enrolment shares are similar and systems where the composition differs enough to justify a closer look at the underlying figures.
Frequently Asked Questions
What does a GPIA value of 1 mean?
It means the female and male shares of early childhood enrolment in public institutions are equal. Greater distance from 1 indicates a larger difference.
Why is the 0.97–1.03 range used?
UNESCO UIS commonly uses this interval as a practical parity range for parity indices.
Does a GPIA below 1 mean girls have worse access to early childhood education?
No. This indicator compares the public-institution share of enrolment by sex; it does not measure overall access or participation.
Related Articles
Green Map creates custom-edited map images using open geographic data sources such as geoBoundaries, Natural Earth, OpenStreetMap, and government open data. These maps are edited visual materials, not raw data files, and are provided for education, documents, presentations, and graphic reference.