UNESCO Institute for Statistics data for 2024 show how much of male lower-secondary enrolment was recorded in public institutions across 84 reporting countries and territories. The observed values ranged from 43.71% to 59.42%. The unweighted mean was 50.99% and the median was 51.19%. Sixty-eight observations were above 50%, while 16 were below 50%.
Those counts do not mean that male students outnumbered female students in 68 reporting systems. The indicator has a different denominator: it asks what percentage of male lower-secondary enrolment is in public institutions. The distribution was also tightly concentrated around one-half. Twenty-seven observations were between 49% and 51%, 55 were between 48% and 52%, and 80 of 84 stayed inside 45% to 55%.
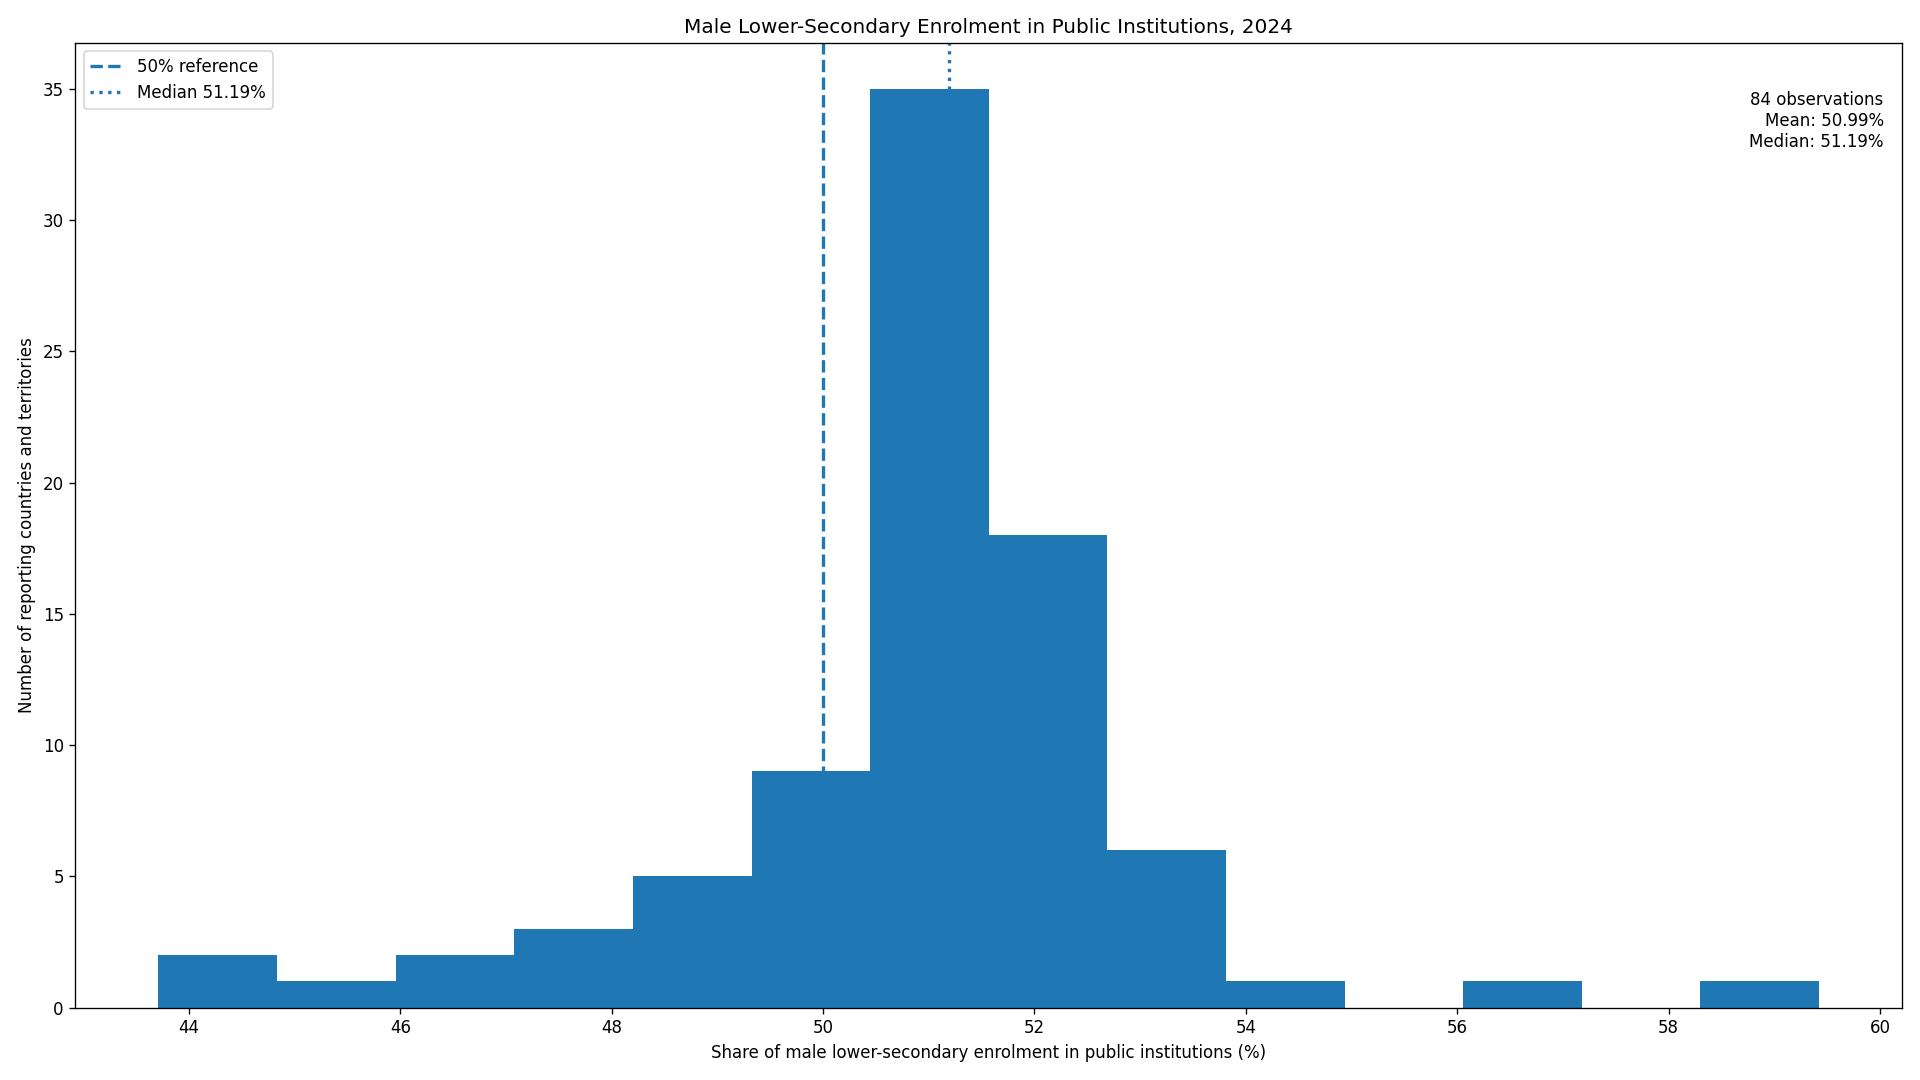
Table of Contents
The denominator is male lower-secondary enrolment
The series is titled “Percentage of enrolment in lower secondary education in public institutions, male (%)”. The safest reading is: among male students enrolled at the lower-secondary level, what percentage are enrolled in public institutions? If a country reports 52%, roughly 52% of its male lower-secondary enrolment falls in the public-institution category used by UIS.
That is not the same as saying that 52% of students in public lower-secondary schools are male. The latter would measure the gender composition of public-school enrolment. This series instead measures the institutional distribution of male enrolment. It also does not tell us the corresponding public-institution percentage for female students; that requires the female version of the indicator or a gender-parity comparison.
The 50% reference is therefore a public-versus-nonpublic halfway point for male enrolment, not a gender-parity line. Values above 50% indicate that more than half of reported male lower-secondary enrolment was in public institutions. Values below 50% indicate that the public share was less than half. There is no reason to treat 50% as a universal policy target, because the public-private structure of education differs across systems.
The 50.99% mean is not a global student-weighted share
The average of 50.99% is calculated by giving each of the 84 reporting units the same statistical weight. A very large national system counts once, just like a small territory. The number should therefore be interpreted as the average country-or-territory observation in this dataset, not as the percentage of all male lower-secondary students worldwide who attend public institutions.
A global student-weighted estimate would require the actual number of male lower-secondary students in each reporting system. The median of 51.19% avoids some of the scale problem because it identifies the middle observation rather than adding values together. The first quartile was 50.33% and the third quartile was 52.03%, placing the middle half of observations inside a narrow 1.71-point interval.
Most reporting units were close to a 50% public share
Fifty-five of the 84 observations, about 65.5%, were between 48% and 52%. This concentration matters more than the fact that 68 observations were technically above 50%. Bahrain at 50.09%, Gibraltar at 50.11%, Sweden at 50.13%, and Saudi Arabia at 50.65% all sit only slightly above the halfway reference.
The 49% to 51% band alone contains 27 observations, around 32.1% of the dataset. Monaco was closest to 50%, at 49.96%. The Dominican Republic was at 49.82%, Bahrain at 50.09%, Gibraltar at 50.11%, and Sweden at 50.13%. These are best understood as near-half public shares rather than as sharply different institutional structures.
A simple above-or-below classification loses the size of the difference. A value of 50.1% and one of 59.4% are both above 50%, but they describe very different distances from the reference. For this series, the percentage-point gap from 50% is therefore useful alongside the direction of the difference.
Where the public share of male enrolment was highest
The highest 2024 observation was Chad at 59.42%. Macao Special Administrative Region followed at 56.98%, then Luxembourg at 54.53%, Belize at 53.76%, Azerbaijan at 53.64%, Algeria at 53.61%, and Chile at 53.40%. Chad was 9.42 percentage points above the halfway reference, the largest upward deviation among the 84 observations.
These values describe the institutional location of male enrolment. Chad’s 59.42% does not mean that males represented 59.42% of all students in public lower-secondary education, and it does not reveal whether male students were more or less likely than female students to attend public institutions. Both of those questions need different denominators.
Where the public share was lowest
At the other end, Burkina Faso recorded 43.71%. Rwanda was at 44.60%, the United Arab Emirates at 45.72%, Lebanon at 46.38%, Mauritania at 47.06%, Mexico at 47.29%, and Mauritius at 47.38%. Burkina Faso was 6.29 percentage points below 50%, while Rwanda was 5.40 points below.
Only four observations were outside the broad 45% to 55% interval: Chad and Macao on the high side, and Burkina Faso and Rwanda on the low side. The tails are notable, but they are not representative of the bulk of the distribution, which is clustered much closer to one-half.
Selected 2024 observations
| Country or territory | Public share of male enrolment | Reading |
|---|---|---|
| Burkina Faso | 43.71% | Public share below half |
| Rwanda | 44.60% | Public share below half |
| United Arab Emirates | 45.72% | Public share below half |
| Dominican Republic | 49.82% | Very close to 50% |
| Monaco | 49.96% | Closest to 50% |
| Bahrain | 50.09% | Very close to 50% |
| Sweden | 50.13% | Very close to 50% |
| Luxembourg | 54.53% | Public share above half |
| Macao SAR | 56.98% | Public share above half |
| Chad | 59.42% | Highest observation |
Every percentage in the table uses male lower-secondary enrolment as the denominator. The difference between Luxembourg at 54.53% and Burkina Faso at 43.71% is therefore a difference in how male enrolment is distributed across institution types. It should not be converted into a claim about the number of boys versus girls, the male enrolment rate, or the overall public-school share for both sexes.
Why “male” does not make this a gender-composition indicator
The sex label identifies which student group is being measured. It does not by itself create a male-versus-female comparison. A high male value could coexist with an equally high, higher, or lower female value. To assess gender differences in the public-institution share, analysts need the corresponding female percentage or a parity index that explicitly compares the two.
This means the statement “68 observations were above 50%” should be read as “in 68 reporting units, a majority of male lower-secondary enrolment was in public institutions.” It should not be rewritten as “boys were the majority in public schools” or “boys were more likely than girls to be in public schools.” Those are different statistical questions.
What additional data are needed for interpretation
The public share is closely tied to the institutional design of an education system. Some countries rely heavily on public schools, while others have larger private or government-dependent private sectors. This single percentage does not tell us which institutional model is preferable, how schools are financed, or whether learning conditions differ between sectors.
The same percentage can also represent very different numbers of students. A 50% public share in a system with 100,000 male lower-secondary students corresponds to a very different enrolment volume from 50% in a system with one million. Counts are required for capacity, infrastructure, or resource analysis.
A one-year snapshot also cannot establish a trend. A 52% value in 2024 could represent a decline from a previously higher public share or an increase from a lower one. Trend analysis needs comparable observations across multiple years and attention to changes in definitions, reporting coverage, or institutional classification.
Coverage and missing observations
This comparison includes only the 84 countries and territories with a published 2024 national observation in the UIS extract supplied with the dataset. Missing catalogue units were not filled with zero. Several large systems, including the United States, Japan, and the United Kingdom, are absent from this 2024 observation set. Their absence means no corresponding value was present in this extract, not a zero public share.
As a result, statements such as 68 of 84 above 50% or 55 of 84 inside 48% to 52% apply only to the reporting set. They should not be generalized to every country. Coverage may also change by year, so any time-series comparison should check which reporting units are present before interpreting changes in the distribution.
Source and calculation notes
The source is the UNESCO Institute for Statistics official Data API indicator ETOIP.2.PU.M. The 84 national 2024 values were used as published, with no imputation and no zero-filling of missing units. The mean, median, quartiles, counts above and below 50%, counts within the 49–51% and 48–52% bands, and percentage-point distances from 50% were calculated directly from those observations.
The most useful summary is that the public-institution share of male lower-secondary enrolment was tightly centered around one-half in the available 2024 data. The mean was 50.99%, the median 51.19%, and 55 of 84 observations fell between 48% and 52%. Chad and Burkina Faso marked the two ends of the range, but the central concentration is the dominant feature of the dataset.
Frequently Asked Questions
What does 50% mean in this indicator?
It means half of male lower-secondary enrolment is in public institutions. It does not mean males and females make up equal shares of public-school enrolment.
What was the average in the 2024 observations?
The unweighted mean across 84 reporting units was 50.99%, and the median was 51.19%. This is not a student-weighted global share.
Does 55% mean 55% of public-school students are male?
No. It means 55% of male lower-secondary enrolment is in public institutions. The gender composition of public schools is a different measure.
Related Articles
Green Map creates custom-edited map images using open geographic data sources such as geoBoundaries, Natural Earth, OpenStreetMap, and government open data. These maps are edited visual materials, not raw data files, and are provided for education, documents, presentations, and graphic reference.