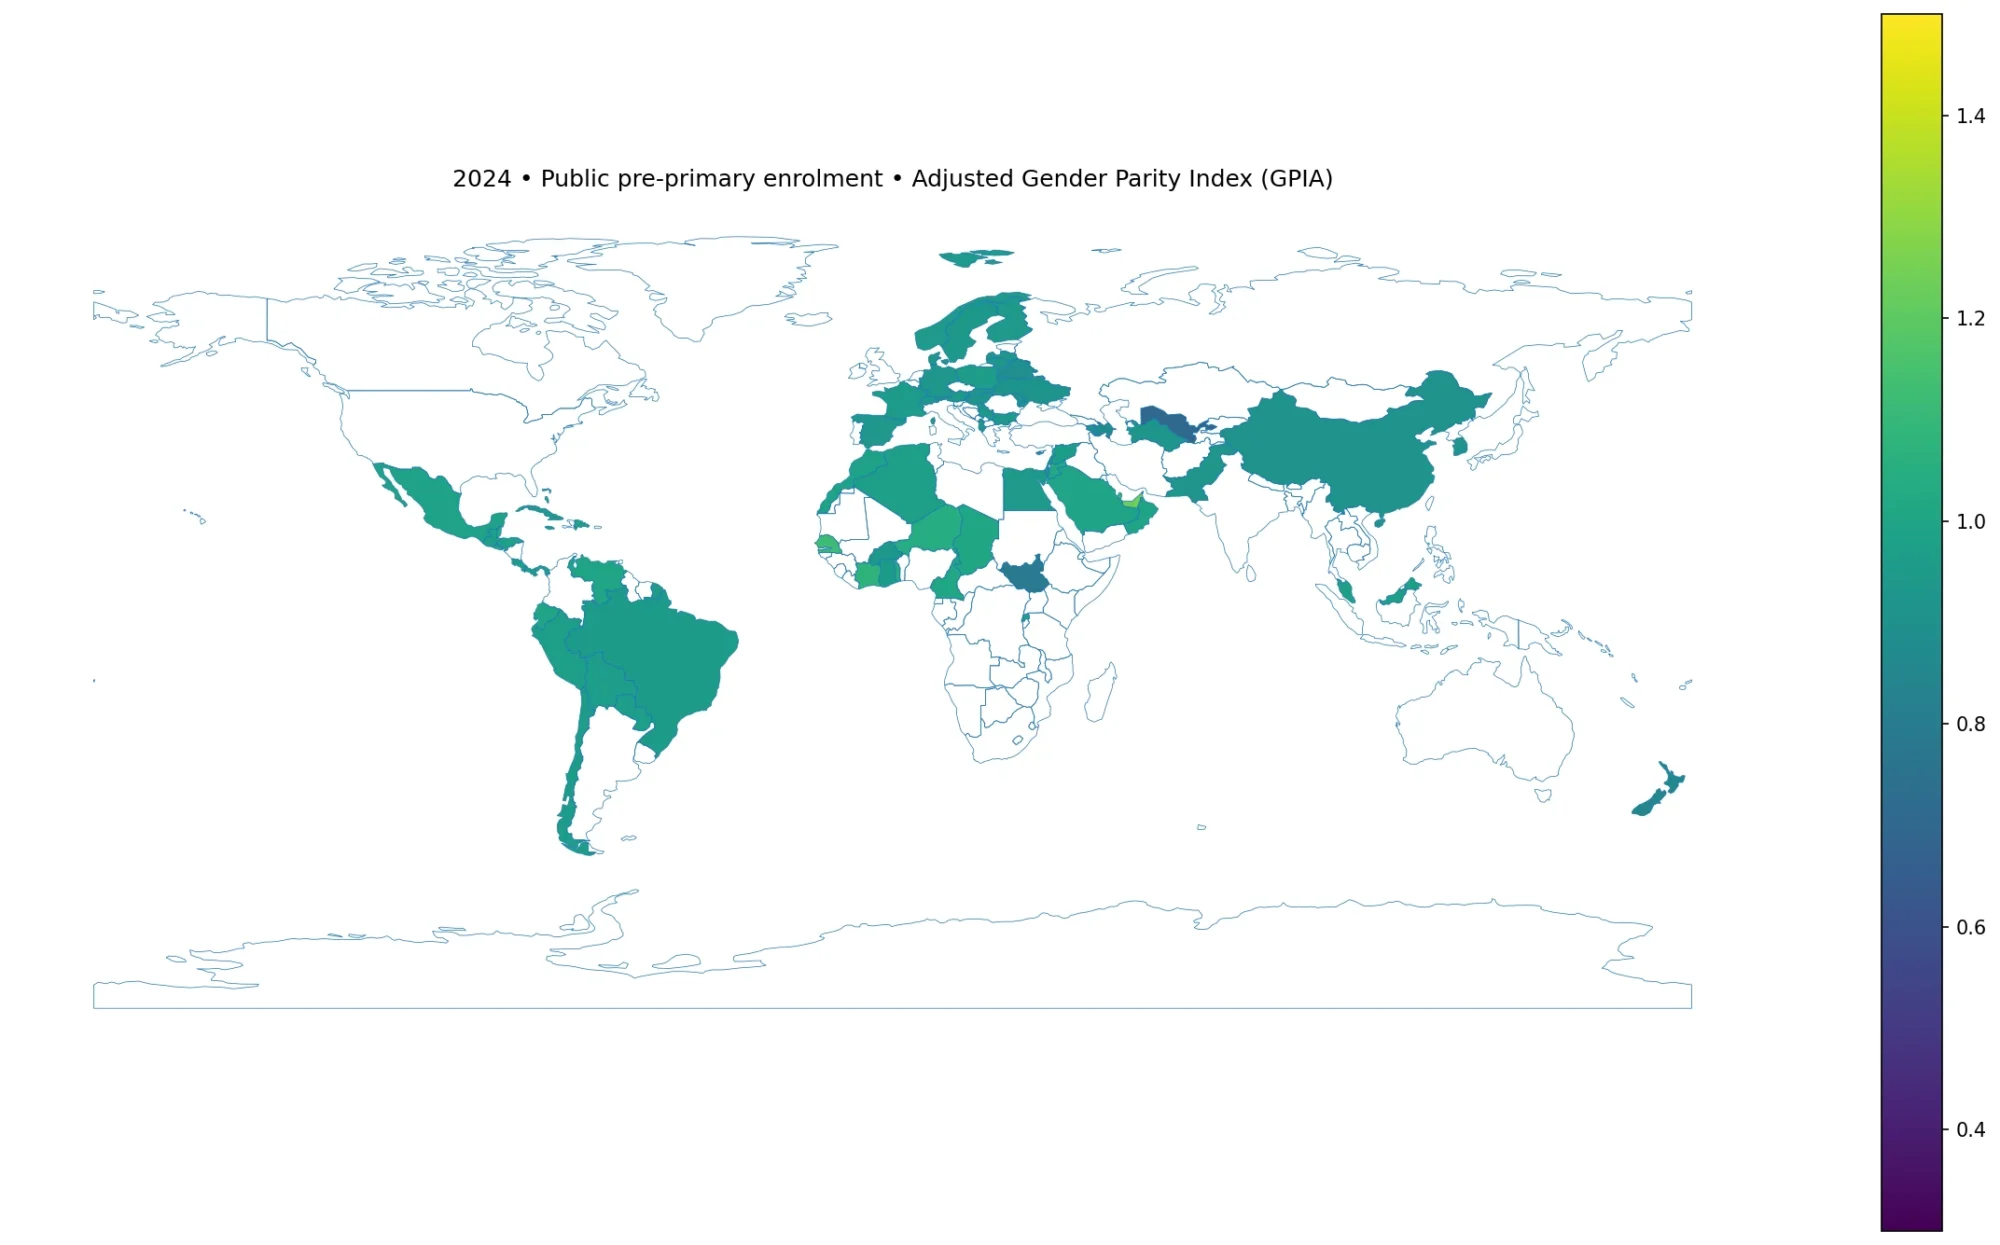
Gender balance in vocational participation within secondary education was far from even across the 85 countries and territories with a reported 2024 value in the UNESCO Institute for Statistics dataset. Of those observations, 71, or 83.5%, had an adjusted gender parity index (GPIA) below 0.97. Only 5 observations, or 5.9%, fell inside the commonly used parity band of 0.97 to 1.03, while 9, or 10.6%, were above 1.03.
The indicator does not measure the number of vocational students, nor does it show the overall share of secondary students in vocational programmes by itself. It compares that vocational-enrolment share between female and male students. A value close to 1 means the female and male indicator values are similar. A value farther from 1 signals a larger gender difference. Across the 85 reported observations, the median was 0.73449 and the mean was 0.72481.
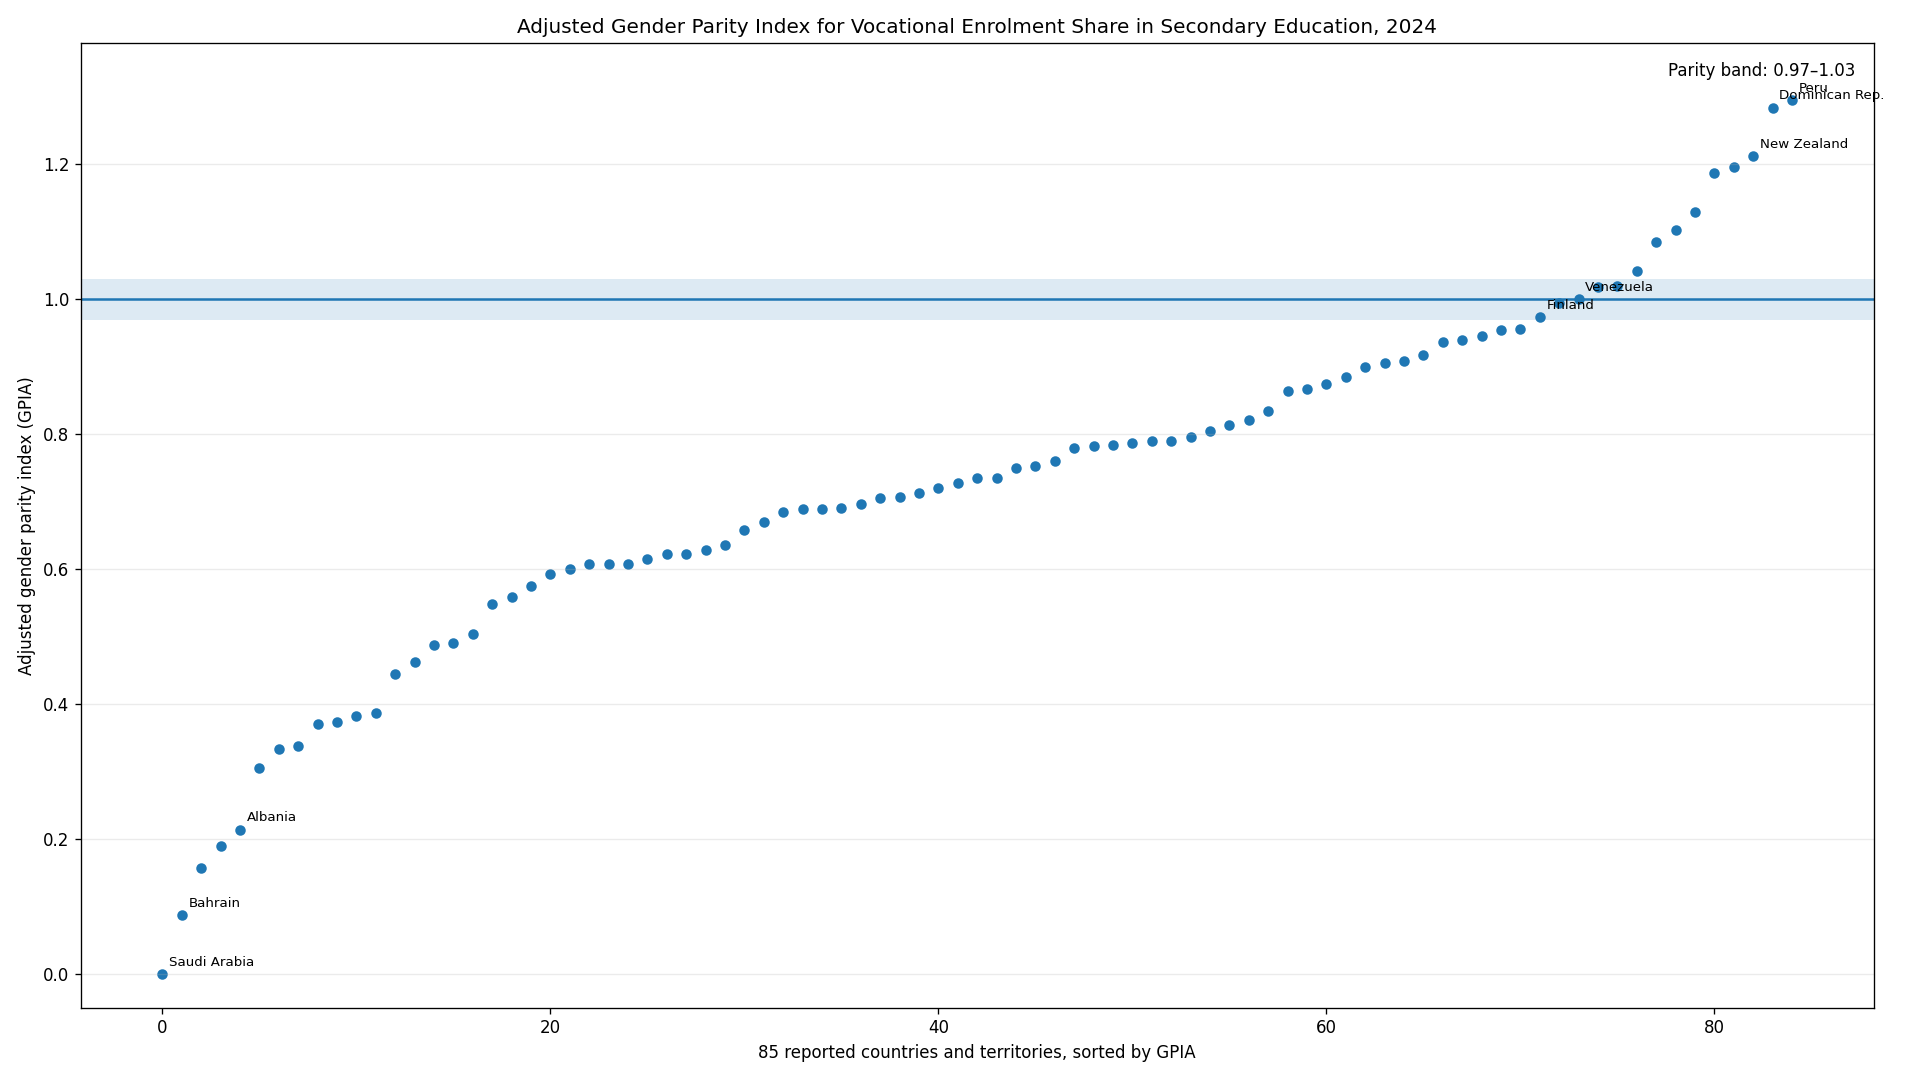
Table of Contents
What the adjusted gender parity index measures
The gender parity index compares female and male values of the same education indicator. In its basic form, the female value is divided by the male value. That simple ratio has an important weakness: ratios below 1 are bounded by zero, while ratios above 1 have no corresponding upper bound. UNESCO UIS therefore uses an adjusted form for parity indices. When the unadjusted ratio is above 1, the ratio is transformed so the resulting GPIA is symmetrical around 1 and lies between 0 and 2. This makes the distance from parity easier to compare on either side of 1.
For this specific series, the underlying measure is the share of all students in secondary education who are enrolled in vocational programmes. A GPIA below 1 means the vocational-programme share among female secondary students is lower than the corresponding share among male secondary students. A value above 1 means the female share is higher. The direction should not be treated as a verdict that one education system is better than another. A high or low vocational share can reflect the structure of general and vocational tracks, programme supply, student choices, admission practices, and many other institutional factors.
UIS commonly treats values from 0.97 to 1.03 as a practical parity band. The band recognizes that very small differences do not necessarily represent a meaningful gender gap. Values outside the band indicate a difference in direction and size, but GPIA alone cannot explain why that difference exists. A causal explanation requires the underlying female and male rates, information about the national education system, and ideally a time series rather than a single-year snapshot.
Most reported values were below the parity range
The strongest feature of the 2024 distribution is the concentration below 1. Seventy-one of the 85 observations were under 0.97, meaning that the female vocational-enrolment share was lower than the male share in the great majority of the reported national units. Nine observations were above 1.03, showing the opposite direction, and five were in the parity band. The result is not evidence that every country follows the same pattern; it describes only the countries and territories with a reported value in this 2024 extract.
The quartiles reinforce the same point. The 25th percentile was about 0.59975, the median was 0.73449, and the 75th percentile was about 0.90494. In other words, half of the reported values lay roughly between 0.60 and 0.90, entirely below the parity benchmark of 1. The mean of 0.72481 was close to the median, so the center of the distribution was not being pulled toward parity by a small number of unusually high observations.
Countries at the low and high ends of the index
Saudi Arabia had the lowest published value in the dataset at 0.00000. Bahrain followed at 0.08710, Hong Kong at 0.15689, Oman at 0.18933, and Albania at 0.21393. The zero for Saudi Arabia is an official reported value in this dataset, not a missing observation that was replaced with zero. Even so, an extreme single-year index should be interpreted with care and, where possible, checked against the underlying male and female indicator values.
At the other end, Peru had the highest value at 1.29488, followed by the Dominican Republic at 1.28408, New Zealand at 1.21246, the British Virgin Islands at 1.19667, and Brazil at 1.18731. These values indicate that the vocational-enrolment share among female secondary students was higher than the corresponding male share. Because the series uses the adjusted parity formula, a value such as 1.29 should not be read as “29% more female students.” It is an adjusted index based on the relationship between two shares, not a direct headcount ratio.
Only five observations were inside the parity band
Finland at 0.97370, Honduras at 0.99448, Venezuela at exactly 1.00000, Bolivia at 1.01857, and Costa Rica at 1.01985 were the five observations inside the 0.97–1.03 band. Venezuela sat exactly at the parity point. Honduras and Finland were slightly below 1, while Bolivia and Costa Rica were slightly above it. All five were much closer to parity than the large majority of the dataset.
Just outside the band were Paraguay at 1.04232, Guatemala at 0.95546, and Luxembourg at 0.95494. Their position illustrates why a simple “inside versus outside” classification should not replace the continuous index. A value near 0.95 is outside the standard band, but its distance from 1 is far smaller than the distance represented by values near 0.20. The most informative comparison is therefore both the direction and the absolute distance from 1.
Selected 2024 observations
| Country or territory | 2024 GPIA | Reading |
|---|---|---|
| Saudi Arabia | 0.00000 | Female vocational share lower than male share |
| Bahrain | 0.08710 | Female vocational share lower than male share |
| Hong Kong | 0.15689 | Female vocational share lower than male share |
| Albania | 0.21393 | Female vocational share lower than male share |
| South Korea | 0.74932 | Female vocational share lower than male share |
| Finland | 0.97370 | Within parity band |
| Honduras | 0.99448 | Within parity band |
| Venezuela | 1.00000 | Indicator values at parity |
| Bolivia | 1.01857 | Within parity band |
| Costa Rica | 1.01985 | Within parity band |
| New Zealand | 1.21246 | Female vocational share higher than male share |
| Dominican Republic | 1.28408 | Female vocational share higher than male share |
| Peru | 1.29488 | Female vocational share higher than male share |
The selected rows show the two tails of the distribution together with several observations near parity. They should not be treated as a league table of education quality. Vocational education occupies different positions within national secondary systems, and the balance between general and vocational tracks can vary considerably. Two countries with the same GPIA can therefore have very different overall levels of vocational participation.
What this index cannot tell us
First, GPIA does not reveal the size of the vocational sector. Two countries can both have a value of 1.0 even if one has a large vocational track and the other has very little vocational enrolment. Parity tells us that the female and male shares are similar; it does not tell us whether those shares are high or low. To answer that question, the underlying vocational-enrolment percentages are needed.
Second, a single 2024 value cannot show whether gender balance is improving or worsening. A country at 0.70 may have moved up from 0.50 over several years, or it may have fallen from 0.90. The same snapshot can therefore represent very different trajectories. Trend analysis requires comparable observations across multiple years and attention to any changes in programme classification, reporting coverage, or national education structures.
Third, the index does not identify causes. Labour-market demand, the mix of occupations taught in vocational programmes, social expectations, school availability, admissions, tuition arrangements, geography, and policy can all be relevant, but none of those variables is contained in this series. The observed gender gap should therefore be described as a statistical pattern rather than attributed to a specific policy or cultural factor without additional evidence.
Coverage matters when reading the global pattern
The dataset contains 85 reported national observations for 2024. Countries and territories absent from this extract were not assigned zero values. Their absence means that a 2024 observation was not present in the collected UIS result, not that no vocational students existed or that the indicator itself was zero. Several large education systems are absent from the 85-row slice, so percentages such as 83.5% refer specifically to these reported observations rather than to every country in the world.
The unit also deserves attention. GPIA is an index, not a percentage. A value of 0.75 should not be rewritten as 75%. It means the index is 0.25 below the parity point of 1. Likewise, a value of 1.20 is not “120% parity.” The adjusted formula was designed precisely so that differences on either side of 1 can be compared more symmetrically. Treating the index like an ordinary percentage would obscure that purpose.
Source and calculation notes
The values come from the UNESCO Institute for Statistics Data API series GTVP.2T3.V.GPIA, “Share of all students in secondary education enrolled in vocational programmes, adjusted gender parity index (GPIA).” The 2024 values were used as published, with no imputation for missing countries and no replacement of absent observations with zero. Summary statistics, quartiles, and counts inside or outside the parity band were calculated from the 85 available observations.
The clearest takeaway is therefore about distribution rather than rank. Among the 85 national units with a 2024 value, more than four in five were below 0.97, only five were inside the standard parity band, and nine were above 1.03. The dataset points to substantial gender differences in vocational participation shares across many reporting systems, while also showing a smaller group where female and male shares were close to balance or where the female share was higher. Understanding the reasons behind those patterns requires the underlying sex-specific rates and a longer time series.
Frequently Asked Questions
What does a GPIA of 1 mean?
It means the female and male values of the underlying education indicator are equal. UNESCO UIS commonly uses 0.97–1.03 as a practical parity band.
Does a GPIA of 0.75 mean 75% of vocational students are female?
No. GPIA is an adjusted index comparing female and male indicator values. It is not the female share of vocational students and should not be read as a percentage.
How many 2024 observations were within the parity band?
Five of the 85 reported national observations were between 0.97 and 1.03. Seventy-one were below 0.97 and nine were above 1.03.
Related Articles
Green Map creates custom-edited map images using open geographic data sources such as geoBoundaries, Natural Earth, OpenStreetMap, and government open data. These maps are edited visual materials, not raw data files, and are provided for education, documents, presentations, and graphic reference.