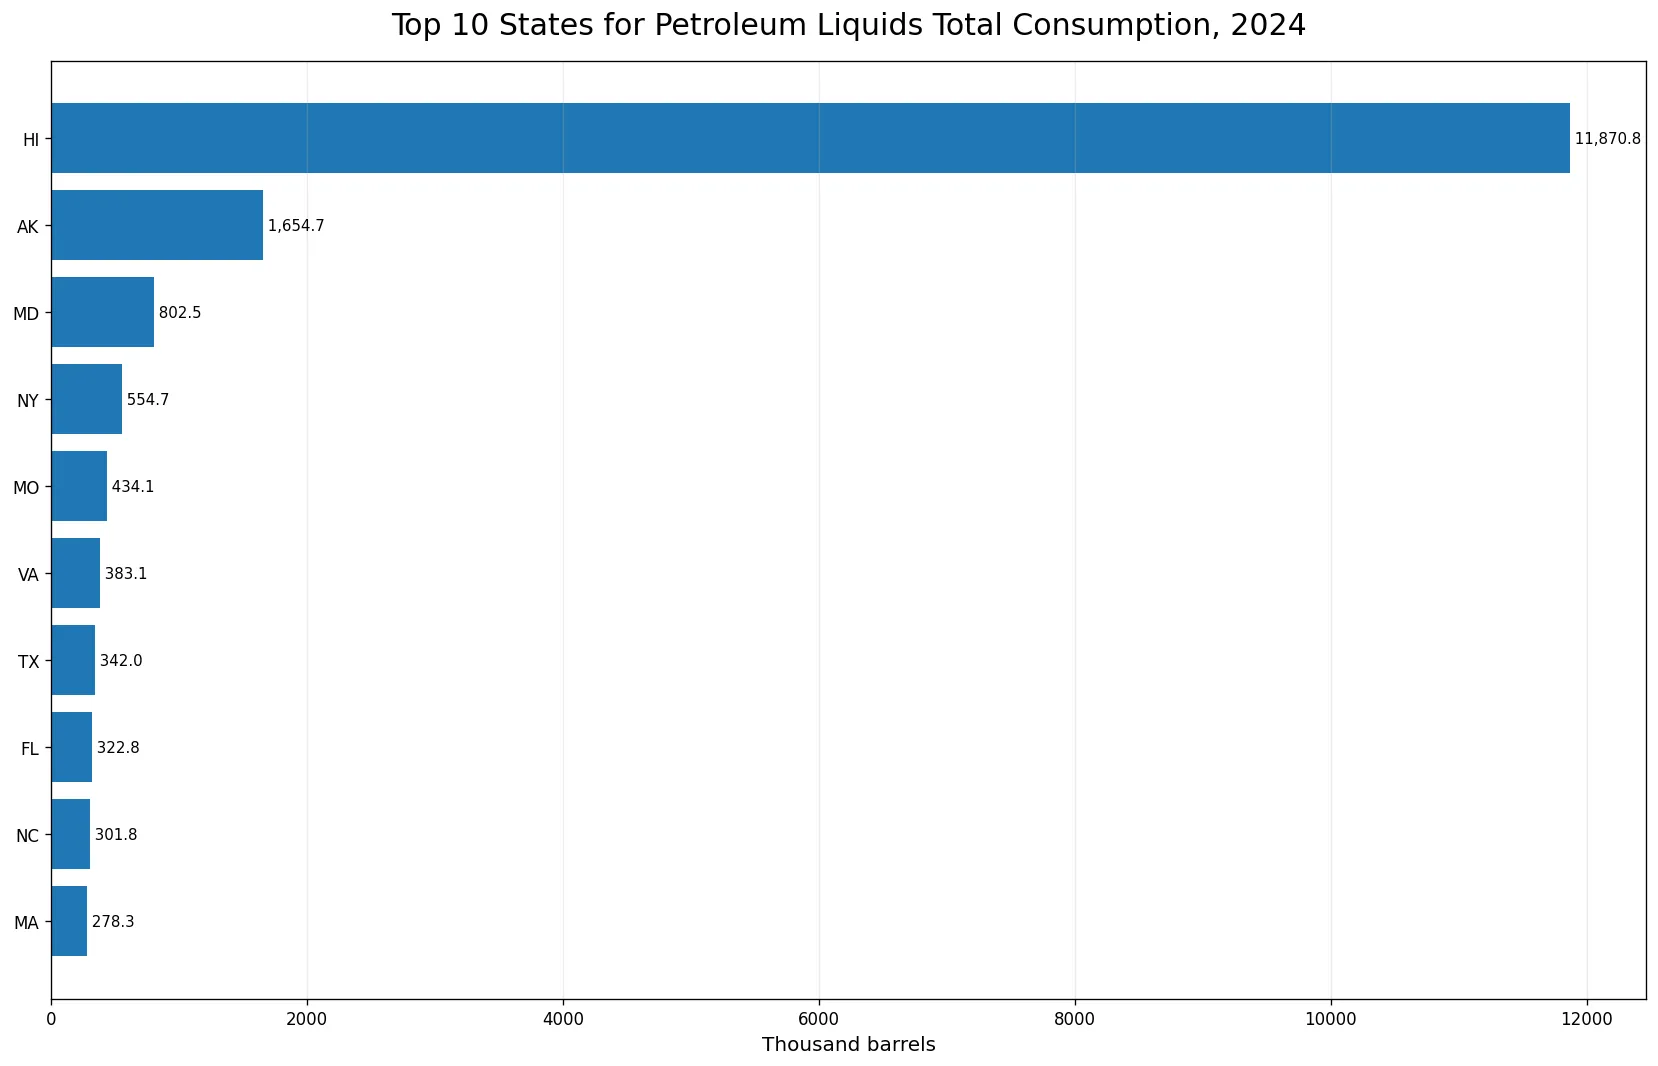
Petroleum liquids used for useful thermal output were distributed very unevenly across U.S. states in 2024. Annual observations from the U.S. Energy Information Administration cover all 50 states plus the District of Columbia and sum to about 2,238.0 thousand barrels. The arithmetic mean was 43.9 thousand barrels, but the median was only 6.035 thousand barrels, a large gap that immediately signals a highly skewed distribution.
Hawaii recorded the largest value at 479.259 thousand barrels, followed by Georgia at 348.934, Maryland at 319.828, and Virginia at 296.184. Together, those four states accounted for 64.5% of the 51-jurisdiction total. This concentration is more informative than a simple national average because most states were far below the largest observations.
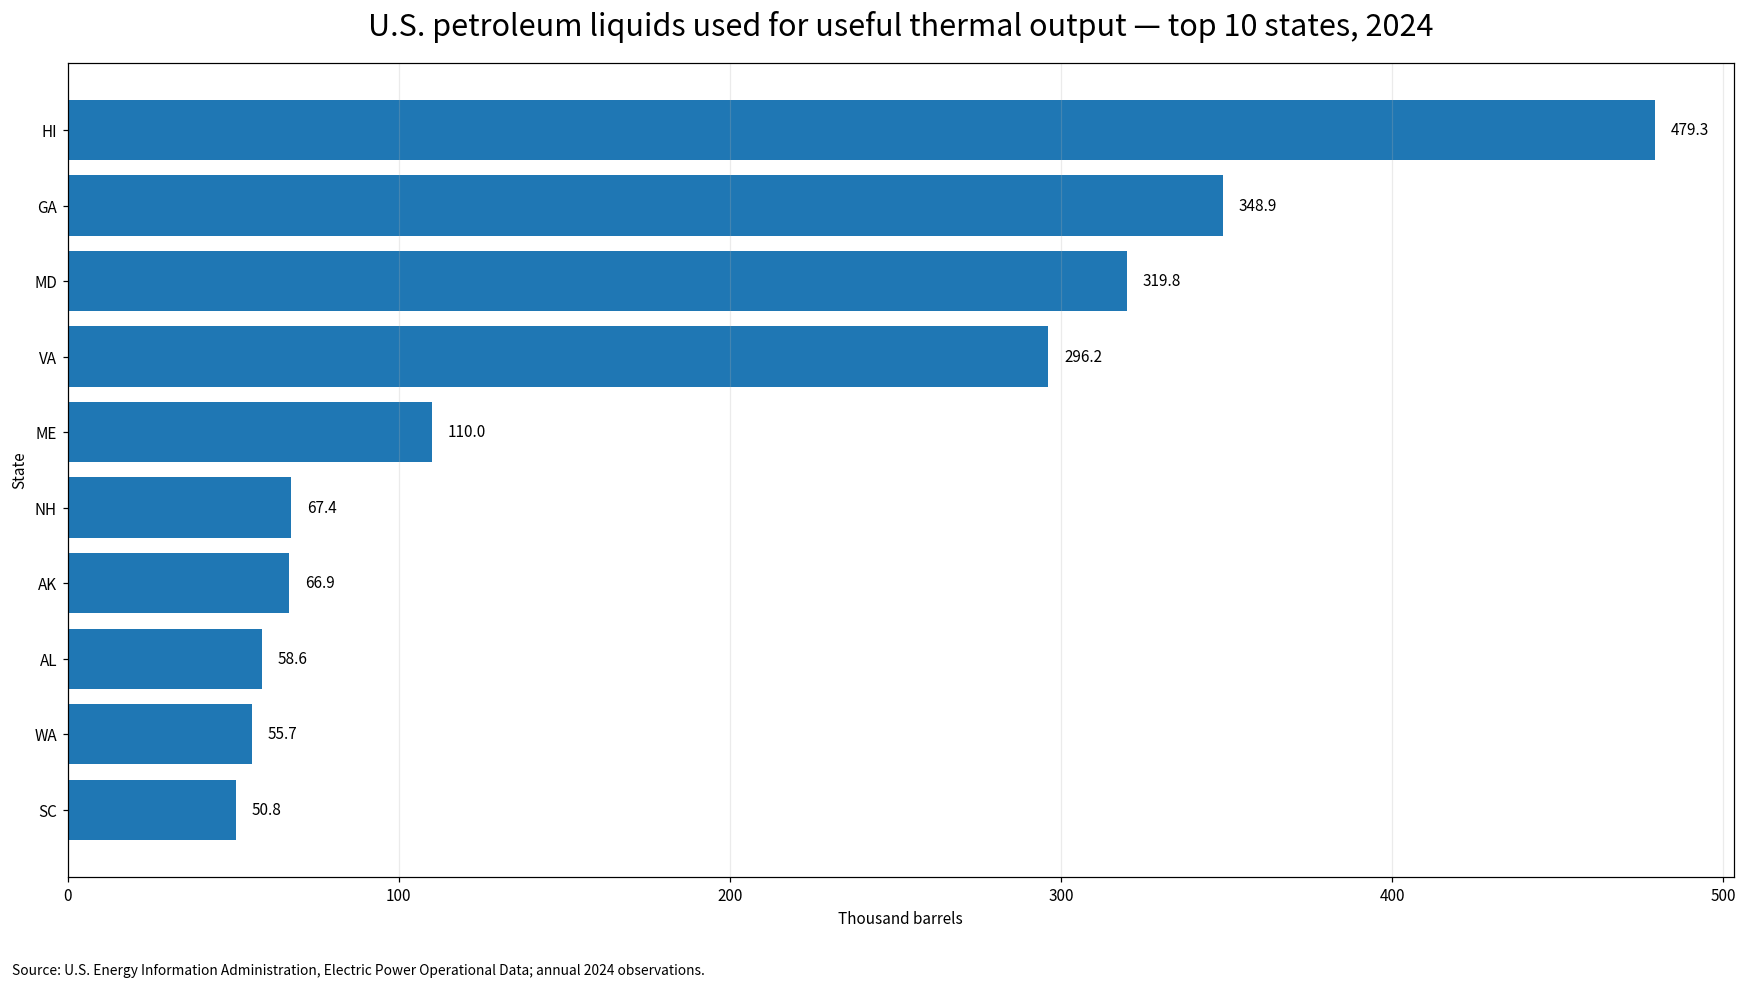
Table of Contents
What the EIA measure represents
The measure used here is the physical quantity of petroleum liquids consumed for useful thermal output within the EIA Electric Power Operational Data series. The field is reported in thousand barrels. It is not a measure of total petroleum consumption in a state, transportation fuel demand, household heating-oil sales, or all industrial fuel use. Keeping that boundary clear is essential when comparing states.
Useful thermal output refers to heat that is produced for a useful purpose in the reporting framework rather than electricity generation alone. Because the metric is tied to a specific operational-data series and fuel category, it should be read as a focused view of energy use inside that reporting scope. A large number does not by itself establish that a state is broadly more petroleum-dependent than another state.
The 2024 slice contains 51 observations and no missing rows. Eight states are reported at exactly zero: Idaho, Kansas, Nebraska, New Mexico, Nevada, Utah, West Virginia, and Wyoming. A reported zero is not the same as “no data.” In this dataset it is a valid annual observation for the selected measure, fuel category, and year.
Four states accounted for nearly two-thirds of the total
Hawaii alone represented 21.4% of the total. Adding Georgia raises the cumulative share to 37.0%. Maryland and Virginia bring the top-four total to 64.5%. The top 10 states together accounted for 82.8%, leaving less than one-fifth of the total spread across the remaining 41 jurisdictions.
That concentration explains why the average state value can be misleading. The mean of 43.9 thousand barrels is almost seven times the median of 6.035 thousand barrels. For a visitor trying to understand a “typical” state, the median is therefore more representative than the mean. For a visitor trying to understand where most of the measured fuel was consumed, the cumulative share of the leading states is more useful.
The ranking also contains a sharp break after the first four observations. Virginia, in fourth place, reported 296.184 thousand barrels, while Maine, in fifth place, reported 110.007 thousand barrels. That is not a gradual step down. It separates a very high-use group from a second tier whose values remain notable but are much smaller.
A second tier runs from roughly 50 to 110 thousand barrels
Maine ranked fifth at 110.007 thousand barrels. New Hampshire followed at 67.437, Alaska at 66.880, Alabama at 58.626, Washington at 55.719, and South Carolina at 50.757 thousand barrels. These states were well below the top four but still above most of the country.
Massachusetts reported 48.637 thousand barrels, North Carolina 43.342, New York 35.704, Texas 35.399, Wisconsin 32.673, and Ohio 30.425. This middle-to-upper range is important because it shows that the distribution is not simply “four large states and everyone else near zero.” There is a meaningful group with tens of thousands of barrels, followed by a long lower tail.
At the opposite end, several positive observations were extremely small. Vermont recorded 0.006 thousand barrels, Oregon 0.007, Colorado 0.008, the District of Columbia 0.011, Oklahoma 0.015, and Arizona 0.026. These are valid positive values, but they are tiny compared with the hundreds of thousands of barrels reported by the leading states.
Top 15 state observations in 2024
| State | Consumption (thousand barrels) | Share of total |
|---|---|---|
| Hawaii | 479.259 | 21.4% |
| Georgia | 348.934 | 15.6% |
| Maryland | 319.828 | 14.3% |
| Virginia | 296.184 | 13.2% |
| Maine | 110.007 | 4.9% |
| New Hampshire | 67.437 | 3.0% |
| Alaska | 66.88 | 3.0% |
| Alabama | 58.626 | 2.6% |
| Washington | 55.719 | 2.5% |
| South Carolina | 50.757 | 2.3% |
| Massachusetts | 48.637 | 2.2% |
| North Carolina | 43.342 | 1.9% |
| New York | 35.704 | 1.6% |
| Texas | 35.399 | 1.6% |
| Wisconsin | 32.673 | 1.5% |
The table makes the scale differences visible without implying a causal explanation. Hawaii was more than four times Maine, while the top four states together exceeded 1.44 million barrels on the same thousand-barrel scale, or 1,444.205 thousand barrels. Once the ranking moves beyond the first several states, the values decline rapidly toward single digits.
How to interpret zeros, small values, and the unit
Because the source uses thousand barrels, a value such as 0.006 should not be read as six thousand barrels. It represents 0.006 thousand barrels, or six barrels when converted literally. The same unit convention applies to every row. Preserving the published unit is important because rounding small observations too aggressively can make distinct values appear to be zero.
Zeros also should not be replaced with missing values. The supplied annual slice contains complete geographic coverage for 50 states and the District of Columbia. If a future version of the data omits a jurisdiction, that absence would need to be displayed separately from a measured zero. Treating missing data as zero would distort both the national total and any ranking.
A map can be useful for state-level energy data, but only when the statistical table is joined to an authoritative state-boundary layer and the match rate is checked. No boundary geometry is part of this source slice, so the analysis uses a ranking chart and table rather than inventing a choropleth. That choice preserves the geographic information without introducing an unverified spatial join.
What this comparison can and cannot tell us
First, these are absolute quantities, not normalized rates. The values are not divided by state population, electricity generation, plant capacity, gross state product, or industrial output. A smaller state can therefore rank above a larger state, and a large state can rank low. The chart answers where more petroleum liquids were consumed within this metric, not which state had the highest intensity or dependence.
Second, the dataset is a one-year snapshot. A state may have a high or low value because of its long-term equipment mix, a temporary operating condition, fuel availability, outages, maintenance, or other factors. The 2024 observations alone cannot distinguish those explanations. A trend analysis would require comparable annual values for multiple years with the same field, fuel facet, sector facet, and unit.
Third, barrels are a physical-volume measure. They do not directly show cost, heat content, emissions, or useful-energy efficiency. Petroleum products can differ in energy content, and the economic significance of a barrel depends on price and operating context. Those questions need additional EIA series or other official data rather than assumptions derived from this ranking.
The source is the U.S. Energy Information Administration Open Data system. The comparison keeps one common annual period, 2024, one petroleum-liquids fuel category, one useful-thermal-output consumption field, and one geographic level. No values were imputed, and the ranking is calculated directly from the published state observations.
Key takeaway
The central feature of the 2024 distribution is concentration. Hawaii, Georgia, Maryland, and Virginia together accounted for 64.5% of the measured total, while the top 10 reached 82.8%. At the same time, the median state was only 6.035 thousand barrels and eight states were reported at zero. Reading both ends of the distribution gives a much clearer picture than relying on the national mean alone.
Why the distribution matters for comparison
A ranking can look simple, but the shape of the distribution changes what a ranking means. When values are close together, movement of one or two places may reflect only a small numerical difference. Here, the gaps at the top are large. Hawaii exceeded Georgia by about 130.3 thousand barrels, while Georgia exceeded Maryland by about 29.1 thousand barrels. Maryland and Virginia were closer, separated by about 23.6 thousand barrels. Those gaps show that the first position is unusually distant from the next group.
The lower half of the distribution tells a different story. With a median of 6.035 thousand barrels, at least half of the jurisdictions were at or below a value only a small fraction of the leading states. This contrast is why a state-by-state view adds information that disappears when all jurisdictions are combined into a single total.
For future comparison, a useful next step would be to pair the same metric with its annual history. That would show whether the leading states remain consistently high, whether their shares fluctuate, and whether zeros persist. A second extension would normalize the physical quantity by an appropriate denominator, but the denominator should match the question being asked rather than being chosen only because it is readily available.
Frequently Asked Questions
What does petroleum consumption for useful thermal output measure?
It is the physical quantity of petroleum liquids consumed for useful thermal output within the EIA Electric Power Operational Data reporting scope. The 2024 state values are reported in thousand barrels.
Which state had the highest value in 2024?
Hawaii had the largest observation at 479.259 thousand barrels, followed by Georgia, Maryland, and Virginia.
Does a zero mean the state had no data?
No. In this 51-jurisdiction annual slice, zero is a reported value for the selected metric. Missing data would need to be treated separately.
Related Articles
Green Map creates custom-edited map images using open geographic data sources such as geoBoundaries, Natural Earth, OpenStreetMap, and government open data. These maps are edited visual materials, not raw data files, and are provided for education, documents, presentations, and graphic reference.