Distillate fuel oil use for electricity generation varied sharply across U.S. states in 2024. In the U.S. Energy Information Administration annual data, Hawaii recorded 2,524.613 thousand short tons, the highest value among the 50 states and the District of Columbia. Alaska followed at 967.589 thousand short tons. At the other end, the District of Columbia reported 0.064 thousand short tons and Idaho 0.083. The spread is so wide that a simple ranking hides one of the most important features of the dataset: consumption was concentrated in a relatively small group of jurisdictions.
The measure is a physical quantity of distillate fuel oil consumed for electricity generation, reported in thousand short tons. It is not electricity output, the percentage of generation supplied by oil, fuel efficiency, cost, or emissions. That distinction matters because two states can use different amounts of fuel for many reasons that are not contained in this single-year table. The safest use of the data is to compare the recorded 2024 fuel quantities and describe the distribution without assigning causes that the dataset does not establish.
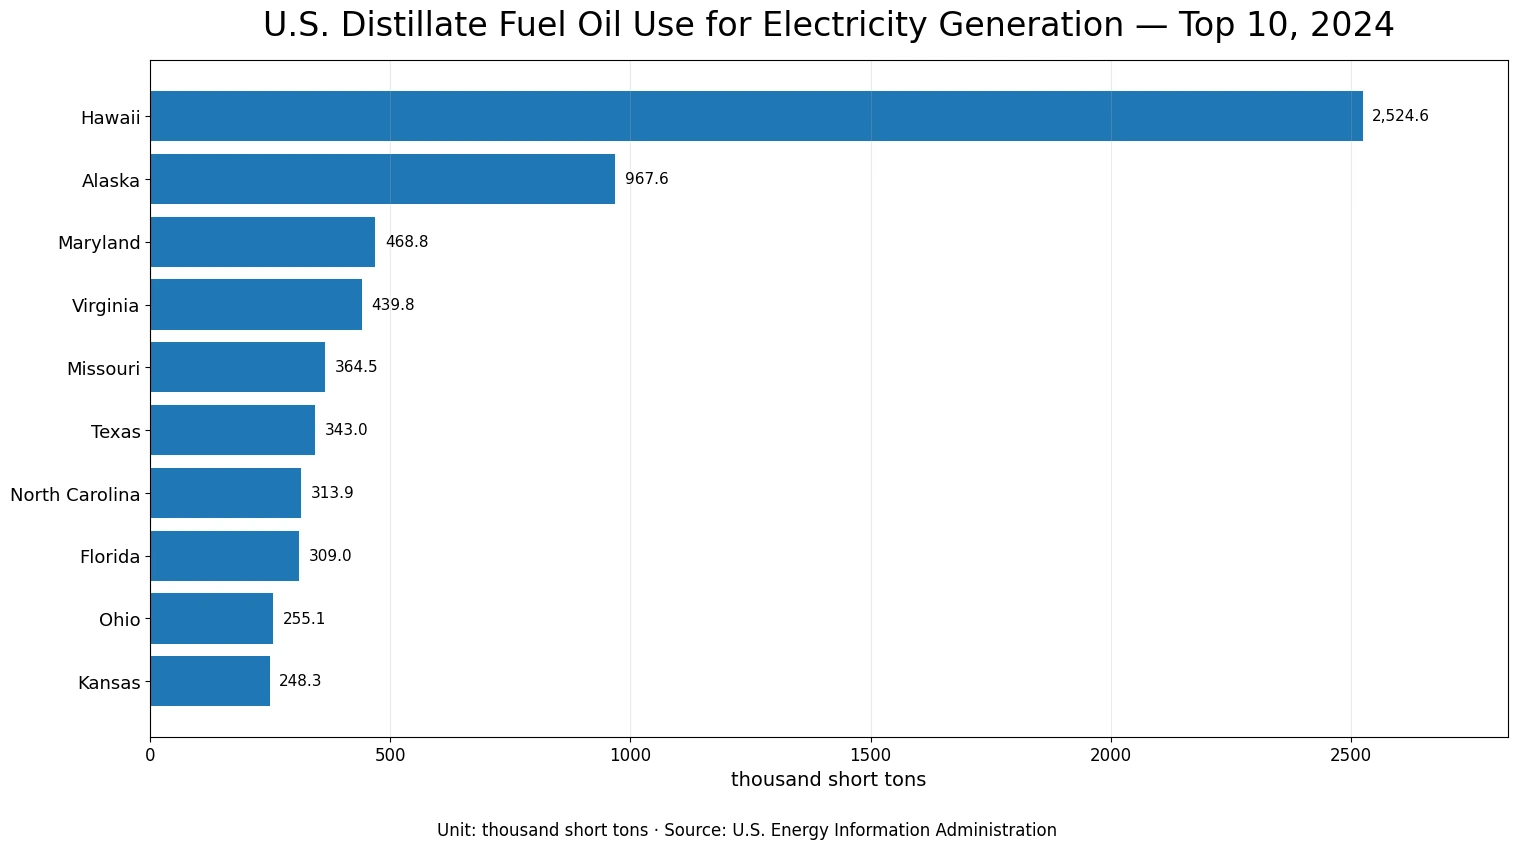
Table of Contents
A highly concentrated upper end
Across all 51 jurisdictions, the reported values sum to 9,638.113 thousand short tons. Hawaii alone represents about 26.2% of that total, while Alaska represents about 10.0%. Together they account for roughly 36.2%. The third-highest value, Maryland at 468.829 thousand short tons, is less than half Alaska’s level. This creates a long upper tail and helps explain why the arithmetic mean, 188.983 thousand short tons, is much higher than the median of 94.235.
The difference between the mean and median is useful because it shows that the “typical” state depends on the statistic chosen. The average is pulled upward by a few large observations. The median is closer to the center of the ordered list and therefore better represents the middle of this uneven distribution. Arkansas, at 94.235 thousand short tons, sits at the median value in the 51-jurisdiction dataset.
The ten largest 2024 values
After Hawaii and Alaska, the next group includes Maryland, Virginia, Missouri, Texas, North Carolina, Florida, Ohio, and Kansas. The top ten together consumed 6,234.598 thousand short tons, or about 64.7% of the 51-jurisdiction total. The top five alone account for about 49.4%. These calculations show why statewide comparisons should not assume that consumption is evenly distributed across the country.
| Jurisdiction | 2024 consumption (thousand short tons) |
|---|---|
| Hawaii | 2,524.613 |
| Alaska | 967.589 |
| Maryland | 468.829 |
| Virginia | 439.811 |
| Missouri | 364.502 |
| Texas | 342.997 |
| North Carolina | 313.873 |
| Florida | 309.001 |
| Ohio | 255.072 |
| Kansas | 248.311 |
There is no single simple regional block in the top ten. The list includes the two noncontiguous states, Atlantic states such as Maryland and Virginia, central states such as Missouri and Kansas, southern states including Texas, North Carolina, and Florida, and Ohio in the Midwest. That geographic mix is a reminder that the 2024 values describe state-level fuel use, not a uniform regional pattern. A regional explanation would require additional evidence beyond these consumption observations.
Most jurisdictions are far below the two largest values
Twenty-eight of the 51 jurisdictions recorded less than 100 thousand short tons, while 23 were at or above that threshold. Values near the middle are much more tightly grouped than the extremes. Washington recorded 99.369, Colorado 96.224, Arkansas 94.235, California 91.920, and North Dakota 89.202 thousand short tons. In this part of the ranking, moving several places up or down can represent a fairly modest absolute difference.
That is why rank alone should not be treated as the main result. A state ranked around the middle can be quite similar to several nearby states even when the ordinal positions differ. Conversely, the gap between first and third place is enormous. Looking at both rank and physical quantity gives a more faithful picture than either measure by itself.
The lower end also contains several distinct levels
The lowest ten values range from almost zero to nearly 24 thousand short tons. The District of Columbia and Idaho are below 0.1 thousand short tons. New Mexico and Maine are just above 2 thousand. Vermont is 8.925, Rhode Island 10.001, Mississippi 12.512, Nevada 12.557, Louisiana 18.090, and Oregon 23.952 thousand short tons. Grouping all of them into a single “low” category can obscure meaningful differences within the lower tail.
| Jurisdiction | 2024 consumption (thousand short tons) |
|---|---|
| District of Columbia | 0.064 |
| Idaho | 0.083 |
| New Mexico | 2.011 |
| Maine | 2.314 |
| Vermont | 8.925 |
| Rhode Island | 10.001 |
| Mississippi | 12.512 |
| Nevada | 12.557 |
| Louisiana | 18.090 |
| Oregon | 23.952 |
This matters especially for maps. When a dataset has a maximum of 2,524.613 and a minimum of 0.064, broad equal-width classes can compress many lower values into the same color. A map can still be useful, but the legend and classification method strongly influence what readers see. A table or labeled values should accompany the visualization when precise comparisons are important.
What the EIA values can answer
The dataset directly answers a narrow but useful question: how much distillate fuel oil was recorded as consumed for electricity generation in each state and the District of Columbia during 2024? Because the year, fuel category, and unit are consistent across all rows, the values can support state-to-state comparisons, rankings, totals, medians, and concentration calculations.
It can also identify outliers. Hawaii and Alaska are clear high-side outliers in this cross-section, while the District of Columbia and Idaho sit extremely close to zero relative to the rest of the distribution. Those are descriptive observations. They do not, by themselves, reveal the operational, economic, geographic, or policy reasons behind the values.
What this dataset does not establish
A high fuel-consumption value does not automatically mean that a state generates more electricity overall, depends more heavily on oil in percentage terms, has less efficient plants, or produces more emissions per unit of electricity. Each of those questions requires a different denominator or a separate dataset. Electricity generation would require output data; fuel share would require total generation or total fuel input; efficiency would require an input-output relationship; and emissions analysis would require appropriate emissions factors or reported emissions.
The table is also a one-year snapshot. It cannot establish an upward or downward trend. To discuss change over time, the same EIA series should be collected for additional years using the same definitions and units. Comparing 2024 with a differently defined series, a different fuel type, or a heat-content measure would mix unlike quantities.
How to use the state comparison responsibly
For a quick state profile, start with the exact 2024 quantity and compare it with the median of 94.235 thousand short tons. Then look at nearby states in the ordered distribution rather than relying only on the national average. If the state is near the top, it is useful to compare its value with Hawaii, Alaska, and the rest of the top ten. If it is near the bottom, the low-value table provides more context than a single national rank.
For deeper energy analysis, the next step is to pair this fuel-use series with variables that answer a different part of the question. State generation by energy source can show whether distillate fuel oil is large or small relative to the overall power mix. Multi-year observations can show whether the 2024 value is typical or unusual. Plant-level information can help identify where the consumption occurs. Those extensions should be treated as separate evidence rather than inferred from the physical consumption number alone.
The main pattern in one sentence
The 2024 EIA state data show a strongly uneven distribution of distillate fuel oil used for electricity generation: Hawaii and Alaska account for a large share of the total, more than half of jurisdictions remain below 100 thousand short tons, and the middle of the distribution is much lower than the arithmetic average. That combination is more informative than simply naming the state with the highest value.
The source is the U.S. Energy Information Administration Electricity, Electric Power Operational Data annual series for 2024. When comparing these numbers with other energy statistics, keep the unit and fuel definition intact: the values here are thousand short tons of distillate fuel oil consumed for electricity generation.
Frequently Asked Questions
Which state used the most distillate fuel oil for electricity generation in 2024?
Hawaii had the highest reported value at 2,524.613 thousand short tons, followed by Alaska at 967.589 thousand short tons.
Does this measure total electricity generation?
No. It measures the physical quantity of distillate fuel oil consumed for electricity generation, not electricity output or the fuel’s percentage share of generation.
What was the median state-level value?
The median across the 50 states and the District of Columbia was 94.235 thousand short tons, compared with a mean of 188.983.
Related Articles
Green Map creates custom-edited map images using open geographic data sources such as geoBoundaries, Natural Earth, OpenStreetMap, and government open data. These maps are edited visual materials, not raw data files, and are provided for education, documents, presentations, and graphic reference.