UNESCO Institute for Statistics (UIS) indicator ETOIP.02.PR.GPIA compares the female and male percentages of pre-primary enrolment that are in private institutions. It is an adjusted gender parity index (GPIA), not the private-enrolment percentage itself. The 2024 data used here contain 80 reported country and area observations. A value of 1 indicates the same underlying percentage for females and males, while values below 1 point to a lower female share and values above 1 to a higher female share.
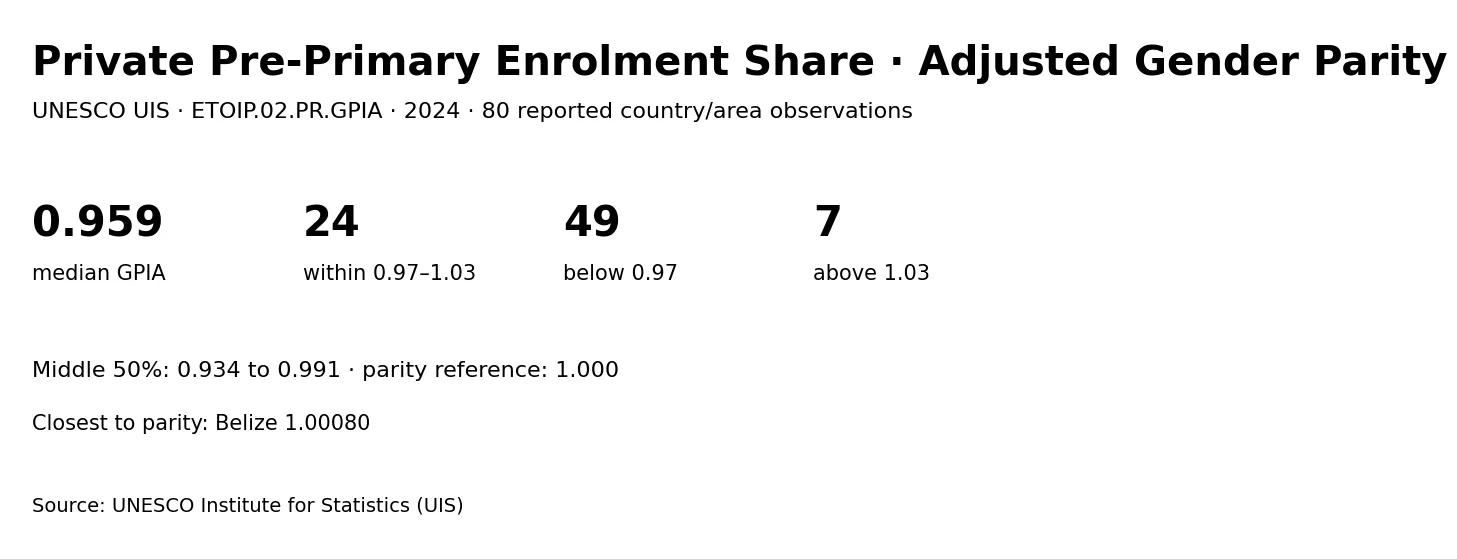
The median is 0.95852 and the mean is 0.94734. The mean sits farther below 1 because a few low observations, especially South Sudan at 0.05068 and Venezuela at 0.38078, have a strong downward effect. The median therefore describes the center of this cross-section better than the mean alone. The important comparison is not “which country has the highest percentage,” but how far each GPIA lies from the parity reference of 1 and on which side of 1 it falls.
Table of Contents
GPIA measures gender balance in a percentage, not the percentage itself
A GPIA value of 0.90 does not mean that 90% of pre-primary enrolment is private. It means that the female value of the underlying private-institution percentage is below the male value. A value of 1.10 similarly does not mean 110% private enrolment. It indicates that the female percentage is higher than the male percentage. This distinction is essential because otherwise an index designed to compare genders can easily be mistaken for an enrolment rate.
UIS adjusts the conventional female-to-male parity ratio so that values above 1 are transformed to make the scale symmetrical around 1 and bounded between 0 and 2. The practical benefit is that a value 0.10 below parity and a value 0.10 above parity represent comparable distances from the reference point, while their directions are opposite. The adjustment makes cross-country comparisons easier without changing the basic interpretation of which side has the higher underlying indicator value.
UIS commonly treats values from 0.97 to 1.03 as close to parity. In this 2024 cross-section, 24 of the 80 reported observations fall inside that band. Another 49 are below 0.97 and 7 are above 1.03. The counts show that observations below the parity band are more common than observations above it. That means lower female private-enrolment shares relative to male shares occur more often in the reported data, but it does not establish a broader disadvantage in pre-primary participation because the underlying variable is specifically the private-institution share.
Most observations remain much closer to 1 than the full range suggests
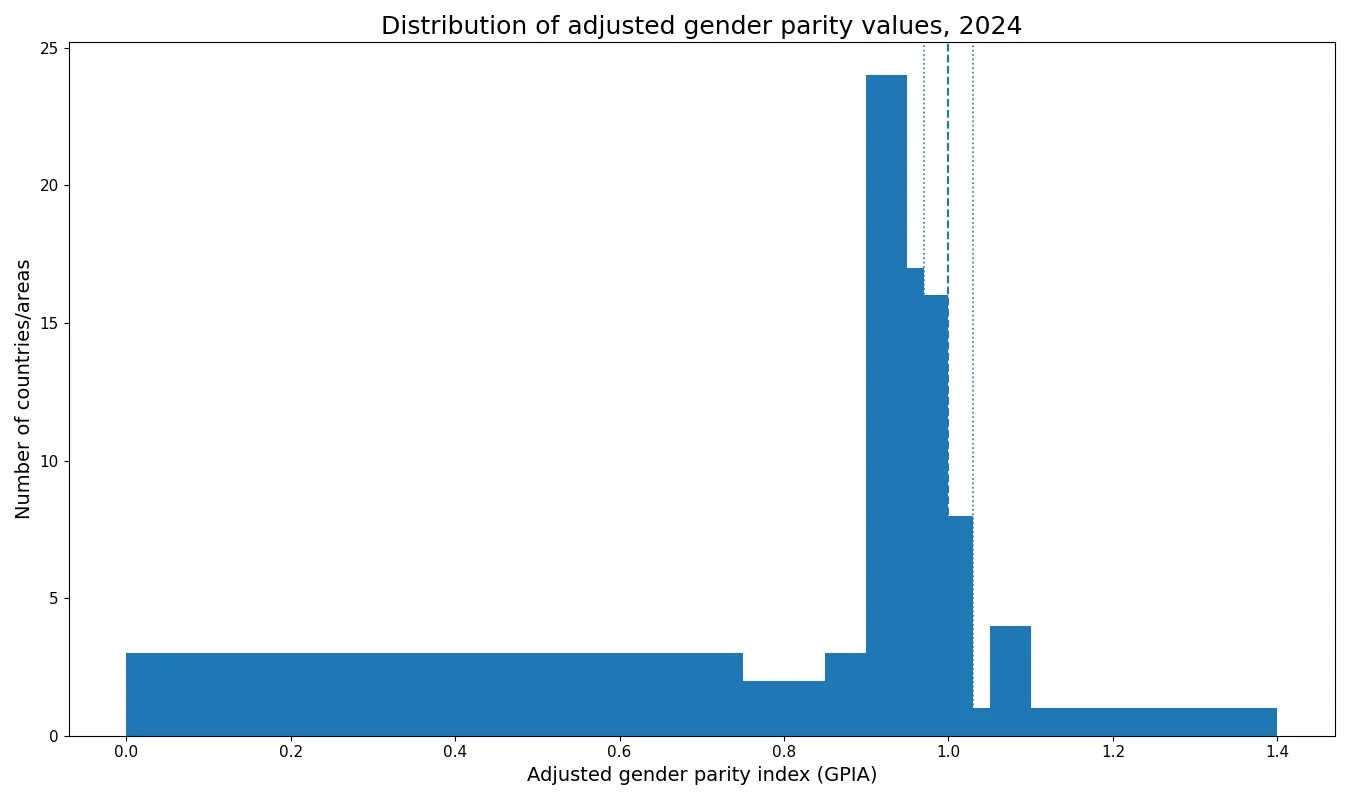
The first quartile is 0.93418 and the third quartile is 0.99058. The central half of the reported values therefore lies in a relatively narrow interval around the parity reference. There are 42 observations between 0.95 and 1.05. The median absolute distance from 1 is about 0.04737, meaning that half of the observations are within roughly 0.047 of exact parity.
The full range, from 0.05068 to 1.38304, is much wider because a small number of countries sit far from the center. This is a useful example of why a range can exaggerate the dispersion of a typical observation. The mean is also sensitive to those extremes. By contrast, the median and interquartile range show that much of the dataset is concentrated close to 1 even though the tails are substantial.
The parity band and the distance from 1 answer different but complementary questions. The 0.97–1.03 band gives a practical threshold for describing values as close to parity. Distance from 1 shows the size of the difference on a continuous scale. Two countries can both fall outside the band but differ greatly in magnitude—for example, 0.96 is only slightly outside it, while 0.50 would represent a much larger difference in the underlying female and male percentages.
The observations closest to 1 show nearly matched female and male shares
Belize is the closest reported observation to exact parity at 1.00080. Cameroon follows at 1.00217, Saudi Arabia at 0.99668, Costa Rica at 0.99477, and Azerbaijan at 0.99436. Their distances from 1 are small, so the female and male private-institution shares of pre-primary enrolment are very similar on this measure.
| Country or area | GPIA | Distance from 1 |
|---|---|---|
| Belize | 1.00080 | 0.00080 |
| Cameroon | 1.00217 | 0.00217 |
| Saudi Arabia | 0.99668 | 0.00332 |
| Costa Rica | 0.99477 | 0.00523 |
| Azerbaijan | 0.99436 | 0.00564 |
| Maldives | 0.99230 | 0.00770 |
| Finland | 0.99132 | 0.00868 |
| Togo | 0.99034 | 0.00966 |
| Morocco | 0.98414 | 0.01586 |
| El Salvador | 1.01632 | 0.01632 |
Closeness to 1 should not be turned into a ranking of education systems. It only indicates similarity between female and male values for this one institutional-composition measure. A country can have parity in the private share while still having very different overall participation levels, costs, public provision, or learning conditions. Those dimensions need separate indicators. Gender parity in a specific ratio is narrower than gender equality across the education system.
The 0.97–1.03 convention also should not be read as a claim that every value inside the interval is statistically or institutionally identical. It is a practical interpretation range used to allow small differences around 1. Administrative definitions, the size of the enrolled population, and the mix of public and private providers vary across countries, so the index is best used as a comparative signal rather than a complete description of each system.
Very low values indicate a lower female private-institution share
The lowest reported value is South Sudan at 0.05068. Venezuela (Bolivarian Republic of) follows at 0.38078, then Cook Islands at 0.73529, Uzbekistan at 0.80018, and Switzerland at 0.84597. The first two values are especially far from 1 and account for much of the gap between the mean and median.
| Country or area | 2024 GPIA |
|---|---|
| South Sudan | 0.05068 |
| Venezuela (Bolivarian Republic of) | 0.38078 |
| Cook Islands | 0.73529 |
| Uzbekistan | 0.80018 |
| Switzerland | 0.84597 |
| Chad | 0.87346 |
| China | 0.88446 |
| Albania | 0.88565 |
| Ukraine | 0.90420 |
| Algeria | 0.90612 |
A low GPIA means that the female private-institution percentage is lower than the male percentage. It does not by itself mean that girls have less access to pre-primary education overall. A country may have extensive public pre-primary provision, and girls and boys can differ in their public/private mix even if total participation is similar. The indicator therefore describes the gender composition of private enrolment shares, not total enrolment access.
Explaining why a value is very low would require the sex-specific underlying percentages as well as information on public provision, enrolment totals, fees, geography, and institutional rules. The index shows direction and magnitude of a disparity; it does not identify the mechanism that produced it. Causal claims about household choice, policy, income, or school supply would need additional evidence.
Values above 1 indicate a higher female share
At the upper end, Armenia records 1.38304. Seychelles follows at 1.10398, Barbados at 1.07817, Senegal at 1.07745, and Bahamas at 1.07250. These values are on the opposite side of the parity reference: the underlying private-institution percentage is higher for females than for males.
| Country or area | 2024 GPIA |
|---|---|
| Armenia | 1.38304 |
| Seychelles | 1.10398 |
| Barbados | 1.07817 |
| Senegal | 1.07745 |
| Bahamas | 1.07250 |
| Monaco | 1.06548 |
| Côte d'Ivoire | 1.04744 |
| Oman | 1.02846 |
| Dominican Republic | 1.02750 |
| Ecuador | 1.02438 |
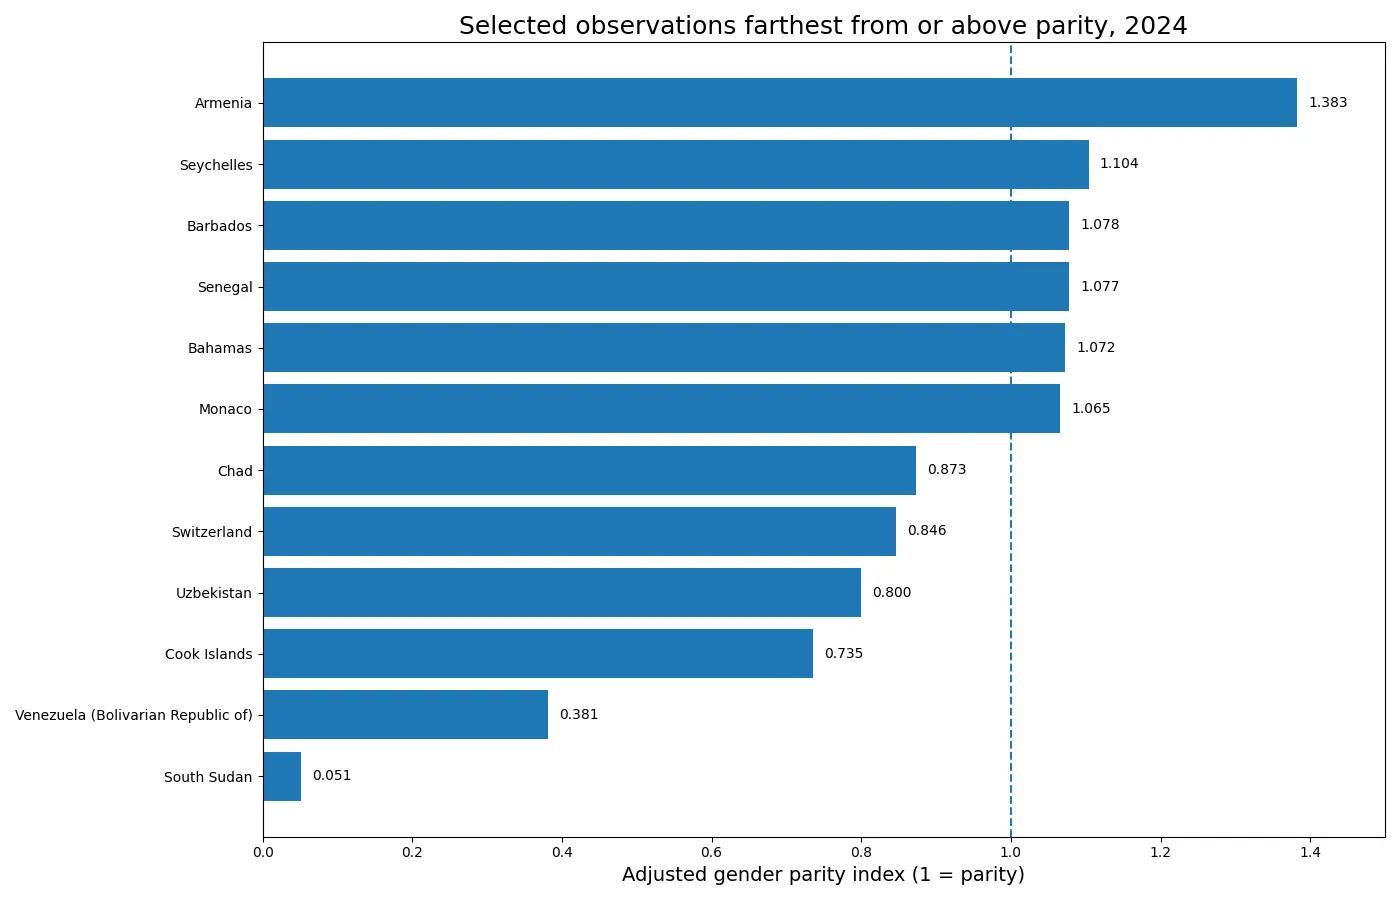
A GPIA above 1 should not be described as “better for girls” without qualification. The underlying indicator is the share of pre-primary enrolment in private institutions, and a larger private share is not inherently an educational advantage. It can reflect differences in provider structure, family choices, financing, location, or other factors. The neutral interpretation is simply that the female private-institution share is higher than the male share.
The adjusted form of the index is especially useful here because the direction can be separated from the distance. An observation at 0.90 and one at 1.10 lie on opposite sides but are equally distant from 1. That makes the magnitude of gender difference easier to compare than an unadjusted ratio whose upper side is not symmetrical.
The sorted profile separates the dense center from the tails
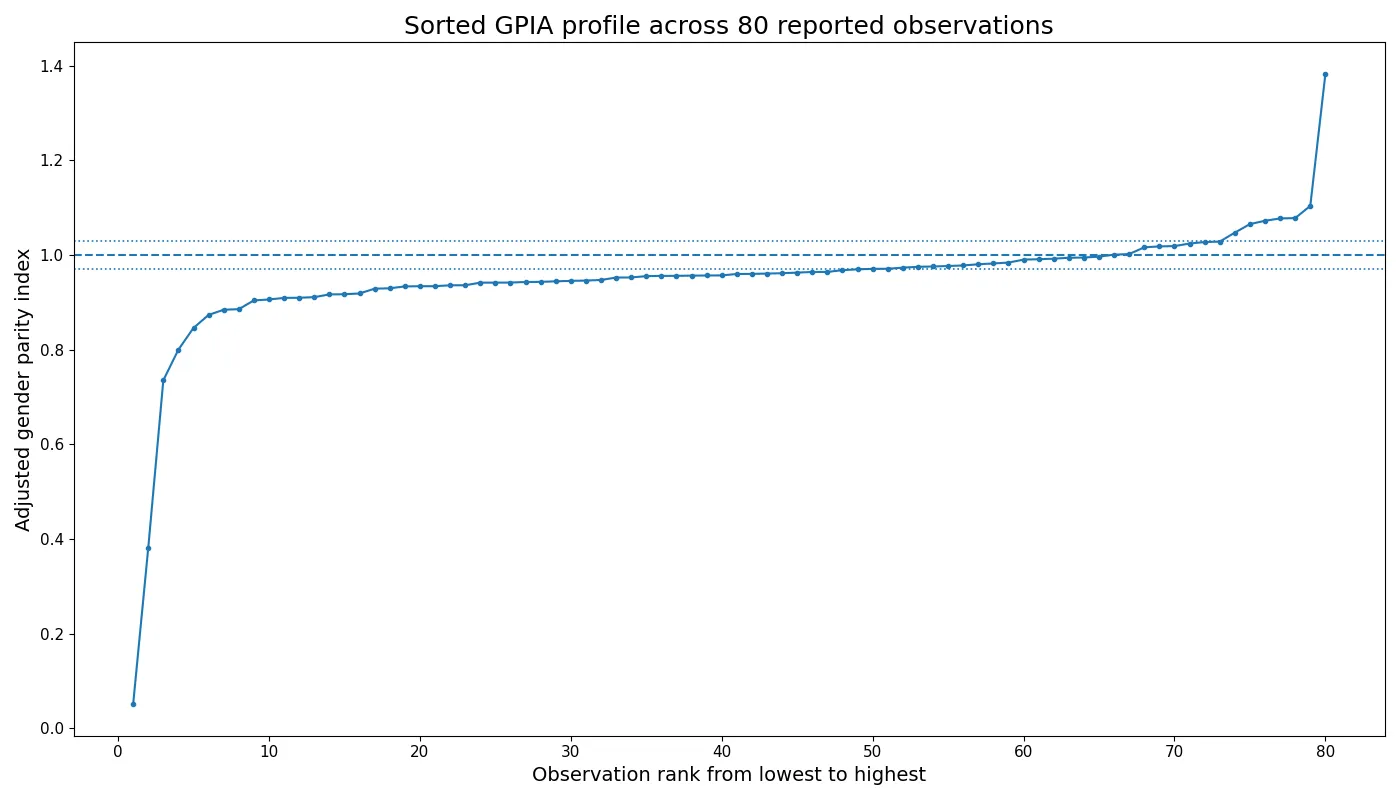
Sorting all 80 observations from low to high shows a sharp rise after the two lowest values, followed by a long, gradual section through the 0.8s, 0.9s, and values near 1. Only a small group is above 1.05, and Armenia stands clearly above the rest of the upper tail. This shape explains why the dataset can simultaneously have many near-parity observations and a mean noticeably below 1.
It is also useful to separate frequency from magnitude. There are many observations below 0.97, but a large share of them are only modestly below the threshold. A few very low values contribute much more to the overall spread than dozens of values around 0.94–0.97. Counting countries and measuring distance from parity are therefore two different summaries, and both are needed for a balanced description.
Missing countries are not zero observations
The UIS catalogue includes countries and territories that do not have a reported 2024 value in this extract. They should remain unreported rather than being assigned zero. The 80 rows analysed here have no missing values and no official zero values. Creating zeros for absent countries would invent extreme gender gaps, pull the distribution downward, and make any ranking misleading.
Coverage also limits the language of extremes. The safest wording is “lowest among the 80 reported 2024 observations,” not “lowest in the world.” Countries outside the reported set could have values anywhere on the scale, and this dataset does not support assumptions about them.
One year cannot show whether gender balance is improving
This is a 2024 cross-section, so it can compare countries in the same reference year but cannot establish whether a country is moving toward or away from parity over time. A trend analysis would require the same ETOIP.02.PR.GPIA series for several years. It would also be useful to examine the female and male underlying percentages, because a parity index can move even when both groups are changing.
A GPIA moving closer to 1 does not necessarily mean that the female private share increased. The male share may have decreased, or both may have changed at different rates. UIS notes that a parity index alone cannot show which group’s change produced the movement. For time-series interpretation, the index and the underlying sex-specific values should therefore be reviewed together.
Source and interpretation
The values come from UNESCO Institute for Statistics indicator ETOIP.02.PR.GPIA for 2024. UIS explains in its parity-index definition that the adjusted index is centered on 1 and bounded from 0 to 2, with values close to 1 indicating smaller differences between the compared groups. The underlying observations are available through the UNESCO UIS Data API.
The main picture is therefore a dense cluster near parity combined with a small number of large deviations. Twenty-four of the 80 reported observations fall inside the 0.97–1.03 parity band, while many others sit just below it and a few lie far away. Reading the index as distance and direction from 1—rather than as a percentage or a performance score—provides the clearest interpretation of the 2024 cross-country pattern.
Frequently Asked Questions
What does a GPIA value of 1 mean?
It means the female and male values of the underlying indicator are equal. UIS commonly treats 0.97–1.03 as close to gender parity.
Does GPIA 0.90 mean 90% of enrolment is private?
No. GPIA is an adjusted female-to-male comparison of the private-institution percentage, not the percentage itself.
How should values below and above 1 be read?
Below 1 means the female underlying percentage is lower than the male percentage; above 1 means it is higher.
Should countries without a reported row be treated as zero?
No. Unreported countries must remain missing rather than being assigned a zero value.
Related Articles
Green Map creates custom-edited map images using open geographic data sources such as geoBoundaries, Natural Earth, OpenStreetMap, and government open data. These maps are edited visual materials, not raw data files, and are provided for education, documents, presentations, and graphic reference.