The UNESCO Institute for Statistics (UIS) indicator ETOIP.2T3.PR measures the percentage of secondary education enrolment in private institutions for both sexes. The 2024 file used here contains 79 reported national observations, all expressed in percent. The median is 14.50%, while the arithmetic mean is higher at 21.98%. That gap is an immediate clue that the distribution is right-skewed: most reported values are comparatively low or moderate, while a small upper tail extends much farther upward.
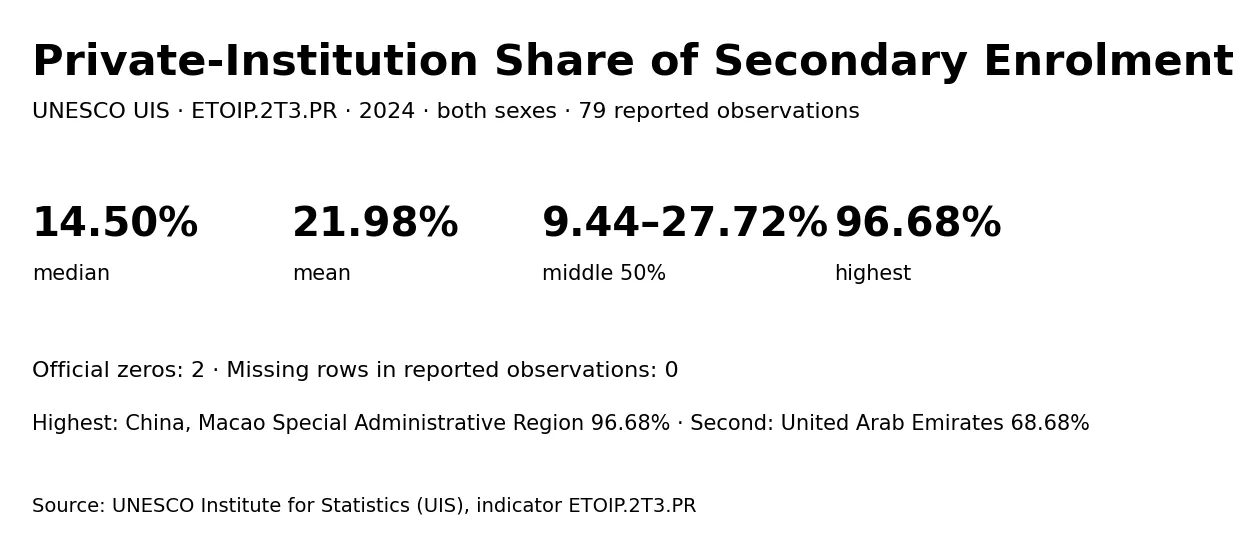
The source metadata distinguishes true zeros from missing coverage. There are 2 official zero observations in the reported data and no missing values inside the 79 rows. At the same time, many catalogue units are not reported in this extract. Those absent units are not zeros and are not inserted into the ranking. This distinction matters because zero-filling missing countries would artificially pull the median and mean downward and create false low-end observations that the official source did not publish.
Table of Contents
The median is 14.50%, well below the mean
When the 79 values are ordered from low to high, the midpoint is 14.50%. The first quartile is 9.44% and the third quartile is 27.72%, meaning that the central half of the reported observations lies within a band of about 18.28 percentage points. The mean, 21.98%, is substantially higher than the median. For a skewed distribution like this, the mean alone can make the typical reported country appear more private-sector intensive than the middle of the dataset actually is.
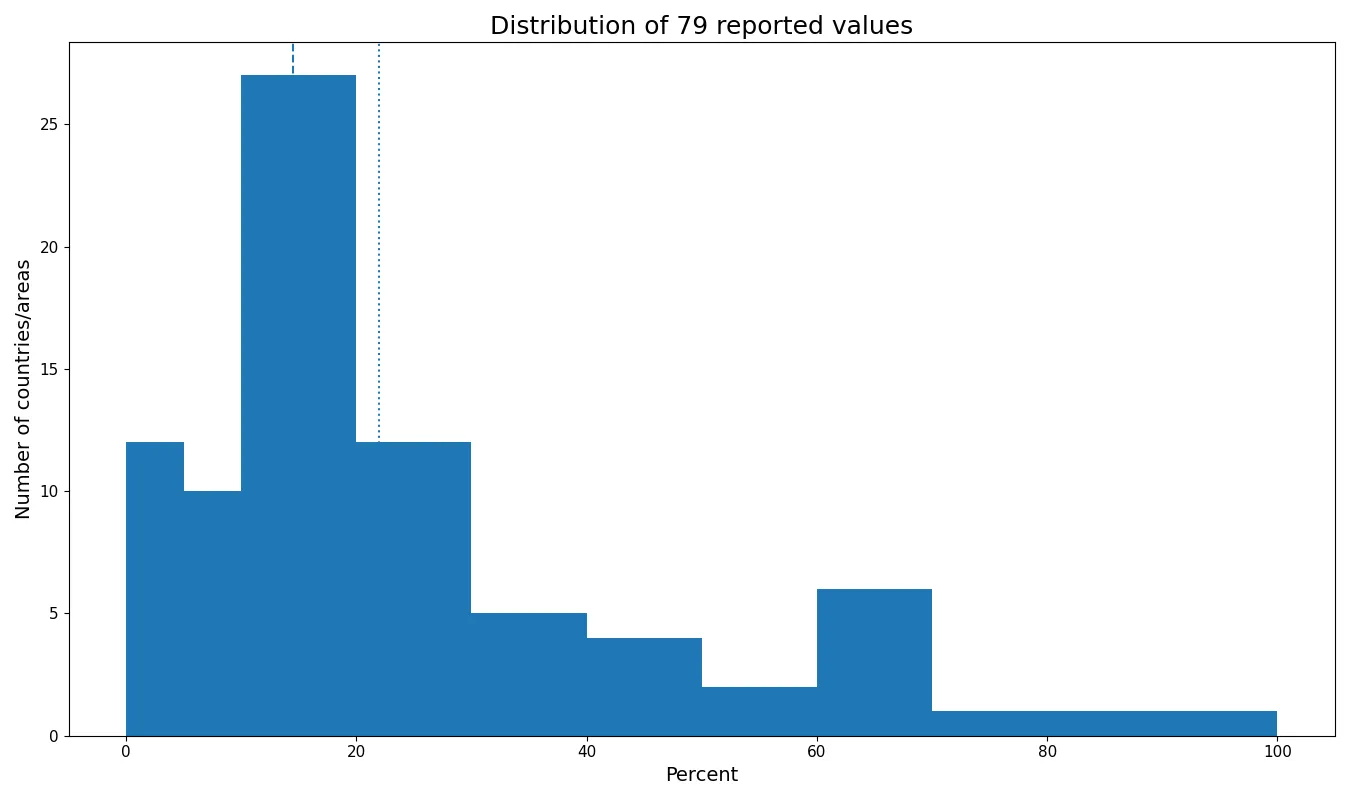
The band counts make that shape concrete. 12 observations are below 5%, and 22 are below 10%. Another 27 fall from 10% to under 20%, which is the single thickest interval in the dataset. There are 17 observations from 20% to under 40%, 6 from 40% to under 60%, and only 7 at 60% or higher. The full range stretches from 0% to 96.68%, but the middle of the distribution is much tighter than those endpoints imply.
If the single highest observation is removed, the mean of the remaining 78 falls to 21.02%. The shift is not enough to eliminate the skew, because several other observations are also high, but it shows why the upper tail deserves separate attention. A good summary therefore combines the mean with the median, quartiles, band counts, and the spacing between the largest values rather than treating one average as a complete description.
The highest observation stands far above second place
The largest 2024 value is China, Macao Special Administrative Region at 96.68%. The second-highest is United Arab Emirates at 68.68%, leaving a gap of about 28.00 percentage points. Lebanon follows at 67.29%, then Belize at 66.39% and Côte d’Ivoire at 63.32%. The top observation is therefore not simply first in a tightly packed group; it is separated sharply from the rest.
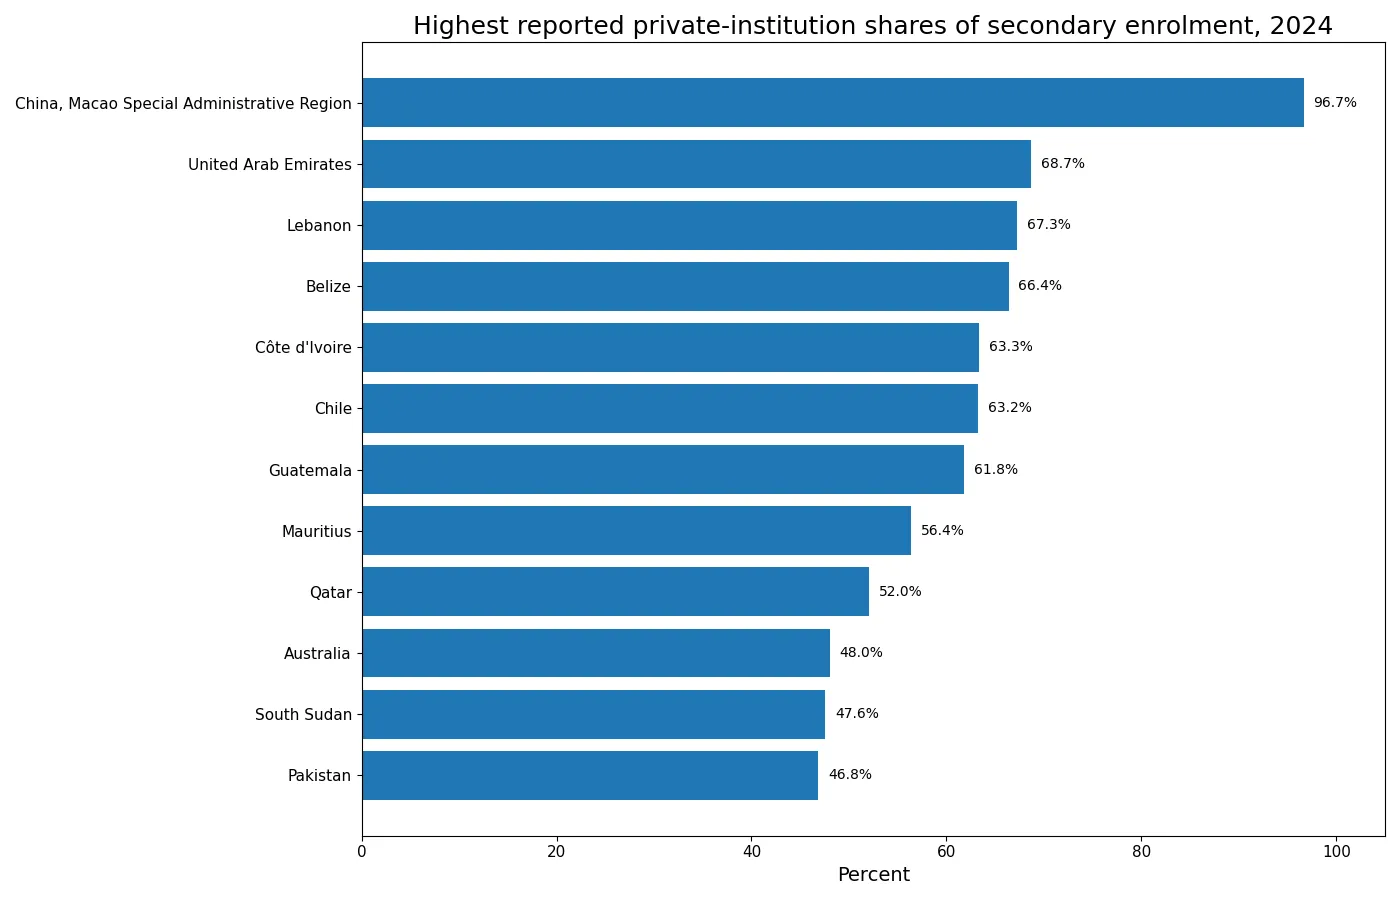
| Country or area | 2024 share |
|---|---|
| China, Macao Special Administrative Region | 96.68% |
| United Arab Emirates | 68.68% |
| Lebanon | 67.29% |
| Belize | 66.39% |
| Côte d'Ivoire | 63.32% |
| Chile | 63.23% |
| Guatemala | 61.83% |
| Mauritius | 56.36% |
| Qatar | 52.05% |
| Australia | 48.05% |
These values are not a ranking of education quality. A high private-institution share does not establish that students learn more, that access is broader, or that a school system is more effective. It describes the institutional composition of enrolment. Public and private schools can play very different roles across education systems, and legal classifications may also differ. Any explanation for why one country has a high or low share would require additional evidence on institutional rules, financing, student numbers, and the structure of secondary education.
The country percentages also cannot be added together or averaged as though every country had the same number of students. A country with millions of secondary students and a 10% private share may have more private-school students than a small territory with a 60% share. To calculate a combined international percentage, the underlying private-enrolment numerator and total-enrolment denominator would be needed for every geography. This file provides national percentages, so it is best suited to comparing the distribution of shares rather than estimating a global student share.
Official zeros must remain separate from missing countries
The two lowest reported observations are Niue and Curaçao, both at 0%. The source metadata explicitly identifies two official zero values, so they remain in all calculations. The next-lowest observations include Belarus at 0.66%, Uzbekistan at 0.85%, and Serbia at 1.18%.
| Country or area | 2024 share |
|---|---|
| Niue | 0.00% |
| Curaçao | 0.00% |
| Belarus | 0.66% |
| Uzbekistan | 0.85% |
| Serbia | 1.18% |
| Algeria | 1.80% |
| Ukraine | 1.95% |
| Armenia | 2.96% |
| Republic of Moldova | 3.15% |
| Jamaica | 3.24% |
An official zero should not be interpreted as “no secondary education.” It means that the private-institution share for this UIS indicator was reported as zero. The broader education system may contain institutional arrangements that require separate documentation. By contrast, a country absent from the reported rows has no value in this extract. Converting that absence to zero would collapse two different states—reported zero and no reported observation—into one number and would damage the integrity of the comparison.
The sorted profile reveals a long upper tail
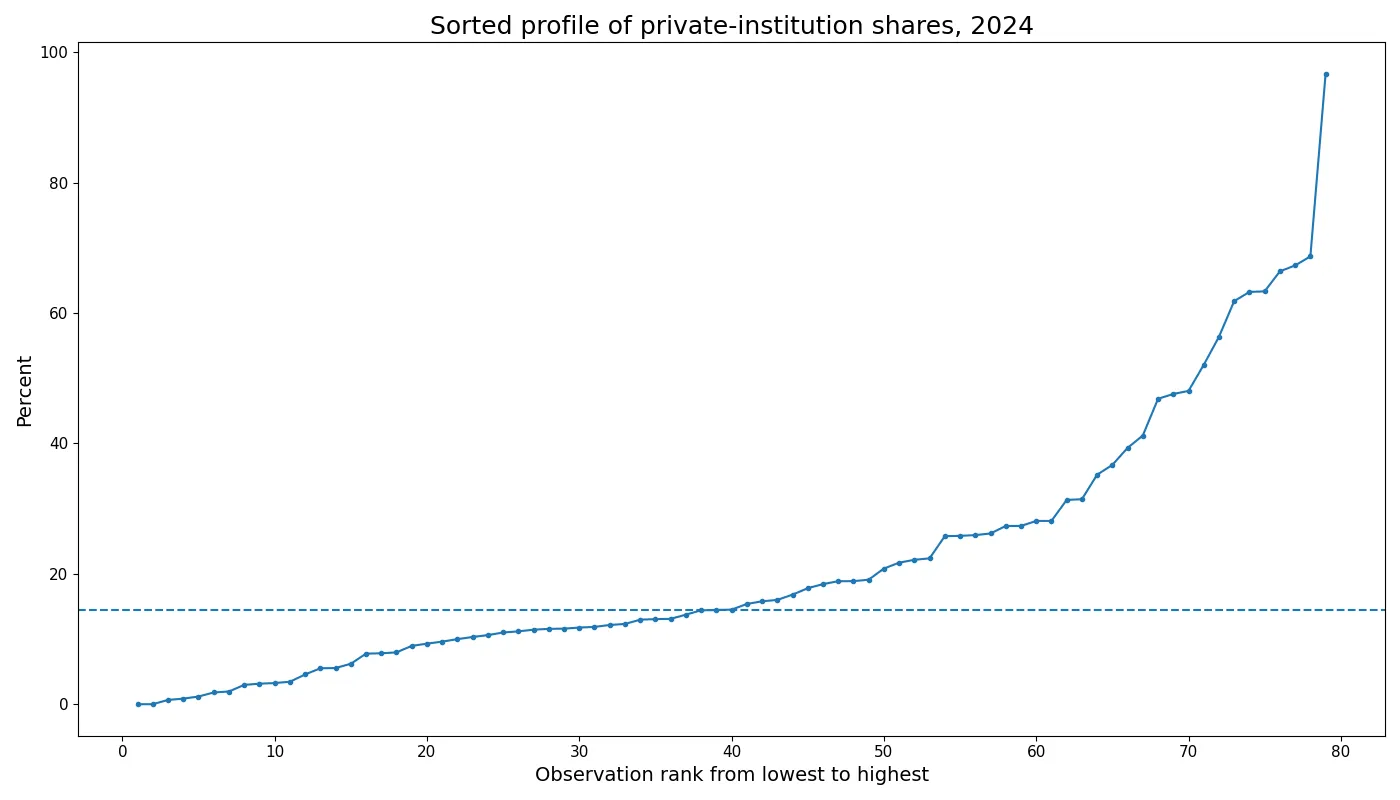
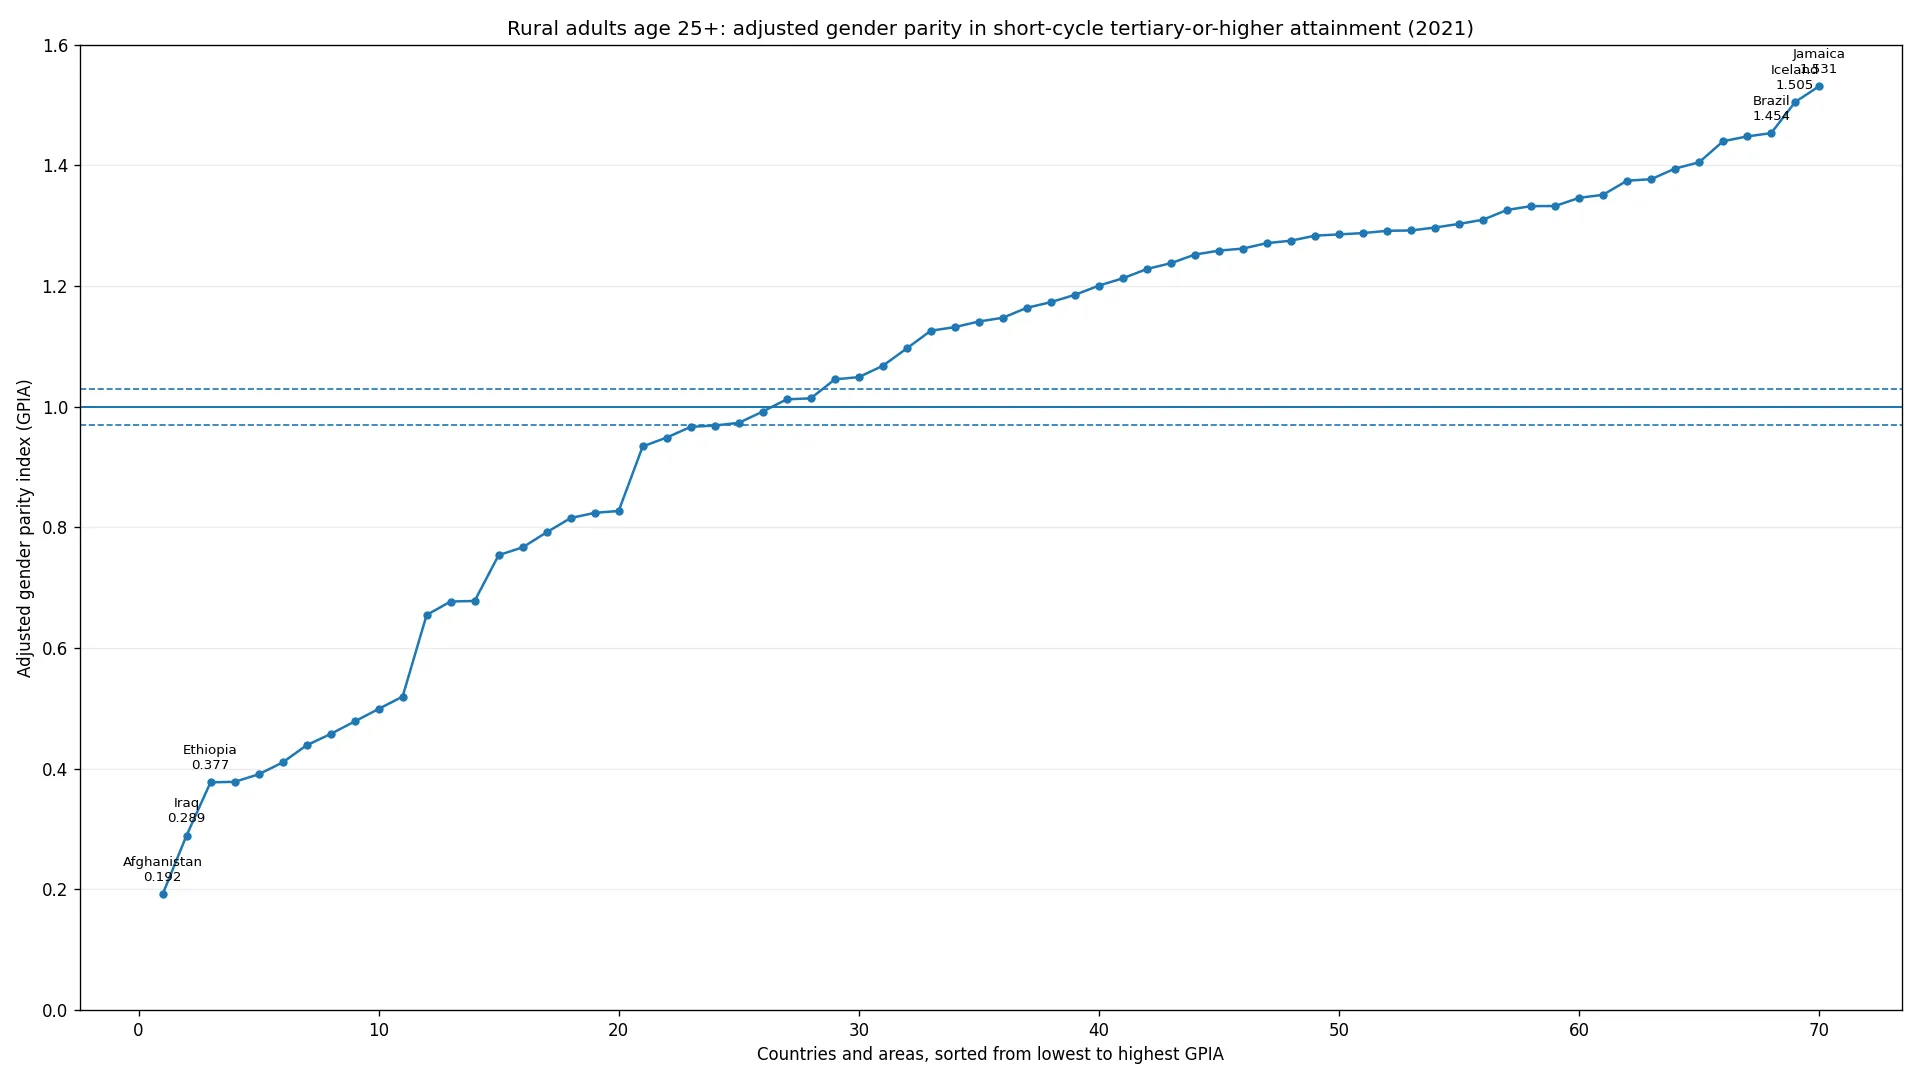
The sorted curve rises gradually through the low values and the dense middle of the dataset, then becomes noticeably steeper near the upper end. Only a minority of observations exceed 40%, and fewer still exceed 60%. The final point rises sharply relative to the second-highest value. This shape explains both the high mean-to-median gap and the usefulness of reporting quartiles. A full-range chart alone can make the center look compressed, while a median alone can hide the exceptional upper observations; the two views are complementary.
Rank differences around the middle should also be interpreted cautiously. Two countries separated by only one or two percentage points can occupy distinct positions in a sorted table, but the ranking itself does not tell us whether that numerical difference is educationally important. The source file contains the percentage, not uncertainty intervals, institutional context, or causal information. Ranks are therefore descriptive ordering tools, not assessments of performance or significance.
A percentage is not the same as a number of students
This indicator answers a structural question: what share of secondary enrolment is in private institutions? It does not answer how many students attend private schools. Percentages make countries of different sizes easier to compare on composition, but they remove scale. A relatively low share in a very large education system can correspond to a large absolute number of private-school students, while a high share in a small system can correspond to far fewer students.
A fuller comparison would pair ETOIP.2T3.PR with total secondary enrolment and, where available, the count of students enrolled in private institutions. That combination would allow analysts to distinguish institutional share from absolute scale. It would also make it possible to compute weighted regional or global shares. Without those denominators and numerators, an unweighted average of country percentages should not be presented as the percentage of the world’s students in private secondary education.
Institutional definitions matter in cross-country comparisons
Private education does not necessarily mean the same financing or governance model everywhere. Some private schools may receive substantial public funding; others may depend mostly on fees or private resources. Regulatory arrangements, ownership rules, religious or community institutions, and public-private partnerships can all affect how a system is organized. UIS provides standardized statistical concepts to support comparison, but the single percentage cannot capture every institutional detail behind the national figure.
That is especially important when an observation looks surprising. The correct next step is not to invent a causal story from the percentage itself, but to consult the relevant education-system documentation and metadata. The 2024 value is a measured outcome under a defined statistical series. Explaining the mechanisms behind it requires additional primary sources. Separating description from explanation keeps the article within what the data can actually support.
A one-year cross-section cannot establish a trend
The available data provide a fixed 2024 cross-section. They support statements about how the reported national values differ in that year, but they cannot show whether a country’s private share is rising or falling. A trend analysis would require multiple years of the same ETOIP.2T3.PR series with compatible definitions and coverage. Using a male-only, female-only, or upper-secondary-only series as a substitute for another year would mix different metrics and create a false time series.
For a consistent comparison, the same statistical definition should be used throughout: UNESCO UIS indicator ETOIP.2T3.PR, country-level observations, both sexes, percent, and reference year 2024. Similar UIS series for male, female, or upper-secondary-only enrolment measure different questions and should therefore be analysed separately rather than combined with these values.
What the 2024 data directly show
The strongest descriptive conclusion is that private-institution shares vary widely but are concentrated toward the lower end. The median is 14.50%, the middle half ranges from 9.44% to 27.72%, and the 10–20% band contains 27 of the 79 reported observations. At the same time, 7 observations reach 60% or higher and the maximum is 96.68%. Those two features—a dense low-to-middle cluster and a thin high tail—should be read together.
The indicator is useful for comparing the institutional composition of secondary enrolment, not for judging education systems. Keeping official zeros distinct from missing coverage, keeping percentages distinct from student counts, and keeping a one-year comparison distinct from a trend are the main safeguards. With those limits in place, the dataset provides a clear snapshot of how differently private institutions feature in reported secondary enrolment across countries and areas in 2024.
Frequently Asked Questions
What does ETOIP.2T3.PR measure?
It is the UNESCO UIS percentage of secondary education enrolment in private institutions for both sexes.
Should countries missing from the 79 rows be treated as zero?
No. Missing coverage must remain missing. The dataset separately contains two official zero observations.
Why is the mean higher than the median?
The mean is 21.98% and the median is 14.50%. A small group of high observations creates a long upper tail and raises the mean.
Does a higher percentage mean more private-school students?
Not necessarily. The percentage shows composition, while the absolute number also depends on the size of total secondary enrolment.
Related Articles
Green Map creates custom-edited map images using open geographic data sources such as geoBoundaries, Natural Earth, OpenStreetMap, and government open data. These maps are edited visual materials, not raw data files, and are provided for education, documents, presentations, and graphic reference.