The share of secondary students enrolled in private institutions can differ between female and male students, and the UNESCO Institute for Statistics summarizes that difference with an adjusted gender parity index. The 2024 ETOIP.2T3.PR.GPIA dataset contains 77 country and economy observations. The index is centered on 1: values near 1 mean that the private-institution share of secondary enrolment is similar for females and males. The median is 0.97807 and the mean is 0.97721.
This is an index, not a percentage. The ordinary gender parity index divides the female value of an indicator by the male value. The adjusted GPI, or GPIA, changes the calculation when the female value exceeds the male value so that disparities can be read more symmetrically around 1. When the female value is less than or equal to the male value, the adjusted index is the female-to-male ratio. When the female value is greater, the adjusted value is calculated as 2 minus the male-to-female ratio.
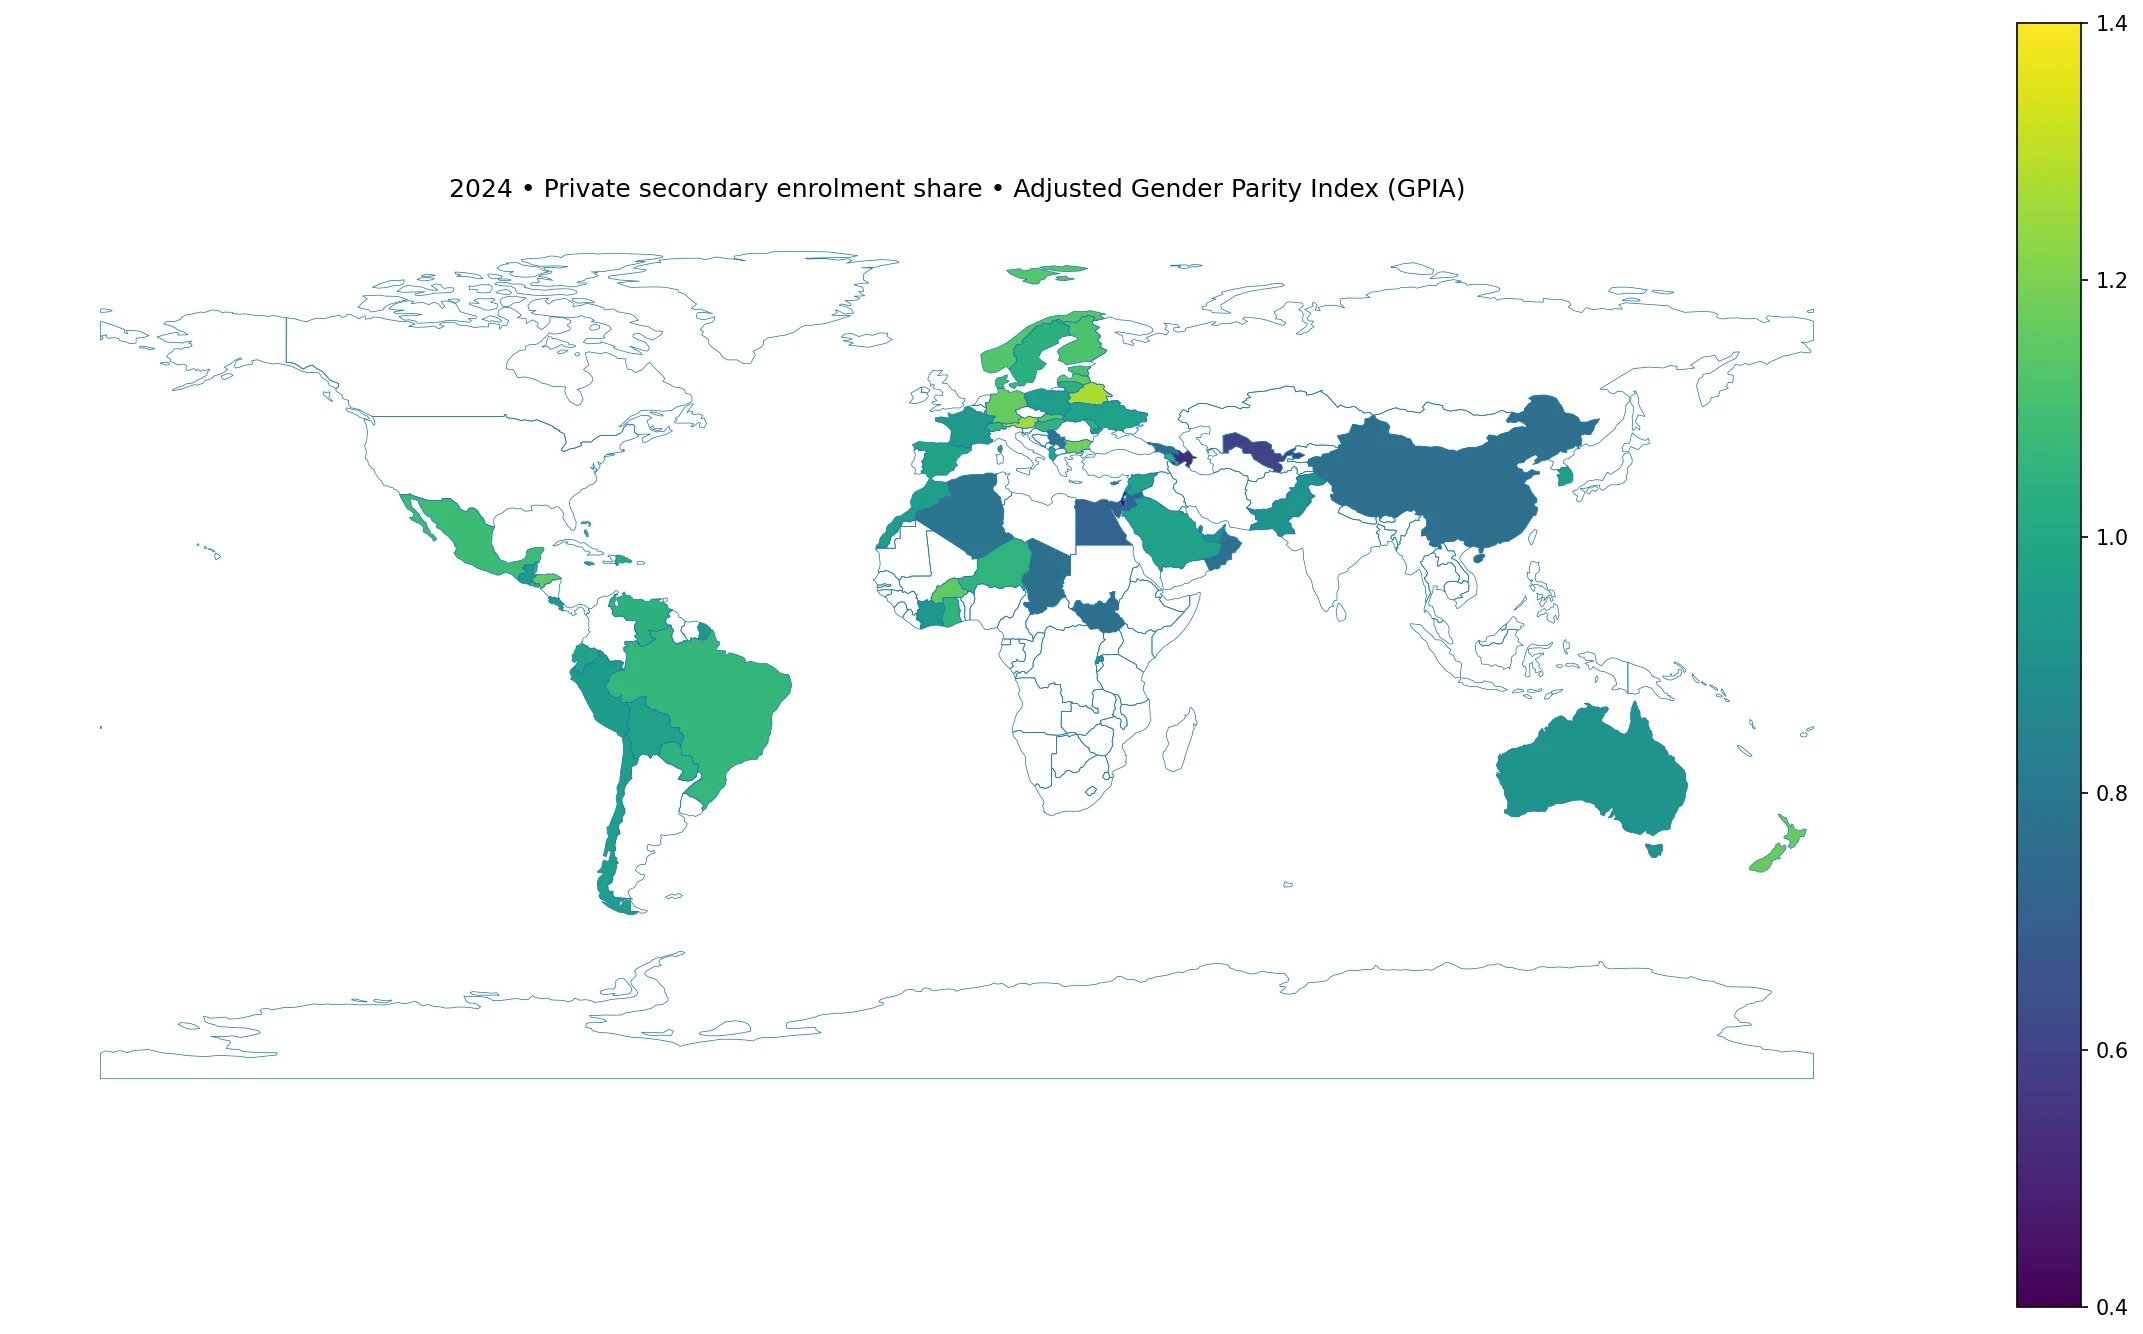
Table of Contents
Values near 1 indicate a similar private-enrolment share by sex
UNESCO commonly treats values from 0.97 to 1.03 as the range associated with gender parity. Thirteen of the 77 observations fall inside that interval. Thirty-four are below 0.97 and 30 are above 1.03. The strict parity band is narrow, however, so it is also useful to look at distance from 1. Twenty-six countries are within 0.05 of 1, and 47 are within 0.10.
A value below 0.97 means the percentage of female secondary students enrolled in private institutions is lower than the corresponding percentage for male students. A value above 1.03 means the female private-institution share is higher. Those directions should not be translated into ‘advantage’ and ‘disadvantage’ without more context, because a larger private-school share is not inherently a better educational outcome. The index describes the gender composition of provider type.
The 2024 distribution is centered just below 1
The observed range runs from 0.44971 to 1.38436. The first quartile is 0.91619 and the third quartile is 1.06186, so the middle half of observations lies roughly between 0.916 and 1.062. The median of 0.97807 and mean of 0.97721 are close to each other and only slightly below 1, indicating that the overall set is centered near parity even though individual countries can be far away from it.
Thirty observations are more than 0.10 away from 1, and 16 are more than 0.20 away. Only four are more than 0.30 from the parity point: Israel, Azerbaijan, Uzbekistan and Barbados. These are unusually large differences within the observed dataset, but the indicator does not identify the institutional, demographic or financial mechanisms behind them.
Countries where the female private-enrolment share is much lower
| Country or economy | 2024 GPIA |
|---|---|
| Israel | 0.44971 |
| Azerbaijan | 0.51109 |
| Uzbekistan | 0.59543 |
| Egypt | 0.71526 |
| Jordan | 0.72845 |
| China | 0.76242 |
| Chad | 0.76786 |
| South Sudan | 0.77033 |
| Georgia | 0.77405 |
| Serbia | 0.77652 |
Israel has the lowest adjusted index at 0.44971, followed by Azerbaijan at 0.51109 and Uzbekistan at 0.59543. In this below-1 portion of the scale, the adjusted index is the same as the ordinary female-to-male ratio. A value of 0.44971 therefore means the female private-institution share is about 45% of the male share, while 0.51109 corresponds to about 51%. The denominator here is not the number of boys; it is the private-institution percentage calculated separately within each sex.
Egypt is at 0.71526, Jordan at 0.72845, China at 0.76242, Chad at 0.76786, South Sudan at 0.77033, Georgia at 0.77405 and Serbia at 0.77652. These values show sizeable differences in the same direction. The dataset does not establish why. Possible explanations could involve the distribution of public and private schools, vocational tracks, household resources, urban concentration or institutional rules, but those factors require separate evidence.
Countries where the female private-enrolment share is much higher
| Country or economy | 2024 GPIA |
|---|---|
| Barbados | 1.38436 |
| Belarus | 1.27319 |
| Austria | 1.26718 |
| Luxembourg | 1.21078 |
| Bulgaria | 1.18597 |
| Seychelles | 1.17398 |
| New Zealand | 1.16859 |
| Germany | 1.16292 |
| Honduras | 1.15678 |
| Burkina Faso | 1.15482 |
Barbados has the highest adjusted index at 1.38436. Belarus follows at 1.27319, Austria at 1.26718, Luxembourg at 1.21078 and Bulgaria at 1.18597. Seychelles, New Zealand, Germany, Honduras and Burkina Faso also have values above 1.15. In these countries, the private-institution share of female secondary enrolment is higher than the corresponding male share.
Values above 1 should not be read as simple percentages. An adjusted GPIA of 1.20 does not mean the female share is 20% higher than the male share. The adjustment transforms ratios above 1 in order to make the scale more symmetric around parity. For cross-country comparison, the safer reading is direction plus distance from 1 rather than a direct percent difference.
Countries closest to parity
| Country or economy | 2024 GPIA |
|---|---|
| Albania | 0.99559 |
| Dominican Republic | 1.00680 |
| Monaco | 1.00816 |
| Belize | 1.01024 |
| Lebanon | 0.98531 |
| Ecuador | 0.98309 |
| Spain | 0.98241 |
| Ukraine | 0.97807 |
| Syrian Arab Republic | 0.97563 |
| Saudi Arabia | 0.97520 |
Albania at 0.99559, the Dominican Republic at 1.00680, Monaco at 1.00816 and Belize at 1.01024 are especially close to 1. Lebanon, Ecuador, Spain and Ukraine are also near the center. These figures indicate similarity between female and male private-institution shares, but they reveal nothing about whether private secondary education is common or rare overall.
Two countries could both have a GPIA close to 1 while having completely different education structures. If 5% of female and male secondary students attend private institutions in one country, and 60% of both sexes do so in another, both may have near-parity indices. The underlying private-enrolment percentages therefore remain essential context.
Regional medians point in different directions
Among the countries observed in 2024, Europe’s median is about 1.064, North America’s about 1.020 and South America’s about 0.983. Africa’s median is about 0.937 and Asia’s about 0.901. Oceania has very few observations in this dataset, so its median is not a robust summary of the whole region.
These are simple descriptive medians of the countries with data, not official population-weighted regional estimates. Coverage also differs by region. A regional median above or below 1 therefore should not be generalized to every country or student in that region. It is more useful as a clue about the spatial pattern among observed countries.
Gender parity is narrower than gender equality
A GPIA close to 1 means that female and male values are similar for this specific indicator. It does not demonstrate gender equality across education. Access, completion, learning, field of study, school safety, household cost and progression can still differ substantially. Likewise, a GPIA far from 1 does not prove that one sex is disadvantaged across the education system as a whole.
The underlying indicator is the percentage of secondary enrolment in private institutions. A larger private share is not intrinsically desirable or undesirable. Some private schools are heavily subsidized by government, while others rely primarily on household fees. Public and private providers can also differ in geography, selectivity and programme type. The adjusted index should therefore be treated as a measure of provider-pattern parity rather than a quality score.
Why countries can show different gender patterns
Several mechanisms could create a gap without implying a single universal cause. Private schools may be concentrated in cities where the gender composition of enrolment differs from rural areas. Vocational and general secondary tracks can have different provider mixes and different gender participation. Religious or nonprofit networks may serve particular populations. Household decisions about fees can also differ by sex in some settings.
The index itself does not test any of those explanations. It is most useful as a screening measure: countries close to 1 have similar private-school shares by sex, while countries far from 1 deserve a closer look at the underlying female and male percentages and at national education-system details.
Important limitations for country comparisons
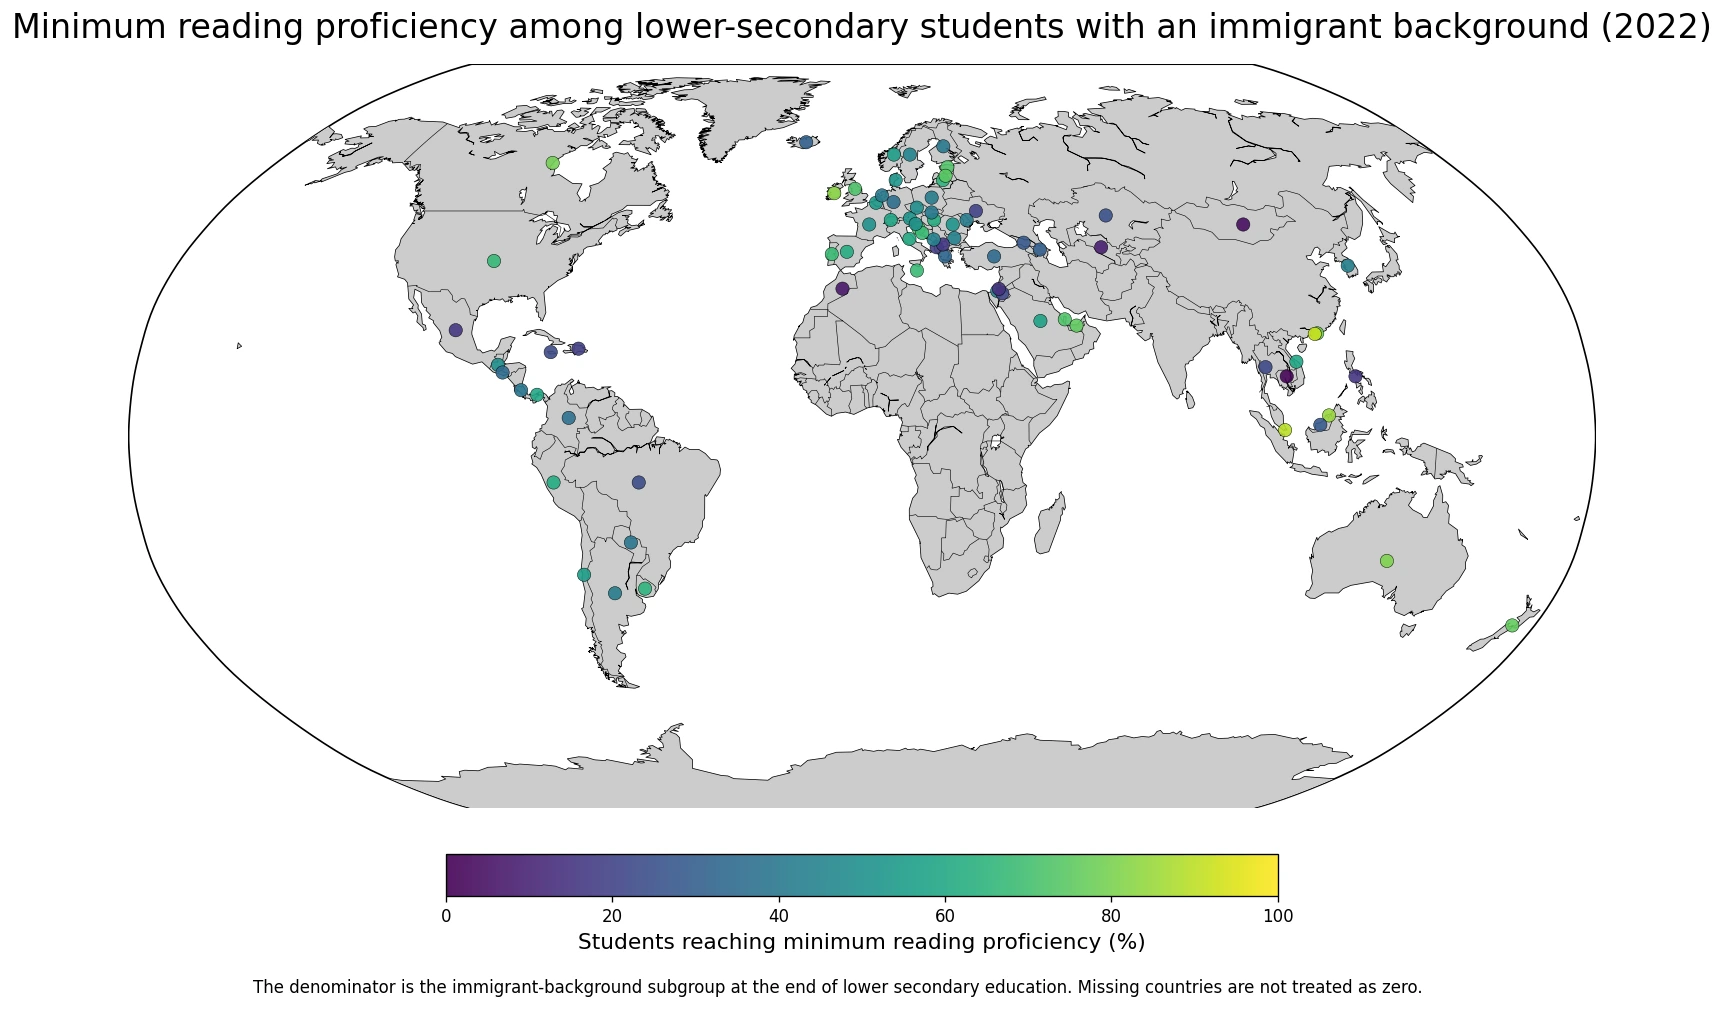
First, the 2024 dataset contains 77 observed countries and economies rather than full global coverage. Missing countries are not converted to zero or one. Second, the low-resolution world map directly matches 66 observations. Small states and territories including Andorra, Bahrain, Barbados, the Cook Islands, the Cayman Islands, Gibraltar, Hong Kong, Macao, Monaco, Mauritius and Seychelles may not have a separate matching polygon, although their numeric observations remain in all tables and calculations.
Third, the index compares percentages, not student counts. It does not say whether there are more female or male students in secondary education. Fourth, one year is a snapshot. A multi-year series would be needed to determine whether a gender gap is widening, narrowing or simply fluctuating from year to year.
Indicators that provide the missing context
The most important companion data are the female and male percentages of secondary enrolment in private institutions themselves. They show whether a near-parity result comes from both sexes having a low private share, both having a high share, or both sitting somewhere in the middle. Secondary gross and net enrolment ratios then show whether the gender pattern concerns provider choice or broader participation in secondary education.
Completion rates, out-of-school rates and educational attainment help connect provider patterns to progression and outcomes. Finance data are also useful because institutional ownership and funding are not the same thing. Public transfers to private schools, household education spending and government expenditure can reveal whether a large private sector is still substantially supported by public resources.
Data source and calculation method
The source is UNESCO Institute for Statistics indicator ETOIP.2T3.PR.GPIA, Percentage of enrolment in secondary education in private institutions, adjusted gender parity index (GPIA), for 2024. The dataset contains 77 national or territorial observations. The mean, median, quartiles, parity-band counts and country tables are calculated directly from those observations. Missing catalogue units are preserved as missing and are not filled with artificial values.
The adjusted gender parity index is interpreted around 1. When the female indicator value is less than or equal to the male value, GPIA equals the female-to-male ratio. When the female value is higher, the index is calculated as 2 minus the male-to-female ratio. This adjustment makes disparities on either side of 1 more comparable and keeps the focus on direction and distance from parity.
Frequently Asked Questions
What does a GPIA of 1 mean?
It means the female and male percentages of secondary enrolment in private institutions are equal. UNESCO commonly treats 0.97 to 1.03 as the parity range.
Does a GPIA of 1.20 mean the female share is 20% higher?
No. Values above 1 are transformed by the adjusted-index formula, so they are not direct percentage differences. Read the direction and distance from 1 instead.
Does a GPIA near 1 mean private schooling is uncommon?
No. It only means the female and male private-enrolment shares are similar. Both shares could be low, medium or high.
Related Articles
Green Map creates custom-edited map images using open geographic data sources such as geoBoundaries, Natural Earth, OpenStreetMap, and government open data. These maps are edited visual materials, not raw data files, and are provided for education, documents, presentations, and graphic reference.