Government purchases of goods and services make up very different shares of total government expense across reporting economies. In the World Bank’s 2022 GC.XPN.GSRV.ZS series, 109 countries and economies have a numeric observation. The reported range runs from 2.13% to 43.86%, with a median of 12.65% and a mean of 15.22%. The mean sits above the median because a small number of observations in the 30% to 40% range pull the distribution upward.
The indicator is Goods and services expense (% of expense). It covers government payments in exchange for goods and services used in producing market and nonmarket goods and services, while use of goods and services for own-account capital formation is excluded. The denominator, expense, follows a government-finance concept tied to transactions that reduce net worth. It should therefore not be treated as a synonym for every form of public spending, especially capital acquisition.
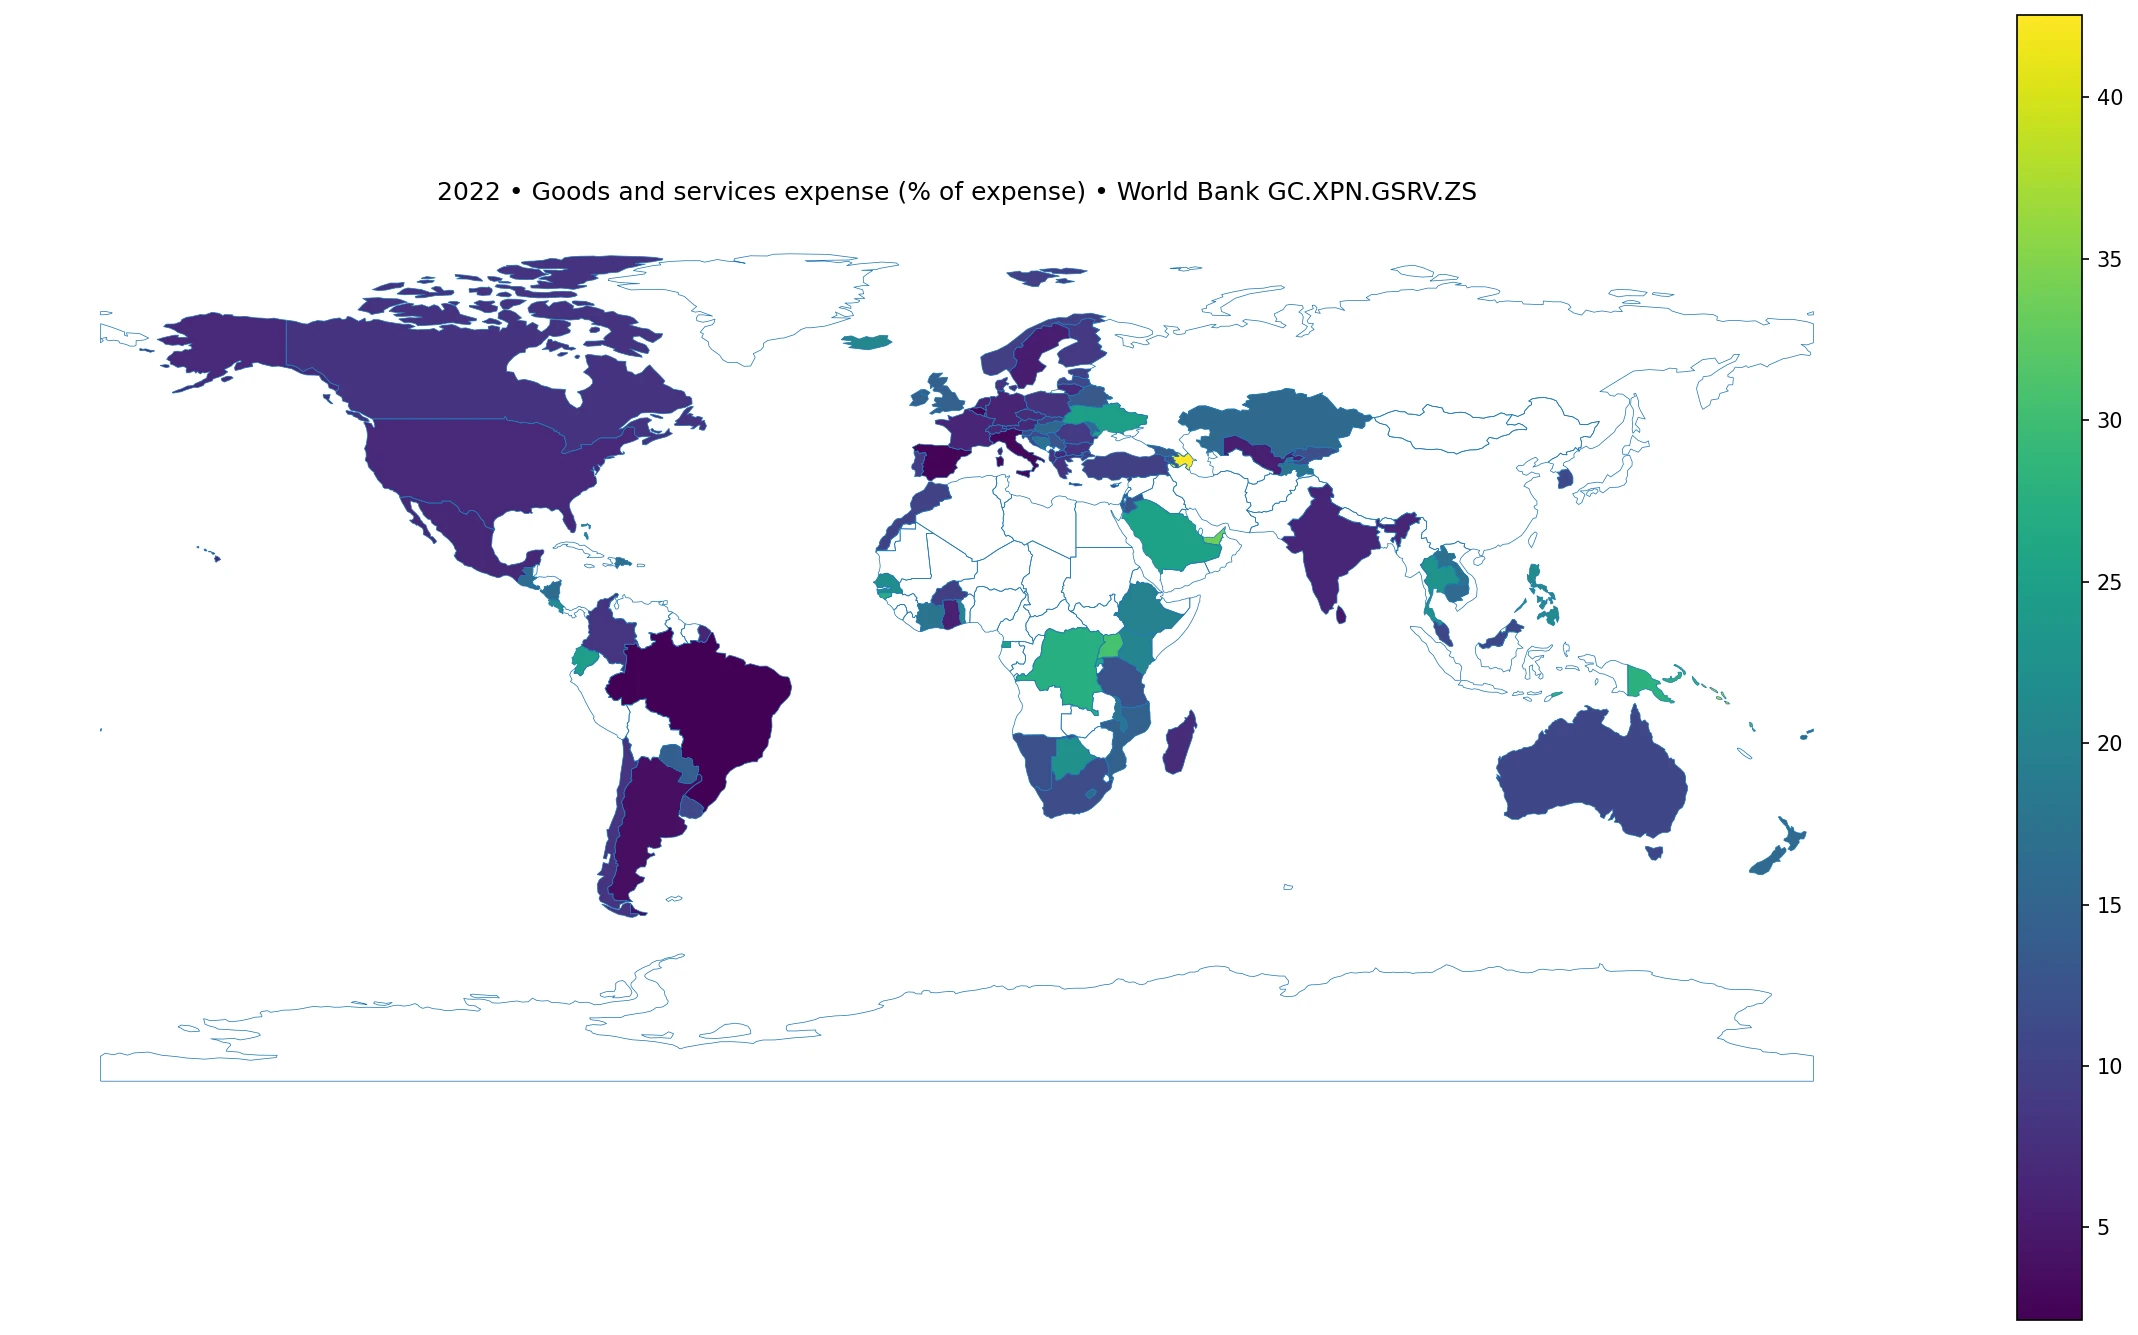
Table of Contents
What the percentage actually measures
A value of 20% means that goods and services account for about one fifth of the expense recorded under this government-finance framework. The category can include non-wage inputs that public institutions purchase in order to operate and provide services. Other major expense categories, such as compensation of employees, social benefits, grants, interest and transfers, are outside this indicator’s numerator.
That distinction matters for cross-country interpretation. A low goods-and-services share does not mean that a government provides few public services. A government may deliver services mainly through employees, social transfers or other expense categories. Conversely, a high share does not establish that a government outsources more activity or operates more efficiently. Those explanations would require additional budget and institutional data that are not present in this series.
Most observations cluster in the low teens
The first quartile is 8.17%, the median is 12.65%, and the third quartile is 20.55%. Half of the reported observations therefore fall between roughly 8.17% and 20.55%. Thirty-nine economies are below 10%, another 41 are from 10% to below 20%, and 29 are at 20% or more. Only eight observations reach 30% or more, and just three exceed 40%.
This shape is important because a single global average can hide the long upper tail. The average of 15.22% is several percentage points above the median. For a descriptive comparison, the median and interquartile range are more representative of the center, while the top and bottom tables identify the unusual cases that merit closer investigation.
Highest reported shares in 2022
| Country or economy | Share of expense |
|---|---|
| Tonga | 43.86% |
| Samoa | 43.17% |
| Azerbaijan | 42.55% |
| Solomon Islands | 38.50% |
| United Arab Emirates | 33.65% |
| Singapore | 32.02% |
| San Marino | 31.67% |
| Uganda | 30.67% |
| Vanuatu | 29.30% |
| Timor-Leste | 28.29% |
Tonga has the highest reported value at 43.86%, followed closely by Samoa at 43.17% and Azerbaijan at 42.55%. Solomon Islands is at 38.50%, the United Arab Emirates at 33.65%, Singapore at 32.02%, San Marino at 31.67%, Uganda at 30.67%, Vanuatu at 29.30%, and Timor-Leste at 28.29%. The group spans very small island economies as well as larger countries in Asia and Africa.
The ranking describes budget composition, not performance. A high position means that purchases of goods and services form a relatively large part of recorded expense. It does not show whether procurement is costly, efficient, necessary or wasteful. Those judgments would require information on unit prices, service outputs, staffing, procurement rules and the composition of the remaining expense categories.
Lowest reported shares in 2022
| Country or economy | Share of expense |
|---|---|
| Brazil | 2.13% |
| Spain | 2.57% |
| Belgium | 2.85% |
| Italy | 2.91% |
| Argentina | 3.57% |
| Sri Lanka | 4.79% |
| Sweden | 5.42% |
| Uzbekistan | 5.57% |
| Ghana | 5.69% |
| Netherlands | 6.17% |
Brazil is the lowest reported observation at 2.13%, followed by Spain at 2.57%, Belgium at 2.85%, Italy at 2.91% and Argentina at 3.57%. Sri Lanka is at 4.79%, Sweden at 5.42%, Uzbekistan at 5.57%, Ghana at 5.69%, and the Netherlands at 6.17%. These values indicate that other expense components dominate the denominator; they do not imply that government purchases or public-service activity are small in absolute monetary terms.
Regional patterns are visible, but exceptions are large
Among the reporting economies in this dataset, the median is highest in Oceania at 27.90%. The corresponding medians are 17.80% in Africa, 16.11% in North America, 14.71% in Asia, 8.87% in Europe, and 8.40% in South America. These summaries are descriptive of the economies with a 2022 observation. They should not be read as complete regional estimates because reporting coverage differs and many economies have no value for the year.
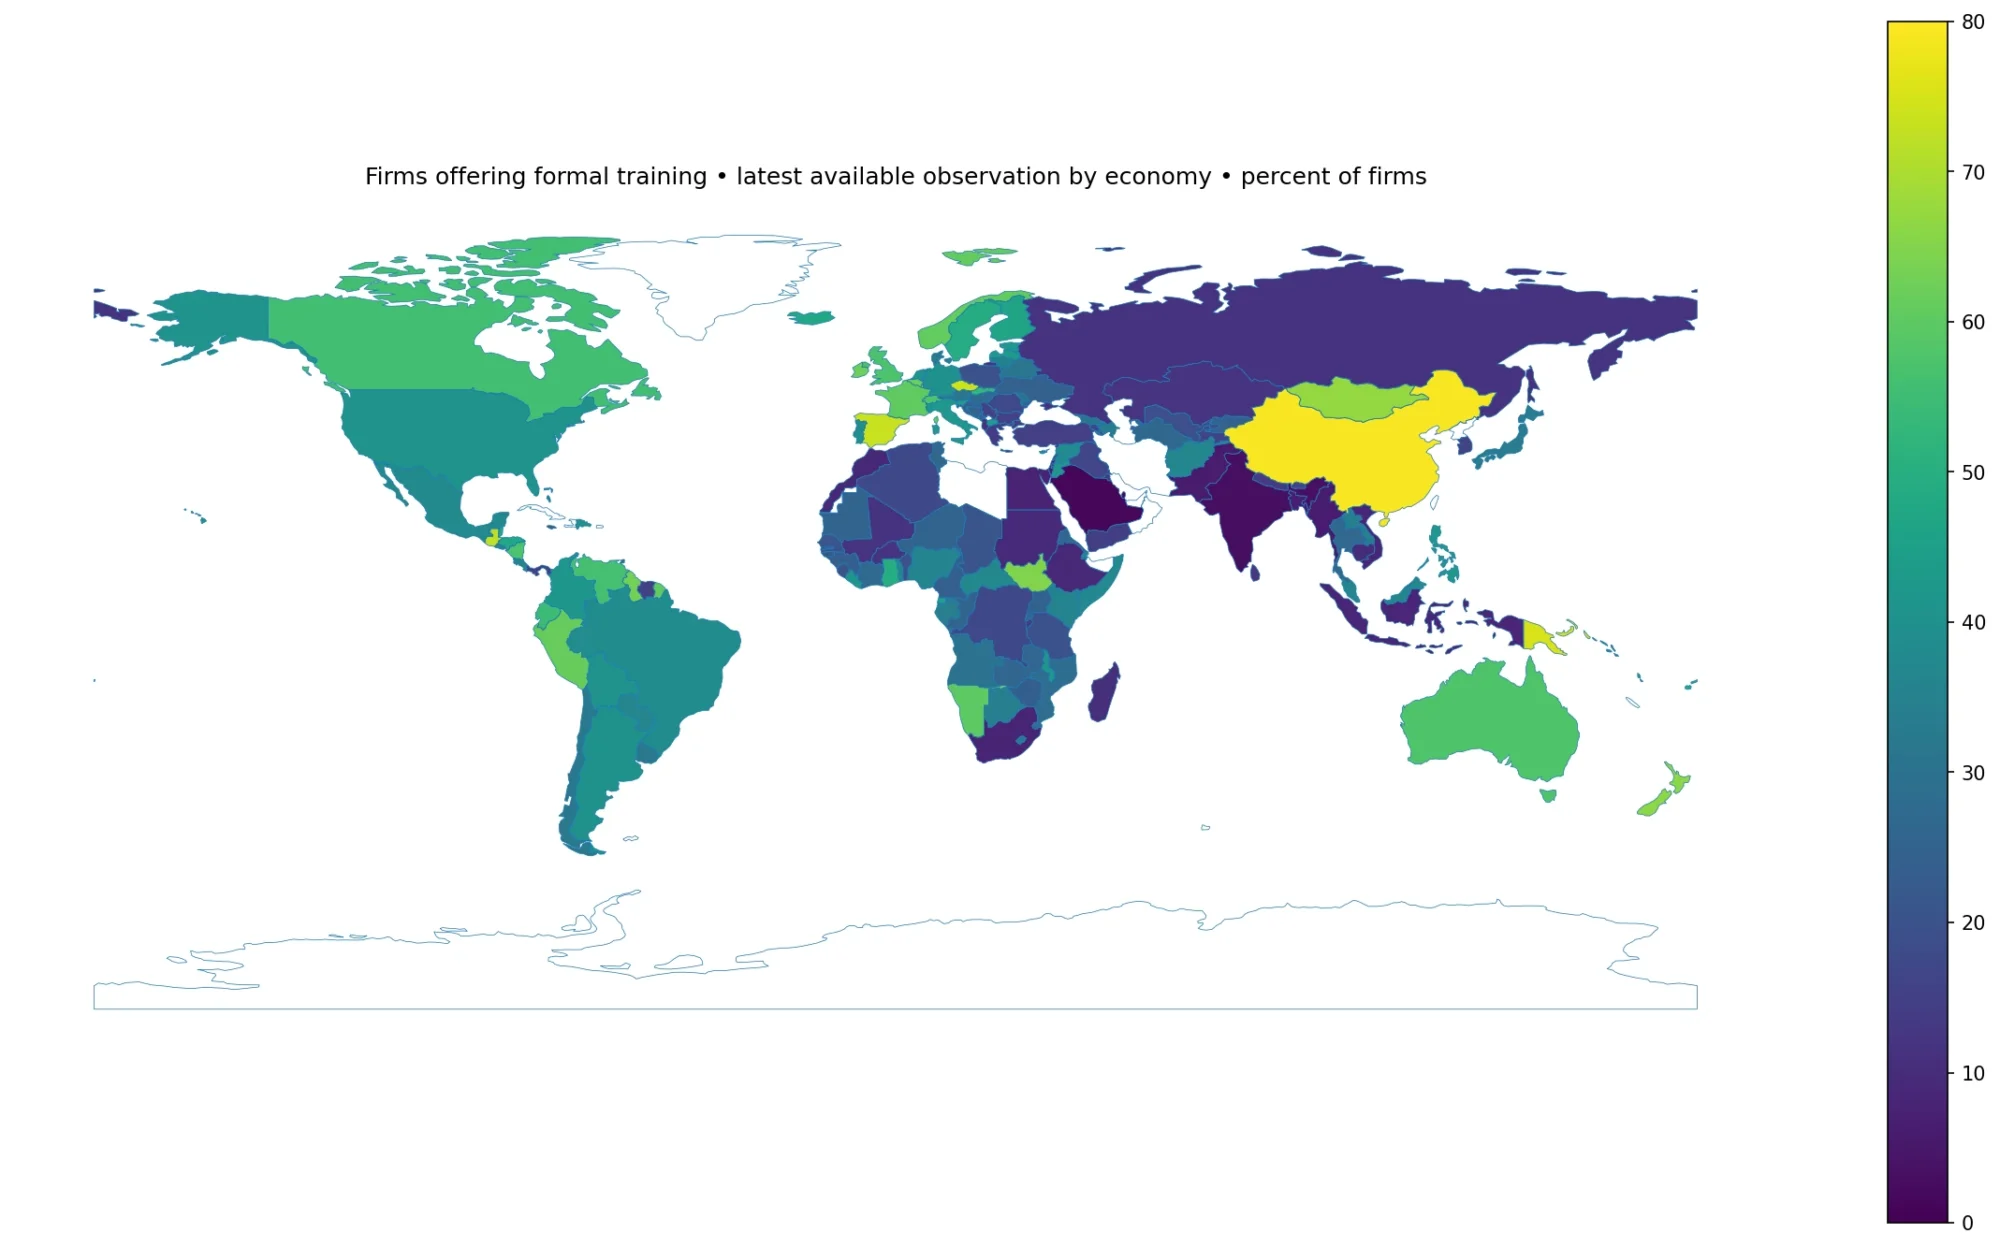
Neighboring countries can differ sharply. Spain is at 2.57% and Italy at 2.91%, while Portugal is higher at 9.13%. Azerbaijan stands at 42.55%, compared with 12.04% in Armenia and 13.61% in Georgia. In East Africa, Uganda is at 30.67%, Rwanda at 26.47%, Kenya at 20.44%, and Tanzania at 12.28%. The map therefore shows both broad clusters and substantial within-region variation.
Oceania also illustrates the role of small-state outliers. Tonga and Samoa exceed 43%, Solomon Islands reaches 38.50%, Vanuatu 29.30%, and Papua New Guinea 27.90%, while Fiji is lower at 16.41%. Some of these small states are not visible as separate polygons in a low-resolution world map, which is why the ranking table remains important even when the map is the primary visual.
What the indicator cannot tell you
The series is a share, not a measure of the monetary amount spent. A 5% share in a very large government budget can represent more money than a 30% share in a small budget. It also does not show which goods or services were purchased, which agencies made the purchases, whether procurement was domestic or imported, or whether the spending produced better public outcomes.
The indicator should not be used as a stand-alone score of fiscal quality, government size or administrative efficiency. Differences may reflect the balance between wages, transfers, interest, subsidies, grants and purchased inputs; they may also reflect institutional arrangements and accounting classifications. A fuller fiscal comparison would pair this series with compensation of employees, social benefits, interest, grants, total revenue and measures relative to GDP.
Coverage, missing values and mapping method
The source file contains 217 country and economy rows for 2022. Of those, 109 have a reported value and 108 are source-missing. Missing values are preserved as missing rather than converted to zero. All summary statistics, quantiles and rankings in this article use only the 109 observed values. The minimum is 2.13%, the maximum 43.86%, and the interquartile range runs from 8.17% to 20.55%.
For the map, ISO3 codes were joined to a low-resolution world boundary layer. One hundred and one reported observations match directly to polygons. Eight reported economies—Kiribati, Macao SAR China, Malta, Mauritius, Singapore, San Marino, Tonga and Samoa—are not represented as matching polygons in that boundary file. Their values remain fully included in the tables and distribution statistics.
The result is best read in two layers. The map shows where higher and lower shares are geographically concentrated, while the tables preserve the exact values for economies that may be too small to appear at this map scale. Because all comparisons use the same 2022 World Bank indicator and the same percent-of-expense unit, the visual and numerical sections are internally consistent.
Frequently Asked Questions
Does a higher goods-and-services share mean a government is more efficient?
No. The indicator describes the composition of expense, not efficiency. Assessing efficiency requires information about prices, staffing, procurement, service outputs and other expense categories.
Are missing 2022 values treated as zero?
No. The source contains 108 missing economy rows for 2022, and they remain missing. Zero would be a different factual value.
Can this percentage be used to compare the amount of money governments spend?
Not by itself. It is a share of expense, so absolute spending can be larger in a country with a lower percentage if its overall budget is much larger.
Related Articles
Green Map creates custom-edited map images using open geographic data sources such as geoBoundaries, Natural Earth, OpenStreetMap, and government open data. These maps are edited visual materials, not raw data files, and are provided for education, documents, presentations, and graphic reference.