EIA operational data for 2024 show a strongly concentrated state pattern in renewable fuel consumption for the IPP Non-CHP sector. California records 29,660.891 thousand physical units, followed by Michigan at 18,156.069, New York at 14,372.678, Pennsylvania at 12,462.311 and Virginia at 10,701.551. The 50 states and the District of Columbia sum to 167,432.194 in the reported unit.
California represents 17.72% of that 51-observation total, Michigan 10.84% and New York 8.58%. The top five account for 50.98% and the top ten for 73.00%. The mean is 3,282.984, much higher than the median of 1,069.029, because the leading states form a long upper tail.
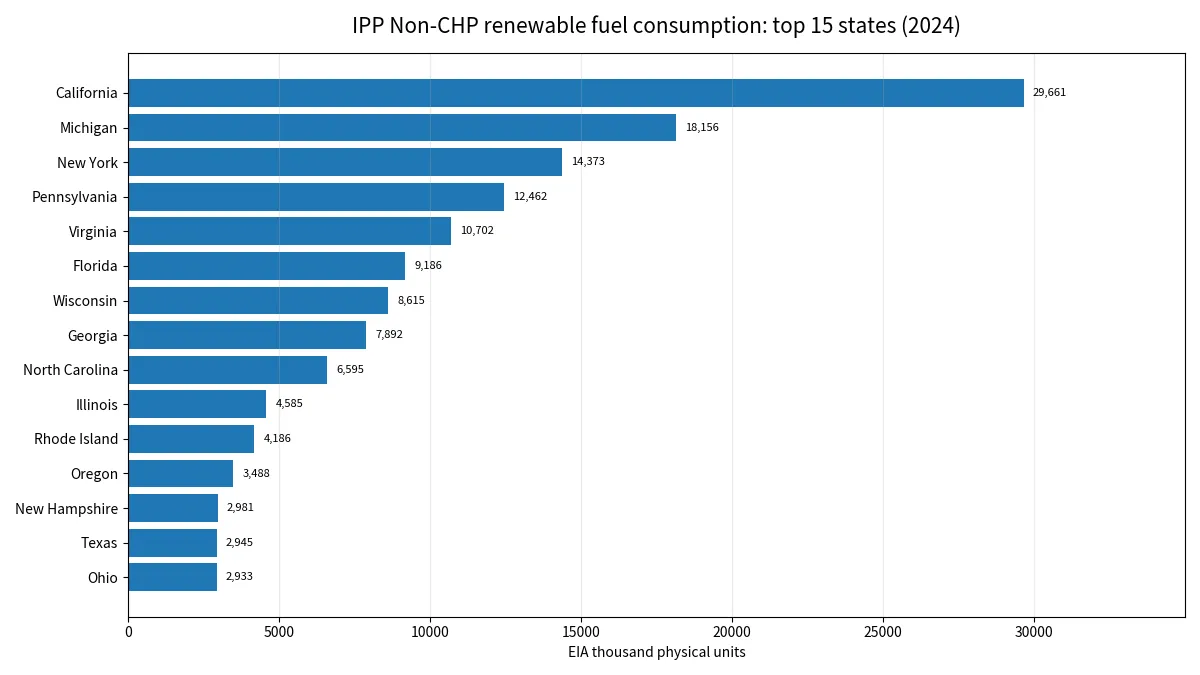
Table of Contents
The exact EIA identity defines the comparison
This article uses the `total-consumption` field from EIA’s electricity/electric-power-operational-data route. The renewable fuel facet is `REN`, the sector facet is `2` for IPP Non-CHP, frequency is annual and the reference year is 2024. Changing any one of these dimensions produces a different series.
The published unit is `thousand physical units`. The values are not converted to MWh, Btu, generation or electricity sales. They are compared in the unit EIA provides for this slice. Analyses of heat content, useful thermal output or net generation require those separate fields and should not be substituted for this one.
California is the largest observation
California’s 29,660.891 accounts for 17.72% of the summed state values. Michigan contributes 18,156.069, or 10.84%, and New York contributes 14,372.678, or 8.58%. Pennsylvania records 12,462.311 and Virginia 10,701.551.
The top five states total 85,353.500, equal to 50.98% of all 51 observations. The top ten reach 122,227.409, or 73.00%. This indicates a concentrated distribution, but the aggregate table does not show which renewable fuel subtypes or individual facilities create that pattern.
The next high group spans several U.S. regions
Florida records 9,186.322, Wisconsin 8,615.373, Georgia 7,892.044, North Carolina 6,595.316 and Illinois 4,584.854. These states complete the top ten.
The upper group spans the West, Midwest, Northeast and South. The spatial spread shows that high values are not restricted to one geographic cluster. Explaining the differences, however, would require plant-level capacity, fuel composition and producer information beyond this state aggregate.
The median is a better guide to a typical state than the mean
The mean across 51 observations is 3,282.984, compared with a median of 1,069.029. The first quartile is 387.430 and the third quartile 2,962.881. California and Michigan are large enough to pull the arithmetic average far above the centre of the distribution.
The maximum is about 27.7 times the median. A single national average therefore understates how uneven the distribution is. The combination of median, quartiles and top-state shares provides a clearer description.
Small states can still rank high
Rhode Island is 11th at 4,186.412. Oregon records 3,487.505, New Hampshire 2,980.817, Texas 2,944.945, Ohio 2,933.285 and Massachusetts 2,916.131. Population or land area does not mechanically determine the value.
This is an absolute physical-unit consumption measure for one operational slice, not a per-capita measure and not a rate per unit of generation. Differences can reflect the presence and fuel use of IPP Non-CHP facilities, but that explanation cannot be quantified from this table alone.
Seven jurisdictions have official zero values
Alaska, the District of Columbia, Montana, North Dakota, Nebraska, South Dakota and Wyoming are reported at 0.000. These are 7 official zero observations; the other 44 jurisdictions are above zero. There are no missing rows in the 51-observation state set.
A zero applies only to this exact 2024 EIA combination. It does not indicate the absence of renewable energy activity in the state. Other producer sectors, CHP facilities, fuel categories or output fields can show renewable activity.
Fuel consumption is different from generation and output
The `total-consumption` field is a fuel-consumption measure. EIA’s operational data also include fields for concepts such as generation, heat content and useful thermal output. A state with higher fuel consumption does not necessarily produce electricity in the same proportion.
The `REN` facet is an aggregate renewable fuel category. No attempt is made here to infer the underlying mix. Determining whether a specific renewable fuel drives a state’s value requires a more detailed fuel facet.
Shares of the 51-state total are descriptive, not market shares
Using the sum of 167,432.194, California’s contribution is 17.72%, Michigan’s 10.84%, New York’s 8.58%, Pennsylvania’s 7.44% and Virginia’s 6.39%. These shares help describe concentration within the exact EIA slice.
They should not be described as shares of U.S. renewable generation, total renewable energy consumption or national electricity output. The denominator includes only the 51 observations under the same field, renewable facet, sector and year.
All 51 state and jurisdiction observations
The table lists all 50 states plus the District of Columbia under the same 2024 EIA dimensions. The share column is calculated against the simple sum of the 51 reported values, while the physical-unit observations are kept unchanged.
| Rank | State or jurisdiction | Thousand physical units | Share of 51-observation total |
|---|---|---|---|
| 1 | California | 29,660.891 | 17.72% |
| 2 | Michigan | 18,156.069 | 10.84% |
| 3 | New York | 14,372.678 | 8.58% |
| 4 | Pennsylvania | 12,462.311 | 7.44% |
| 5 | Virginia | 10,701.551 | 6.39% |
| 6 | Florida | 9,186.322 | 5.49% |
| 7 | Wisconsin | 8,615.373 | 5.15% |
| 8 | Georgia | 7,892.044 | 4.71% |
| 9 | North Carolina | 6,595.316 | 3.94% |
| 10 | Illinois | 4,584.854 | 2.74% |
| 11 | Rhode Island | 4,186.412 | 2.50% |
| 12 | Oregon | 3,487.505 | 2.08% |
| 13 | New Hampshire | 2,980.817 | 1.78% |
| 14 | Texas | 2,944.945 | 1.76% |
| 15 | Ohio | 2,933.285 | 1.75% |
| 16 | Massachusetts | 2,916.131 | 1.74% |
| 17 | New Jersey | 2,668.268 | 1.59% |
| 18 | Iowa | 2,241.674 | 1.34% |
| 19 | Nevada | 1,713.557 | 1.02% |
| 20 | Tennessee | 1,685.788 | 1.01% |
| 21 | Maryland | 1,673.238 | 1.00% |
| 22 | Maine | 1,506.918 | 0.90% |
| 23 | Utah | 1,392.284 | 0.83% |
| 24 | Connecticut | 1,257.628 | 0.75% |
| 25 | Kansas | 1,200.300 | 0.72% |
| 26 | Indiana | 1,069.029 | 0.64% |
| 27 | Colorado | 1,033.557 | 0.62% |
| 28 | Washington | 965.351 | 0.58% |
| 29 | Alabama | 943.497 | 0.56% |
| 30 | Minnesota | 721.929 | 0.43% |
| 31 | Missouri | 712.619 | 0.43% |
| 32 | Idaho | 678.986 | 0.41% |
| 33 | Arkansas | 625.137 | 0.37% |
| 34 | Delaware | 616.752 | 0.37% |
| 35 | Arizona | 594.779 | 0.36% |
| 36 | Oklahoma | 528.309 | 0.32% |
| 37 | South Carolina | 462.436 | 0.28% |
| 38 | New Mexico | 416.874 | 0.25% |
| 39 | Kentucky | 357.986 | 0.21% |
| 40 | Vermont | 251.502 | 0.15% |
| 41 | Mississippi | 143.726 | 0.09% |
| 42 | Louisiana | 104.983 | 0.06% |
| 43 | Hawaii | 100.076 | 0.06% |
| 44 | West Virginia | 88.507 | 0.05% |
| 45 | Alaska | 0.000 | 0.00% |
| 46 | District of Columbia | 0.000 | 0.00% |
| 47 | Montana | 0.000 | 0.00% |
| 48 | North Dakota | 0.000 | 0.00% |
| 49 | Nebraska | 0.000 | 0.00% |
| 50 | South Dakota | 0.000 | 0.00% |
| 51 | Wyoming | 0.000 | 0.00% |
What the series cannot establish
This series does not measure generation efficiency, capacity, costs, emissions reduction, electricity sales or renewable share of total generation. It also contains only 2024, so it cannot show whether any state increased or decreased from previous years.
A valid trend analysis would need the same route, field, fueltypeid, sectorid, unit and geography over time. Mixing different EIA slices would change the statistical identity and could create a misleading comparison.
Source and data identity
The source is the U.S. Energy Information Administration electricity/electric-power-operational-data API. The exact dimensions are `field=total-consumption`, `fueltypeid=REN`, `sectorid=2`, `frequency=annual`, `year=2024`, U.S. state geography and `thousand physical units`.
Frequently Asked Questions
Which state had the highest IPP Non-CHP renewable fuel consumption in 2024?
California had the highest value at 29,660.891 thousand physical units, followed by Michigan and New York.
Is this renewable electricity generation?
No. It is the EIA total-consumption fuel-consumption field reported in thousand physical units.
What are the exact EIA dimensions?
fueltypeid=REN, sectorid=2 for IPP Non-CHP, field=total-consumption, annual frequency, year 2024 and U.S. state geography.
Does a zero mean a state had no renewable energy?
No. It is a zero only for this exact EIA field, fuel category, sector and year.
Related Articles
Green Map creates custom-edited map images using open geographic data sources such as geoBoundaries, Natural Earth, OpenStreetMap, and government open data. These maps are edited visual materials, not raw data files, and are provided for education, documents, presentations, and graphic reference.