Ingham County lies in south-central Michigan, combining the Lansing–East Lansing urban area in the northwest with a much broader rural landscape extending through Mason, Williamston, Leslie, and Stockbridge. Roads and developed areas are dense near Lansing, while the eastern and southern county opens into stream valleys, farmland, and rolling terrain. That contrast makes the county especially useful to compare across road, water, and elevation views.
This page uses the supplied general county, city-distribution, terrain-and-water, and elevation maps to explain those differences. High-resolution JPG originals are available together in a ZIP download for printing, classroom materials, presentations, and detailed local reference. Reading the maps together makes it easier to connect Lansing and East Lansing with US-127, M-43, Lake Lansing, Red Cedar River, and the higher southern interior.
The easiest orientation begins in the northwest around Lansing and East Lansing. US-127 provides the clearest north-south reference toward Mason and Leslie, while M-43 leads east toward Williamston. Farther southeast, M-36, M-52, and M-106 help locate the Stockbridge side of the county, where settlement becomes much more dispersed.
Table of Contents
Lansing and East Lansing lead into the US-127 and eastern road network
The densest road pattern on the general county map is around Lansing and East Lansing. US-127 passes along the eastern side of the urban area and continues south, while major local roads spread through East Lansing, Okemos, and the Lansing core. Lansing Community College Downtown and McLaren Greater Lansing Hospital are labeled, providing additional landmarks in the northwest.
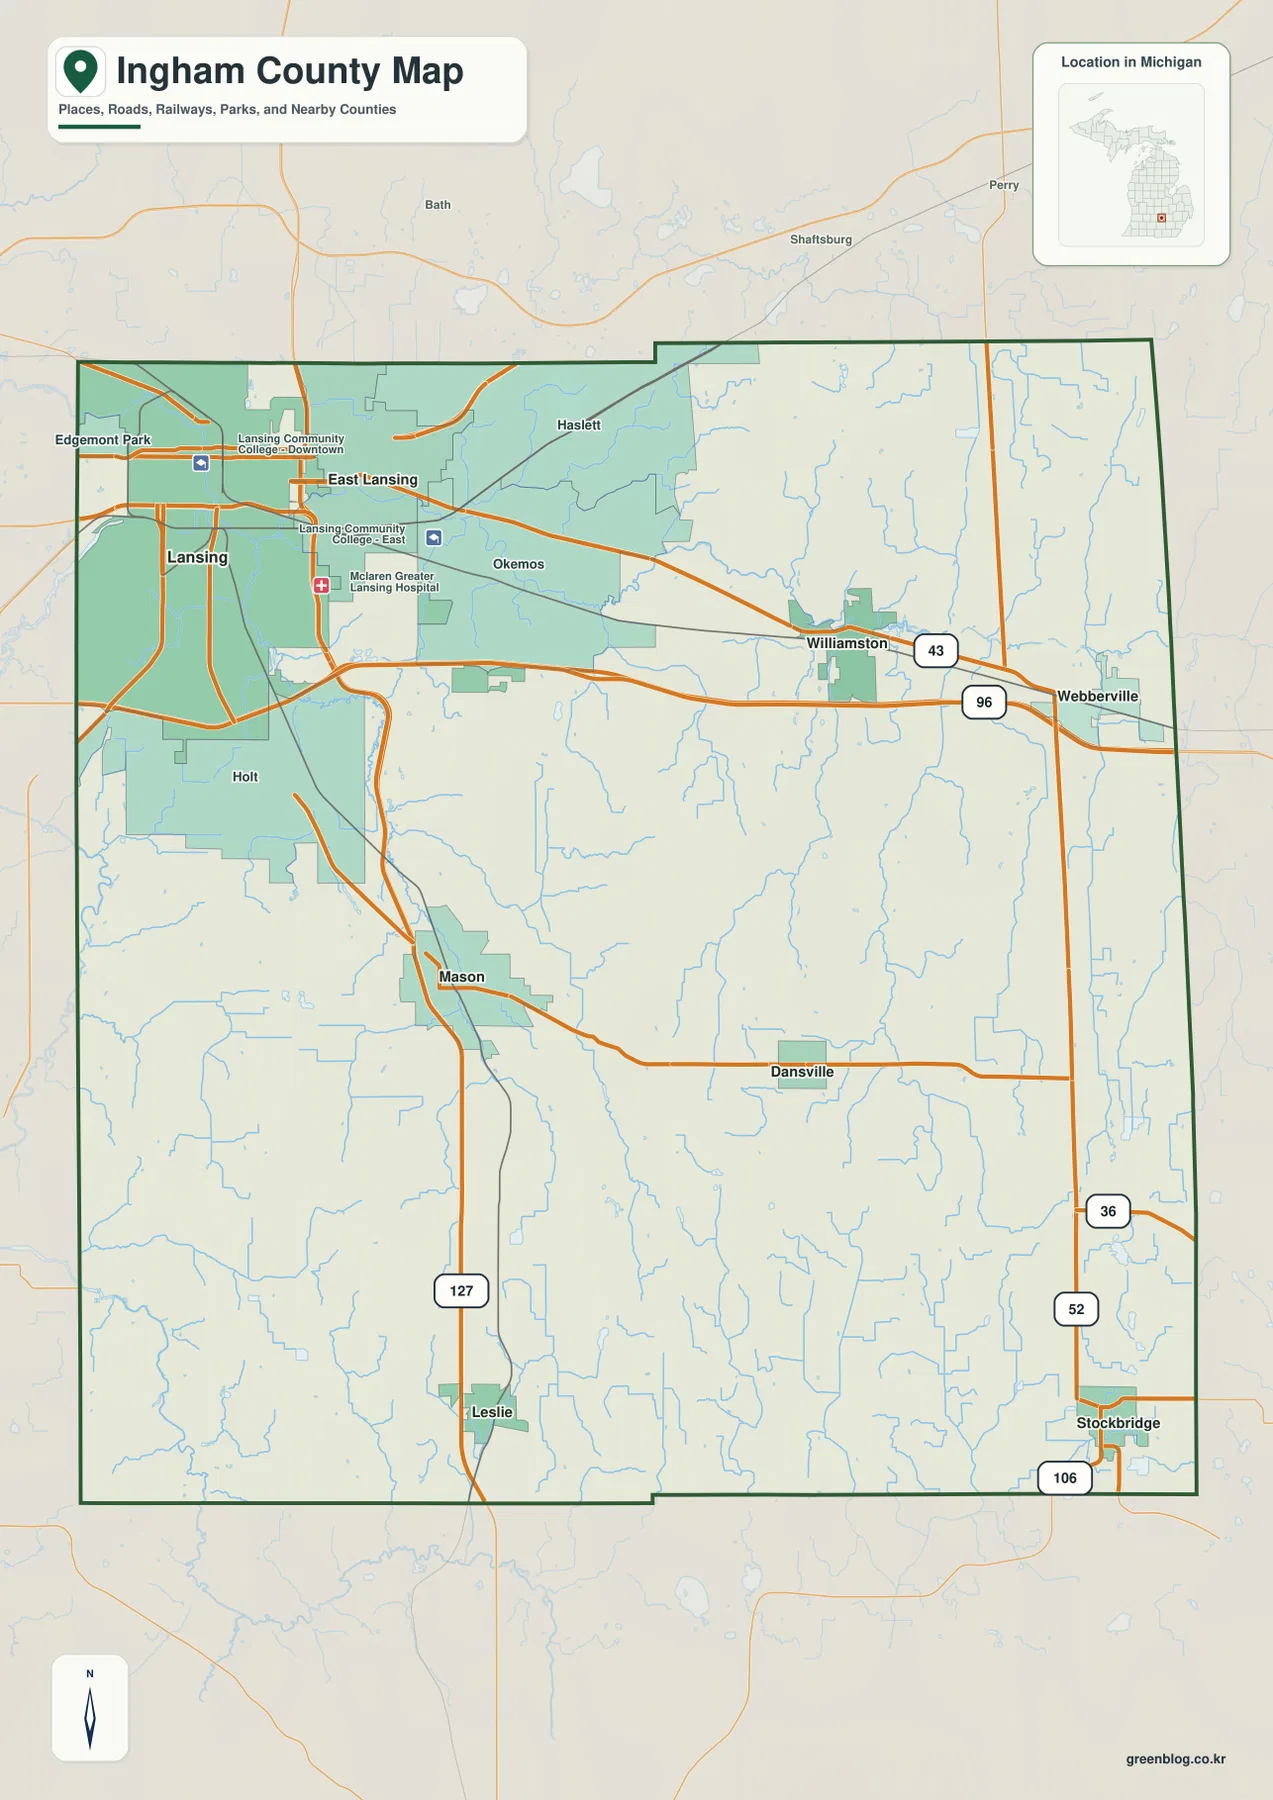
East Lansing, Okemos, and Haslett form a transition from the urban northwest into the eastern county. Roads remain relatively dense near these communities but become more widely spaced toward Williamston. M-43 provides a strong east-west reference through this part of the map.
Mason lies south of the main Lansing urban area and close to US-127. The road pattern is still well connected but noticeably less dense, with more open land and stream corridors between communities. Mason is therefore a useful midpoint between the northwest metropolitan area and the rural south.
Leslie sits near US-127 in the southern county, while Stockbridge lies close to the southeastern corner. M-52, M-36, and M-106 help orient the eastern and southeastern side. In these areas, road numbers and stream valleys are often more useful than urban landmarks for locating places.
This is a regional reference map rather than a live navigation product. It does not show current traffic, construction, accidents, winter restrictions, or temporary closures. Current driving routes and travel conditions should be checked with up-to-date Michigan transportation information or a live navigation service.
Six highlighted communities span the urban northwest and rural south
The city-distribution map highlights Lansing, East Lansing, Mason, Williamston, Leslie, and Stockbridge while removing most road detail. Lansing and East Lansing cluster in the northwest, Williamston lies to the east, Mason is farther south near the center, Leslie occupies the southern interior, and Stockbridge sits close to the southeast. There are no connector lines or distance measurements, so this map should be used for relative position rather than travel distance.
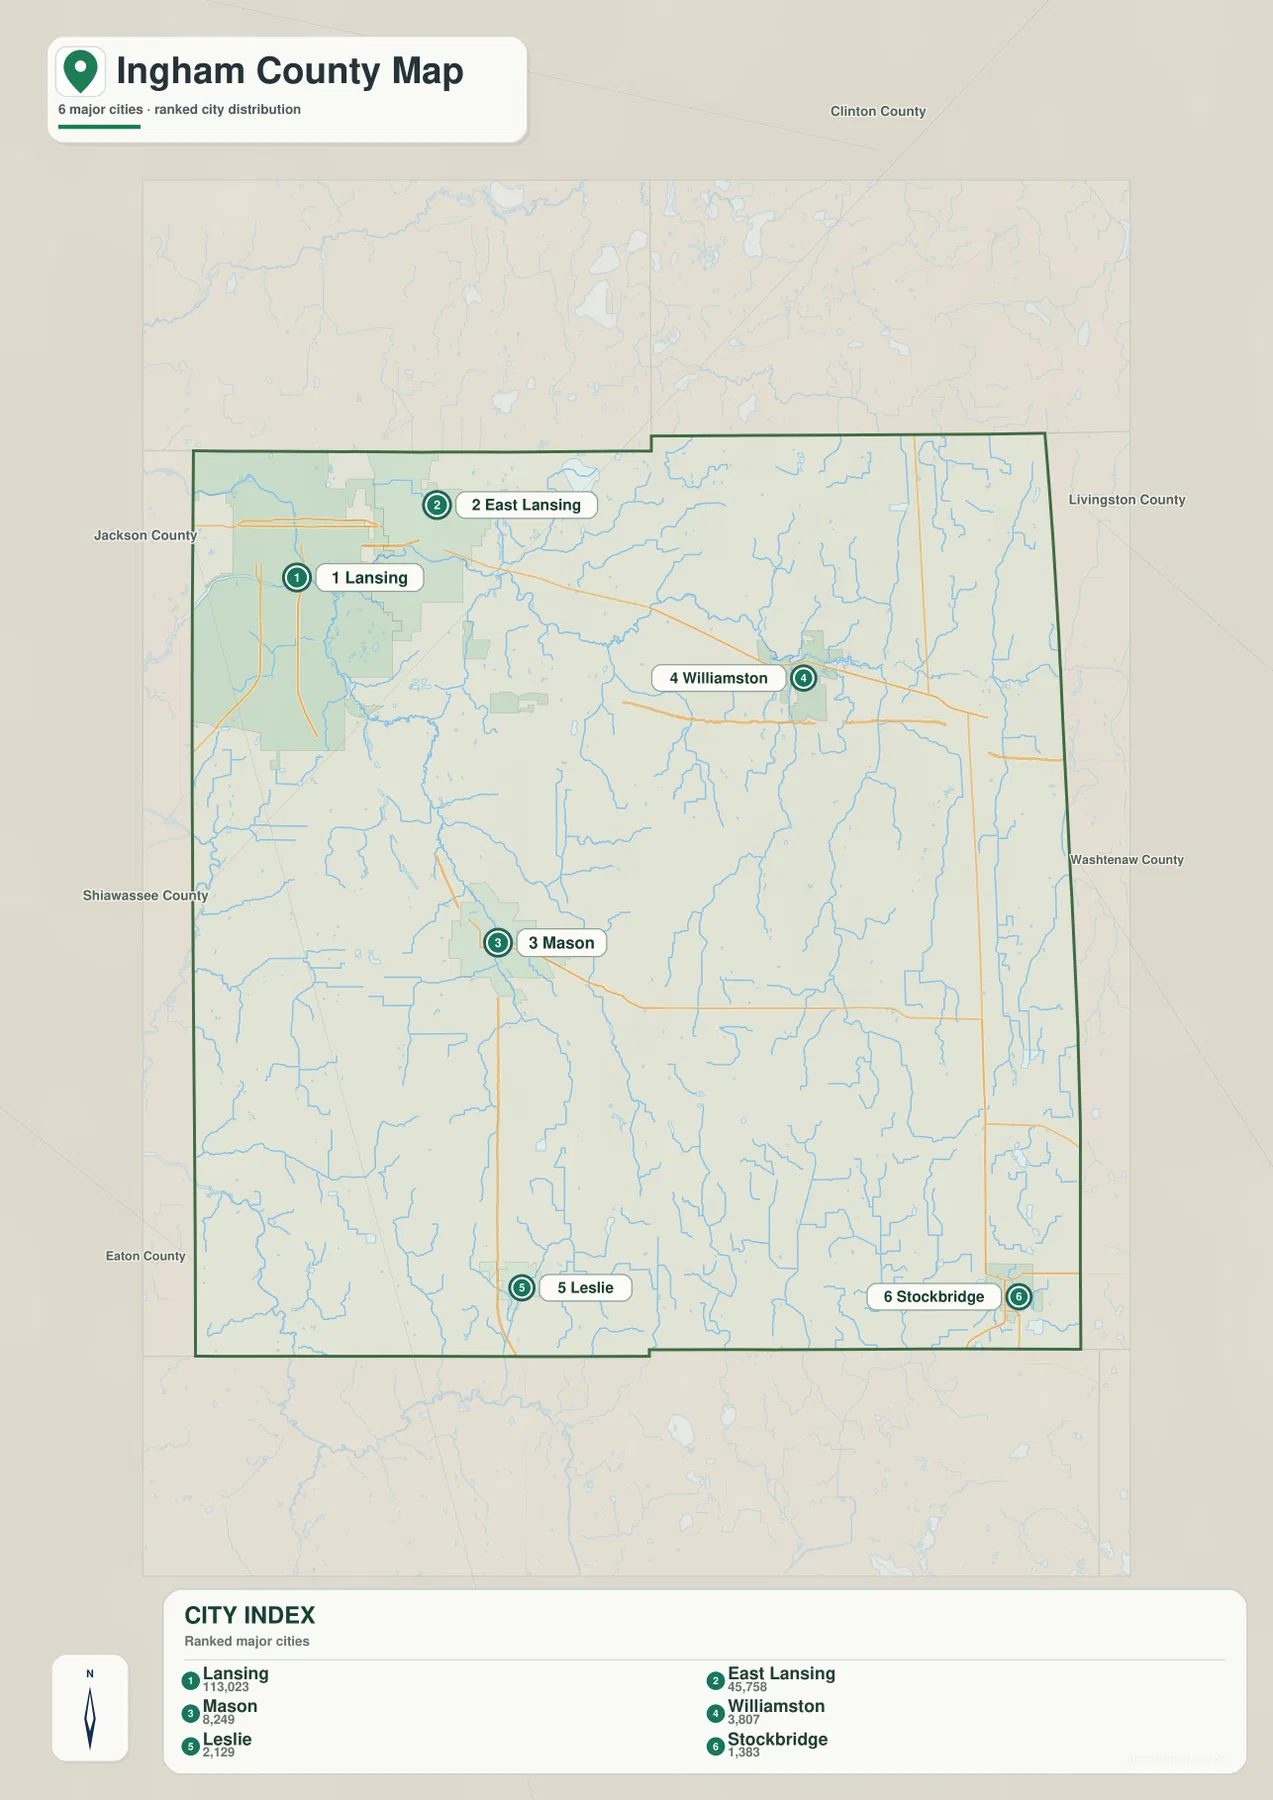
The CITY INDEX lists reference values of 113,023 for Lansing, 45,758 for East Lansing, 8,249 for Mason, 3,807 for Williamston, 2,129 for Leslie, and 1,383 for Stockbridge. These figures are best treated as ranking values used for the map rather than as the latest official population counts. Current population estimates should be checked in the relevant U.S. Census Bureau release.
Lansing is by far the largest highlighted community, with East Lansing close to the northeast. The distribution view makes the northwest concentration obvious, while the general map shows how roads, institutional sites, and nearby communities extend the urban area beyond those two city labels.
Mason and Williamston provide two different inland references. Mason anchors the central-southern part of the county near US-127, while Williamston marks the eastern side along the M-43 corridor. Leslie and Stockbridge extend the highlighted settlement pattern farther south and southeast.
Okemos, Haslett, Holt, Webberville, and other places appear on the general map but are not part of the six-city ranking. Use the distribution map when the main question is where the highlighted communities sit, then switch to the general map when smaller places and road relationships matter.
Lake Lansing and Red Cedar River connect the urban north with the rural east
Lake Lansing is the easiest named water body to find in the northern county, close to the Haslett side of the map. The county is not dominated by one large inland lake; instead, rivers, creeks, and smaller lakes are distributed across the landscape. That dense network becomes especially useful for understanding the eastern and southern rural areas.
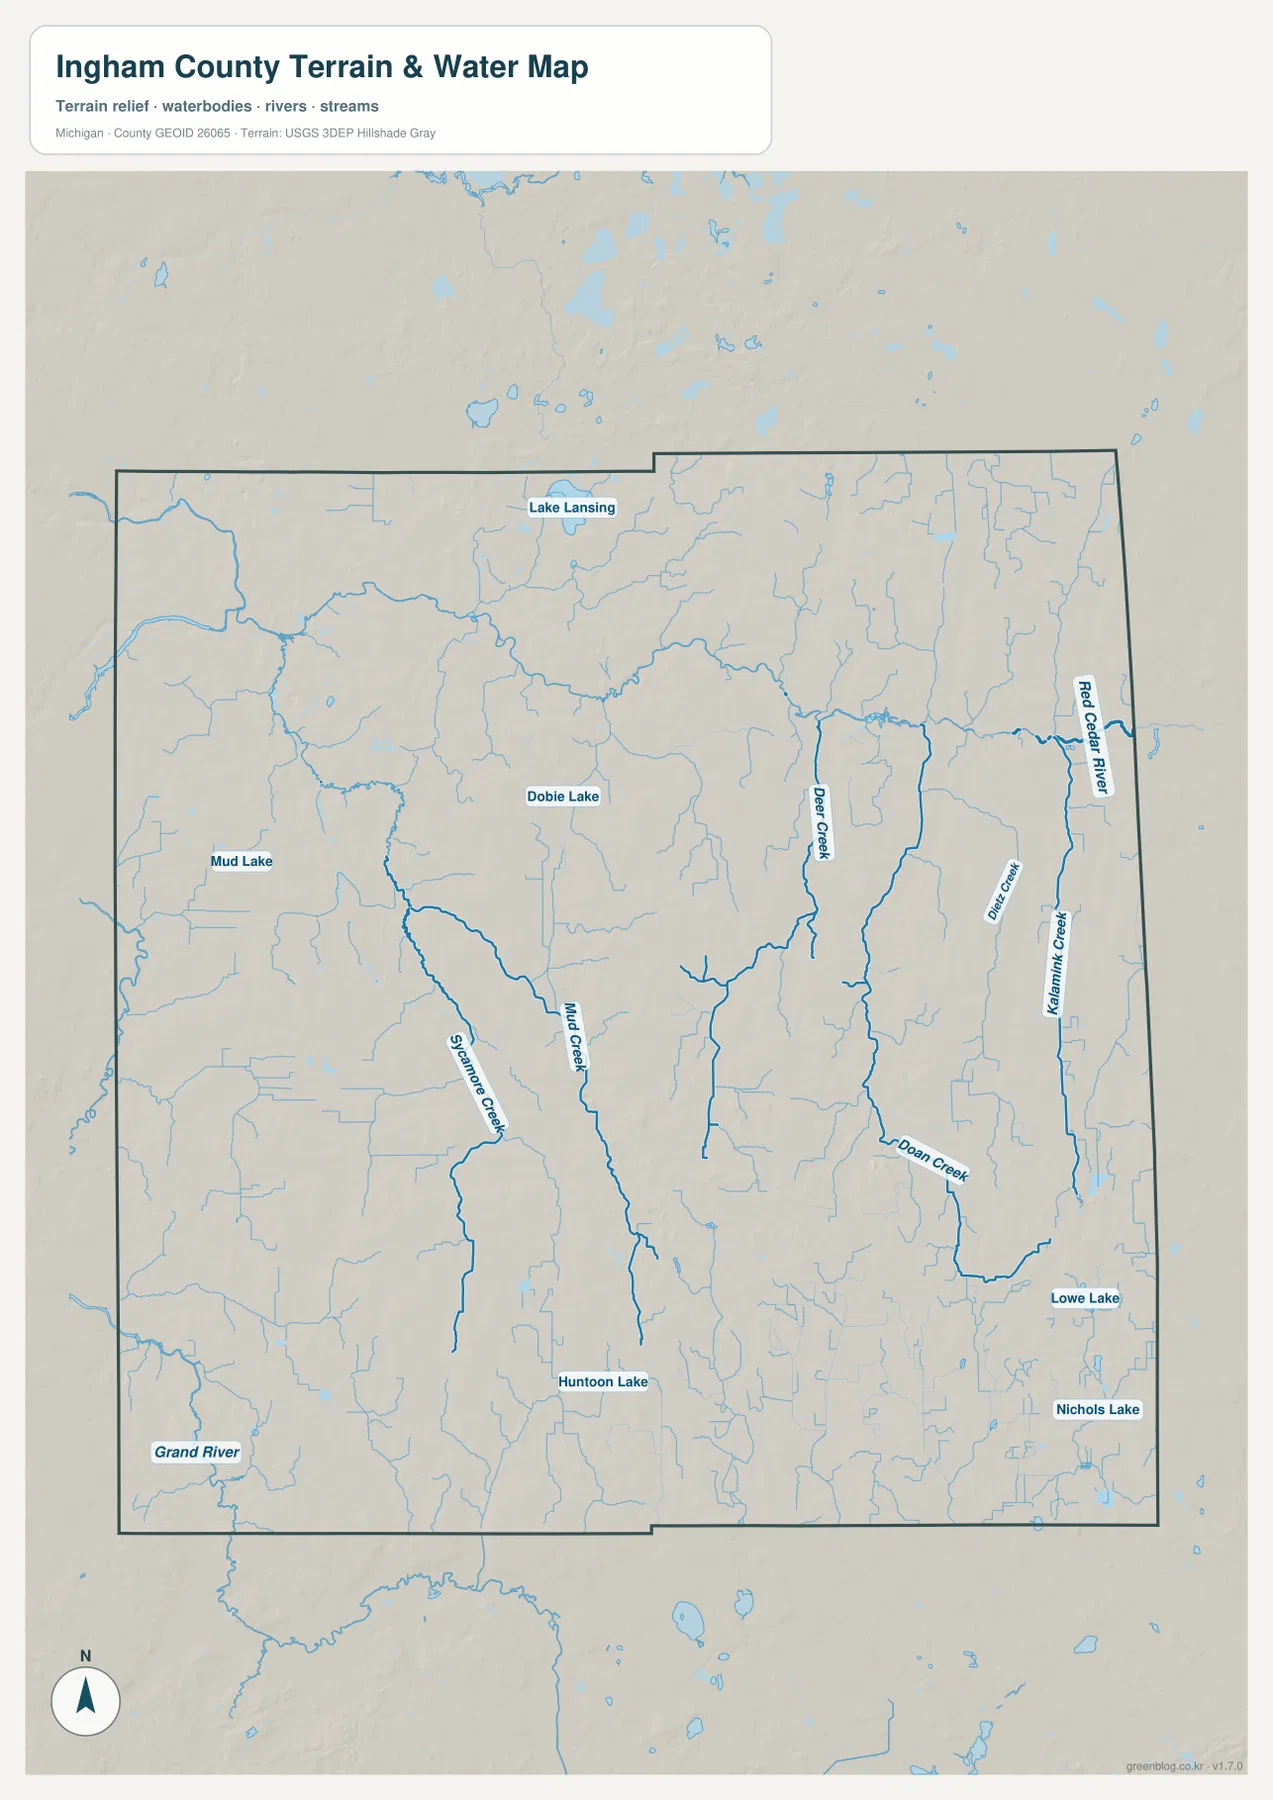
Red Cedar River is the strongest eastern river reference. It crosses the northeastern and eastern county while receiving many smaller tributaries from both sides. The Williamston side is easier to understand when this river network is compared with the general road map.
Sycamore Creek and Mud Creek are important across the west-central and southern interior. Sycamore Creek helps orient the area south of Lansing and west of Mason, while Mud Creek runs through the central county and collects several smaller channels. Grand River is also visible near the southwestern edge of the mapped area.
Deer Creek and Doan Creek provide strong water references farther east, with Bell Creek and other tributaries nearby. Huntoon Lake appears in the south-central county, while Lowe Lake and Nichols Lake are labeled in the southeast. These smaller waters can be more useful than town names for locating rural parts of the county.
This water map is a geographic reference, not a flood, navigation, depth, water-quality, or legal-access product. It does not provide current water levels, channel suitability, flood status, or property rights. Drainage planning, fishing, and flood preparation should use current Michigan and federal information in addition to this county-scale view.
Northwestern lowlands rise into the southern hills
The elevation legend reports an actual range of about 246 to 320 meters with a mean of 278 meters. Dark green marks the lower parts of Ingham County, lighter green and yellow indicate intermediate terrain, and orange to brown identifies the higher hills. The palette is locally scaled, so the same color on another county map should not be assumed to represent the same elevation.
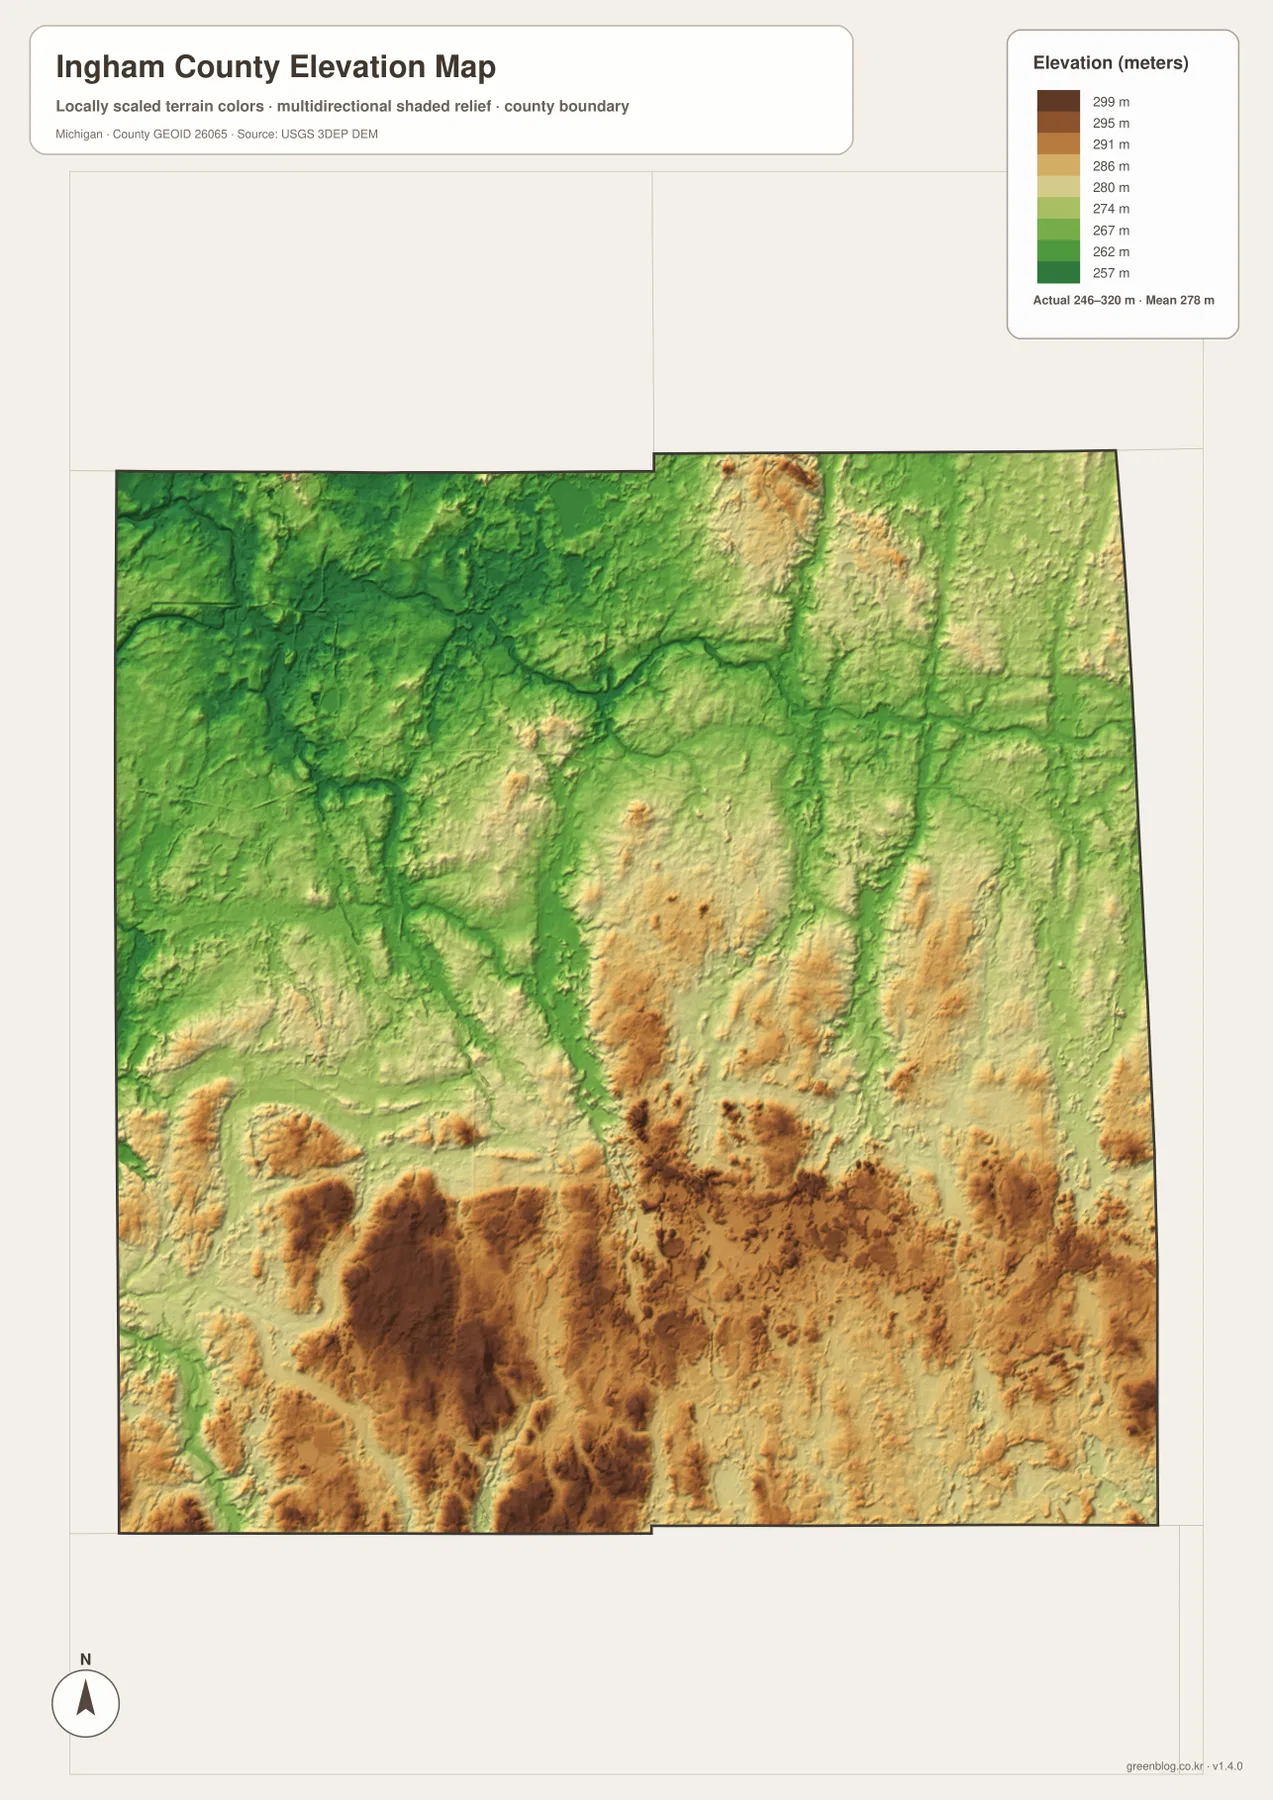
The broadest low terrain appears across the northwest and along major stream corridors. Lansing and East Lansing sit well below the strongest southern hills, while Red Cedar River and Sycamore Creek create long green valleys extending through the county.
Central Ingham County is a mixture of green, light green, and yellow terrain broken by narrow stream valleys. Mason occupies this intermediate zone rather than the county’s lowest or highest ground. Mud Creek and Sycamore Creek create lower corridors through otherwise gently rolling land.
The strongest orange and brown terrain is concentrated across the south and southwest, where some mapped ridges rise above 300 meters. Hills west and southwest of Leslie are among the clearest elevated areas, and smaller high ridges also appear farther east. The relief is moderate, but the difference from the northwest urban lowlands is easy to see.
The Williamston and Stockbridge side contains a mix of rolling uplands and lower creek valleys. Deer Creek and Doan Creek align with green corridors, while surrounding land rises into lighter green and yellow ridges. This county-scale elevation surface is useful for broad comparison but is not survey-grade or engineering-grade measurement. Exact site elevations require authoritative detailed data such as the USGS 3D Elevation Program.
Lansing, Mason, Williamston, and Stockbridge show four different county settings
Lansing and East Lansing provide the best starting point. The general map shows the dense road network, the city map makes them the two largest highlighted communities, the water map places Red Cedar River and nearby streams around the urban area, and the elevation surface shows a relatively low northwestern setting.
Mason marks the transition into the central and southern county. US-127 remains the main transportation reference, but road spacing increases and stream corridors become more visible. Elevation also rises gradually compared with the Lansing area, placing Mason between the low northwest and the higher southern hills.
Williamston represents the eastern rural corridor. M-43 provides the main road reference, while Red Cedar River, Deer Creek, Doan Creek, and nearby tributaries organize the landscape. The water map therefore reveals more structure here than the simplified city-distribution view.
Stockbridge sits close to the southeastern corner and is associated with M-52, M-36, and M-106. Lowe Lake and Nichols Lake provide small water references nearby, while the elevation surface shows a mix of rolling hills and creek valleys rather than one flat plain.
For practical use, the general map is best for roads and named places, the city map for relative settlement positions, the water map for Lake Lansing, Red Cedar River, and the creek network, and the elevation map for the northwest-to-south relief contrast. Used together, the maps provide a fuller picture of Ingham County.
Choosing an Ingham County map and using the high-resolution files
Use the general county map when you need Lansing, East Lansing, Mason, Williamston, Leslie, Stockbridge, US-127, M-43, M-36, M-52, and M-106 in one view. The city-distribution map is cleaner when the main question is where the six highlighted communities sit within the county. Choose the terrain-and-water map for Lake Lansing, Red Cedar River, Sycamore Creek, and Deer Creek, and the elevation map when the contrast between northwestern lowlands and southern hills is the main subject.
The WebP images on this page are optimized for browser viewing. The ZIP below contains the original high-resolution JPG versions of the general county map, city-distribution map, terrain-and-water map, and elevation map. Those originals are better suited to printing, classroom handouts, presentations, and large displays where additional image detail is useful.
Frequently Asked Questions
Which map is best for finding Lansing, East Lansing, and Mason together?
Use the general county map. It shows the Lansing–East Lansing road network, US-127 toward Mason, and the eastern corridor toward Williamston. The city-distribution map is also useful when you only need the relative positions of the highlighted communities.
Which map shows Lake Lansing and Red Cedar River?
Use the terrain-and-water map. It shows Lake Lansing, Red Cedar River, Sycamore Creek, Mud Creek, Deer Creek, Doan Creek, Huntoon Lake, Lowe Lake, and Nichols Lake. It is a location reference and does not provide flood, depth, navigation, water-quality, or access information.
Where does Ingham County appear highest on the elevation map?
The strongest high terrain is concentrated across the south and southwest, while the Lansing–East Lansing area and the major river valleys are generally lower. The legend reports an actual range of roughly 246 to 320 meters with a mean of 278 meters, but exact site elevations should be checked in authoritative elevation data.
Map File Information
The ZIP contains the high-resolution JPG originals for the Ingham County general map, city-distribution map, terrain-and-water map, and elevation map.
- Included Files: general county map, city-distribution map, terrain-and-water map, elevation map
- File Type: JPG
Related Maps
Sources and reference links
For county government and local information, see the official Ingham County website. For boundary and road-reference data, consult U.S. Census Bureau TIGER/Line. Water features can be cross-checked with USGS National Hydrography, and elevation data with the USGS 3D Elevation Program. These page maps are general reference products and do not replace legal boundaries, surveys, navigation charts, or flood determinations.
Green Map creates custom-edited map images using open geographic data sources such as geoBoundaries, Natural Earth, OpenStreetMap, and government open data. These maps are edited visual materials, not raw data files, and are provided for education, documents, presentations, and graphic reference.