Eurostat’s 2025 business digitalisation data show wide differences in the share of enterprises using generative AI to create pictures, video, sound or audio. Finland records the highest value among the 32 reporting countries at 21.55%, followed by Sweden at 18.67%, Denmark at 17.66% and Belgium at 17.32%. The Netherlands and Luxembourg are also above 14%, while Montenegro has the lowest value at 1.85%.
The simple mean is 8.89% and the median is 7.04%. The first quartile is 4.73% and the third quartile 13.06%, placing the middle half of observations between roughly 4.73% and 13.06%. The gap between the maximum and minimum is 19.70 percentage points. Higher values lift the mean, but a substantial group of countries sits in the 5% to 10% range.
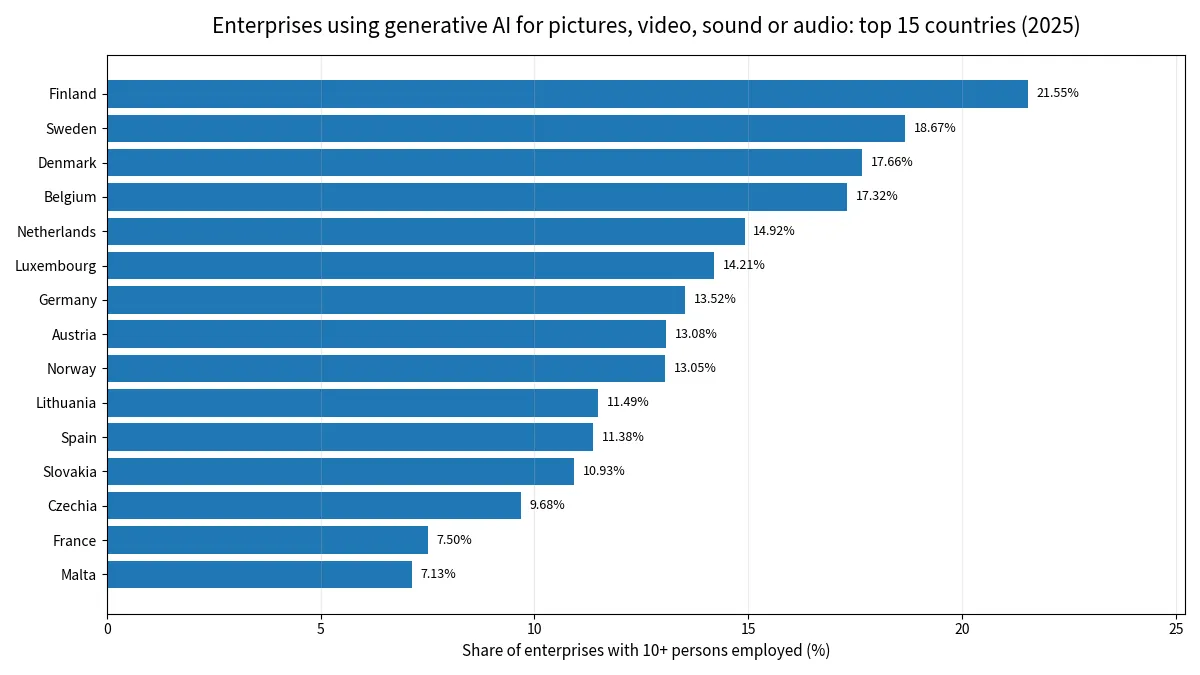
Table of Contents
This is a generative-media indicator, not overall generative AI adoption
E_AI_TPVSG does not measure whether an enterprise uses any form of generative AI. It isolates the use of AI technologies that generate pictures, video, sound or audio. An enterprise that only uses text-generation or natural-language tools may therefore fall outside this indicator. Conversely, businesses using AI to create visual or audio material can be counted even if their use of other AI technologies is limited.
The size class GE10 covers enterprises with ten or more persons employed, and PC_ENT expresses the result as a percentage of enterprises. A firm with thousands of workers and a firm just above the ten-person threshold each count as one enterprise. The indicator does not measure the number of images or videos created, audio minutes generated, spending, employee users, or business outcomes.
Finland leads at 21.55%, with Nordic countries prominent near the top
Finland records 21.55%, Sweden 18.67% and Denmark 17.66%. Norway is at 13.05%. The simple average for Denmark, Finland, Norway and Sweden is 17.73%, about 8.84 percentage points above the overall mean. This is an unweighted average of four national percentages rather than a Nordic enterprise-weighted rate.
Belgium at 17.32%, the Netherlands at 14.92% and Luxembourg at 14.21% give a Benelux simple average of 15.48%. The Baltic states are more dispersed: Lithuania is at 11.49%, Estonia 6.46% and Latvia 5.48%, for a simple average of 7.81%. Geographic proximity does not produce one common adoption level.
The 8.89% mean is above the 7.04% median
The mean of 8.89% exceeds the median of 7.04% by 1.85 percentage points. Half of the reporting countries are at or below 7.04%, while the other half are above it. The interquartile range from 4.73% to 13.06% captures the central half of the distribution.
By broad bands, 4 countries are at 15% or more, 8 are from 10% to below 15%, 11 are from 5% to below 10%, 7 are from 3% to below 5%, and 2 are below 3%. The top eight countries average 16.37%, compared with 3.62% for the bottom eight, a ratio of roughly 4.5 to one.
Many countries are clustered in the middle of the table
Czechia, France, Malta, Croatia, Italy, Estonia, Slovenia, Portugal, Ireland, Latvia and Bosnia and Herzegovina all sit around the mid-single digits to upper-single digits. In this part of the distribution, a difference of one or two percentage points can move a country several positions. Rank is therefore less informative than the actual percentage-point distance.
Germany, France, Italy and Spain have a simple average of 9.86%. Germany is at 13.52%, Spain 11.38%, France 7.50% and Italy 7.04%. This is not a combined enterprise-weighted rate because each country percentage receives the same weight.
Generative media can support very different business tasks
The technology category can be used for marketing images, product visualisation, draft video assets, voice synthesis, audio effects, presentation media and other creative or communication tasks. A single national percentage does not reveal which use case dominates, which industries account for most adoption, or whether enterprises build systems internally or use external services.
Depth of use can also differ greatly. An enterprise that occasionally creates an illustration and one that integrates generative media into a continuous production pipeline can both be classified as users. The indicator therefore measures prevalence rather than intensity, sophistication or economic impact.
A low value does not imply low use of generative AI overall
Montenegro at 1.85%, Poland at 2.75%, Romania at 3.03%, Albania at 3.53% and Serbia at 3.95% are among the lower observations. These figures are specific to the generation of pictures, video, sound or audio. Enterprises may use text generation, natural-language tools, speech recognition, image recognition, data analytics or workflow automation without using this media-generation category.
Different AI technology indicators also overlap at enterprise level. A company can use text generation and image generation at the same time, or use several audio and visual tools together. Percentages from separate technology categories therefore cannot be added to calculate a total AI adoption rate without double counting.
Industry structure may matter, but the country rates do not prove causes
Media, advertising, design, software, e-commerce and other content-heavy industries may have more direct opportunities to use generative pictures, video and audio. Manufacturers may also use the tools for product visualisation, training material or marketing. Economies with different sector mixes can therefore have different adoption opportunities.
However, sector mix alone cannot explain the national differences. Enterprise size, digital capability, internal policies, copyright requirements, privacy rules, service prices, language support and security constraints may all influence adoption. Those explanatory variables are not contained in this dataset, so they remain hypotheses rather than demonstrated causes.
All 32 comparable observations for 2025
The table orders all 32 national observations from highest to lowest while holding the year, enterprise-size class, sector aggregate, indicator and unit constant. The ranking is intended for data navigation and should not be treated as a composite measure of AI competitiveness or creative-industry strength.
| Rank | Country | Share of enterprises |
|---|---|---|
| 1 | Finland | 21.55% |
| 2 | Sweden | 18.67% |
| 3 | Denmark | 17.66% |
| 4 | Belgium | 17.32% |
| 5 | Netherlands | 14.92% |
| 6 | Luxembourg | 14.21% |
| 7 | Germany | 13.52% |
| 8 | Austria | 13.08% |
| 9 | Norway | 13.05% |
| 10 | Lithuania | 11.49% |
| 11 | Spain | 11.38% |
| 12 | Slovakia | 10.93% |
| 13 | Czechia | 9.68% |
| 14 | France | 7.50% |
| 15 | Malta | 7.13% |
| 16 | Croatia | 7.04% |
| 17 | Italy | 7.04% |
| 18 | Estonia | 6.46% |
| 19 | Slovenia | 6.05% |
| 20 | Portugal | 5.88% |
| 21 | Ireland | 5.65% |
| 22 | Latvia | 5.48% |
| 23 | Bosnia and Herzegovina | 5.01% |
| 24 | Türkiye | 4.75% |
| 25 | Cyprus | 4.68% |
| 26 | Hungary | 4.65% |
| 27 | Bulgaria | 4.52% |
| 28 | Serbia | 3.95% |
| 29 | Albania | 3.53% |
| 30 | Romania | 3.03% |
| 31 | Poland | 2.75% |
| 32 | Montenegro | 1.85% |
A single year does not show adoption speed
The comparison is a 2025 cross-section. Finland’s leading level does not mean it had the fastest recent growth, and a low current level does not mean adoption is declining. Measuring acceleration or slowdown requires earlier observations under the same statistical definition.
Time-series comparisons also need a consistent GE10 size class, C10-S951_X_K sector aggregate, PC_ENT unit and E_AI_TPVSG indicator. A change in survey scope can move the percentage even when underlying technology use does not change in the same way.
What the comparison can and cannot establish
The data directly support a comparison of 2025 prevalence across 32 countries. The simple mean is 8.89%, the median 7.04%, the maximum 21.55% and the minimum 1.85%. They also support calculations of quartiles, broad bands and simple regional averages.
The same evidence cannot tell us which generative models dominate, how much media is produced, whether content quality improves, or whether the technology raises revenue or productivity. Those questions require enterprise-level use, spending, output and performance data.
Source and indicator definition
The source is Eurostat isoc_eb_ai for 2025. The indicator is E_AI_TPVSG, the enterprise-size class is GE10, the sector aggregate is C10-S951_X_K and the unit is PC_ENT. It measures the percentage of enterprises with ten or more persons employed using AI technologies that generate pictures, video, sound or audio. The mean, median and quartiles are calculated from the 32 country observations.
Frequently Asked Questions
Which country had the highest share of enterprises using generative AI for pictures, video, sound or audio in 2025?
Finland had the highest share at 21.55%, followed by Sweden, Denmark and Belgium.
Is E_AI_TPVSG an overall generative AI adoption rate?
No. It specifically measures enterprises using AI technologies that generate pictures, video, sound or audio.
What are the mean and median across the 32 countries?
The simple mean is 8.89% and the median is 7.04%.
Can this percentage be added to text-generation AI use?
No. The same enterprise can use multiple AI technologies, so adding separate technology percentages can double count firms.
Related Articles
Green Map creates custom-edited map images using open geographic data sources such as geoBoundaries, Natural Earth, OpenStreetMap, and government open data. These maps are edited visual materials, not raw data files, and are provided for education, documents, presentations, and graphic reference.