Eurostat’s 2025 enterprise digitalisation data show a wide spread in the share of businesses that both use at least one artificial-intelligence technology and perform data analytics. Among 31 reporting countries under the same enterprise-size and industry definitions, Denmark records 34.03%, followed by the Netherlands at 26.94%, Finland at 26.93%, Belgium at 26.55%, and Sweden at 23.21%. At the other end, Romania is at 3.83% and Türkiye at 4.50%, while Bulgaria and Poland record 5.68% and 6.12%.
The unweighted mean across the 31 observations is 14.07% and the median is 13.90%. Their difference is only 0.17 percentage points, so the centre of this distribution is not being pulled strongly in one direction by a few extreme observations. The first quartile is 7.07% and the third quartile 17.64%, placing the middle half of countries across a span of more than ten percentage points. The gap between the maximum and minimum is 30.20 points, which is large even though the mean and median are close.
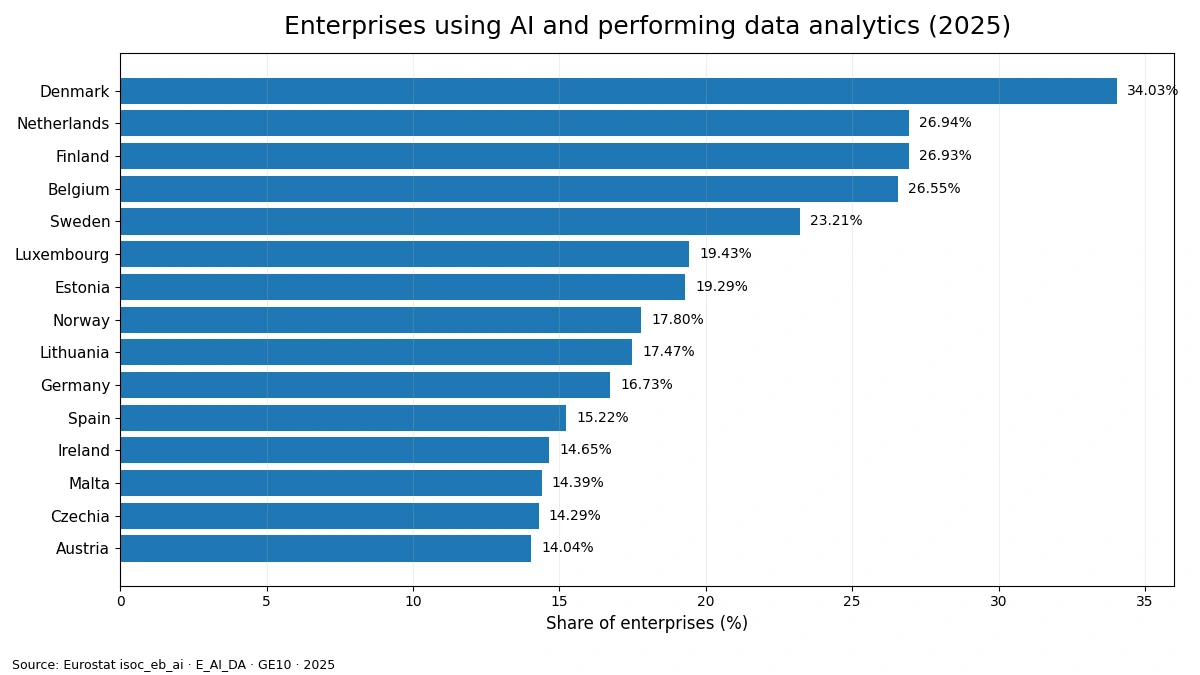
Table of Contents
The indicator is an intersection of two conditions, not a general AI adoption rate
E_AI_DA should be read literally. An enterprise belongs in the numerator when it satisfies both parts of the definition: it uses at least one of the AI technologies covered by the Eurostat survey and it performs data analytics. The measure is therefore narrower than a general “uses AI” indicator and different from a general “performs data analytics” indicator. It is also not the sum or average of two separate rates. Denmark’s 34.03%, for example, means that roughly one in three enterprises inside this survey universe met the combined condition.
The denominator matters just as much as the numerator. The enterprise-size class is GE10, meaning businesses with ten or more persons employed, and the unit is the percentage of enterprises. A large company with thousands of workers still counts as one enterprise, while microbusinesses below the size threshold are outside this specific comparison. The figure does not measure the number of employees using AI, spending on data systems, the number of analytics projects, the sophistication of models, or any productivity outcome. Those are separate questions.
High values appear in both the Nordic region and Benelux
Denmark is the only observation above 30%. The Netherlands, Finland, and Belgium all exceed 25%, and Sweden is above 23%. A simple average for Denmark, Finland, Norway, and Sweden is 25.49%, more than eleven percentage points above the full-sample mean. The three Benelux observations are also high: Belgium at 26.55%, the Netherlands at 26.94%, and Luxembourg at 19.43%, for an unweighted average of 24.31%.
The upper part of the table is not exclusively Nordic or Benelux, however. Estonia reaches 19.29%, Lithuania 17.47%, Germany 16.73%, and Spain 15.22%. The three Baltic observations average 15.49%, but that regional average conceals a sizeable internal gap because Latvia is at 9.72%. These patterns can motivate further investigation, but E_AI_DA by itself cannot establish why one country is higher than another. Industry mix, firm size, investment, skills, infrastructure, and survey behaviour would need separate evidence.
A mean close to the median makes the centre relatively stable
The median observation is Slovenia at 13.90%, almost exactly matching the 14.07% arithmetic mean. That is a useful contrast with highly skewed technology indicators where a small number of leaders push the average far above the typical country. Here, the very high value for Denmark is counterbalanced by several low observations, leaving the central measures close together. The quartiles still show substantial dispersion: one quarter of countries are at or below roughly 7.07%, while another quarter are at or above about 17.64%.
Grouping the values clarifies the shape. Five countries are at 20% or more; six are between 15% and less than 20%; nine are from 10% to less than 15%; another nine are from 5% to less than 10%; and only two fall below 5%. Twenty of the 31 observations are at least 10%, while eleven are at least 15%. The top eight countries average 24.27%, compared with 5.89% for the bottom eight, a ratio of a little over four to one.
Several middle-ranked countries are separated by very small gaps
The middle of the ranking is dense. Germany records 16.73%, Spain 15.22%, Ireland 14.65%, Malta 14.39%, Czechia 14.29%, Austria 14.04%, Slovenia 13.90%, Slovakia 12.81%, Croatia 12.01%, France 11.93%, and Italy 11.50%. Malta and Czechia differ by only 0.10 percentage points; Austria and Slovenia by 0.14 points. A visual ranking can make a number of places seem important even when the actual numerical differences are small.
The four observations for Germany, France, Italy, and Spain have a simple average of 13.85%, almost identical to the overall mean. That calculation is useful as a descriptive comparison but must not be mistaken for a weighted average of large European economies. Each country contributes one rate regardless of the number of enterprises or workers it represents. The dataset is designed for comparable national percentages, not for reconstructing a continent-wide total from these country rates.
Lower percentages do not mean that AI or analytics are absent
Romania at 3.83% and Türkiye at 4.50% are the only observations below 5%. Bulgaria is at 5.68%, Poland 6.12%, Serbia 6.47%, Montenegro 6.73%, Hungary 6.84%, Bosnia and Herzegovina 6.93%, and Cyprus 7.21%. These are positive values, so they should not be described as countries without AI or without data analytics. They indicate a smaller share of enterprises meeting the combined condition used in E_AI_DA.
An enterprise can be outside this numerator for several reasons. It may use an AI technology but not report performing data analytics under the survey definition, or it may perform data analytics without using one of the listed AI technologies. Because the indicator is conjunctive, it should not be transformed into an overall digital-capability score. Explaining low or high values would require additional evidence on sectors, enterprise-size structure, software investment, data infrastructure, workforce skills, regulation, and related conditions.
All 31 comparable observations for 2025
The table below sorts all observations from highest to lowest while keeping the year, enterprise-size threshold, industry aggregate, indicator, and unit constant. Rank is provided for navigation only. It is not a composite ranking of AI competitiveness, innovation quality, digital readiness, or business performance.
| Rank | Country | Share of enterprises |
|---|---|---|
| 1 | Denmark | 34.03% |
| 2 | Netherlands | 26.94% |
| 3 | Finland | 26.93% |
| 4 | Belgium | 26.55% |
| 5 | Sweden | 23.21% |
| 6 | Luxembourg | 19.43% |
| 7 | Estonia | 19.29% |
| 8 | Norway | 17.80% |
| 9 | Lithuania | 17.47% |
| 10 | Germany | 16.73% |
| 11 | Spain | 15.22% |
| 12 | Ireland | 14.65% |
| 13 | Malta | 14.39% |
| 14 | Czechia | 14.29% |
| 15 | Austria | 14.04% |
| 16 | Slovenia | 13.90% |
| 17 | Slovakia | 12.81% |
| 18 | Croatia | 12.01% |
| 19 | France | 11.93% |
| 20 | Italy | 11.50% |
| 21 | Latvia | 9.72% |
| 22 | Portugal | 8.87% |
| 23 | Cyprus | 7.21% |
| 24 | Bosnia and Herzegovina | 6.93% |
| 25 | Hungary | 6.84% |
| 26 | Montenegro | 6.73% |
| 27 | Serbia | 6.47% |
| 28 | Poland | 6.12% |
| 29 | Bulgaria | 5.68% |
| 30 | Türkiye | 4.50% |
| 31 | Romania | 3.83% |
What the comparison can and cannot establish
The data provide a clear snapshot of the level and dispersion of the combined AI-use-and-data-analytics condition in 2025. They identify the centre of the distribution, show the distance between the upper and lower groups, and make it possible to compare countries under a common statistical definition. They do not, by themselves, show whether adoption is accelerating or slowing because a single-year cross-section cannot replace a time series. Nor do they identify which AI technologies account for each country’s value.
A high share also should not be interpreted as proof of higher productivity, better decisions, or stronger financial returns. Adoption and outcomes are different variables. Causal explanations would require additional data on industries, company size, investment, workforce capabilities, cloud and data infrastructure, and policy conditions. The strongest conclusion here is descriptive: the combined enterprise share ranges from 3.83% to 34.03%, with a mean and median around 14% and a broad middle distribution.
Source and indicator definition
The primary source is Eurostat isoc_eb_ai for 2025. The indicator is E_AI_DA, enterprise size is GE10, the unit is PC_ENT, and the industry aggregate is C10-S951_X_K. It measures the percentage of enterprises with at least ten persons employed that use at least one listed artificial-intelligence technology and perform data analytics. Rankings, quartiles, means, medians, and interval counts in this article are calculated from the 31 observations sharing those same conditions.
Frequently Asked Questions
Which country has the highest 2025 share of enterprises using AI and performing data analytics?
Denmark is highest among the 31 reporting countries at 34.03%, followed by the Netherlands at 26.94%, Finland at 26.93%, and Belgium at 26.55%.
Is E_AI_DA the same as the overall enterprise AI adoption rate?
No. It covers enterprises with at least ten persons employed that both use at least one listed AI technology and perform data analytics, so it is a combined condition rather than a general AI-use rate.
What are the mean and median across the 31 countries?
The unweighted mean is 14.07% and the median is 13.90%. Their closeness indicates that the centre is not strongly distorted by a small number of extreme observations.
Can these 31 national percentages be treated as a weighted European average?
No. They are comparable country-level rates. They are not weighted by each country’s number of enterprises, employment, or economic size and therefore do not form a continent-wide weighted average.
Related Articles
Green Map creates custom-edited map images using open geographic data sources such as geoBoundaries, Natural Earth, OpenStreetMap, and government open data. These maps are edited visual materials, not raw data files, and are provided for education, documents, presentations, and graphic reference.