Transport services accounted for very different shares of service exports across economies in 2024. Among 163 World Bank country and economy observations with a reported value, the median was 16.34%. Mozambique reached 78.44% and Ethiopia 78.35%, while Dominica was 0.81% and Guinea-Bissau 0.87%. The range is wide enough that a single global average hides much of the underlying structure.
The indicator is World Bank series BX.GSR.TRAN.ZS, “Transport services (% of service exports, BoP).” It measures transport services as a percentage of total service exports recorded in the balance of payments. Transport services cover the carriage of people and goods from one location to another, related supporting and auxiliary services, and postal and courier services. A value of 50% therefore means that transport represented half of service exports, not half of all merchandise and service exports combined.
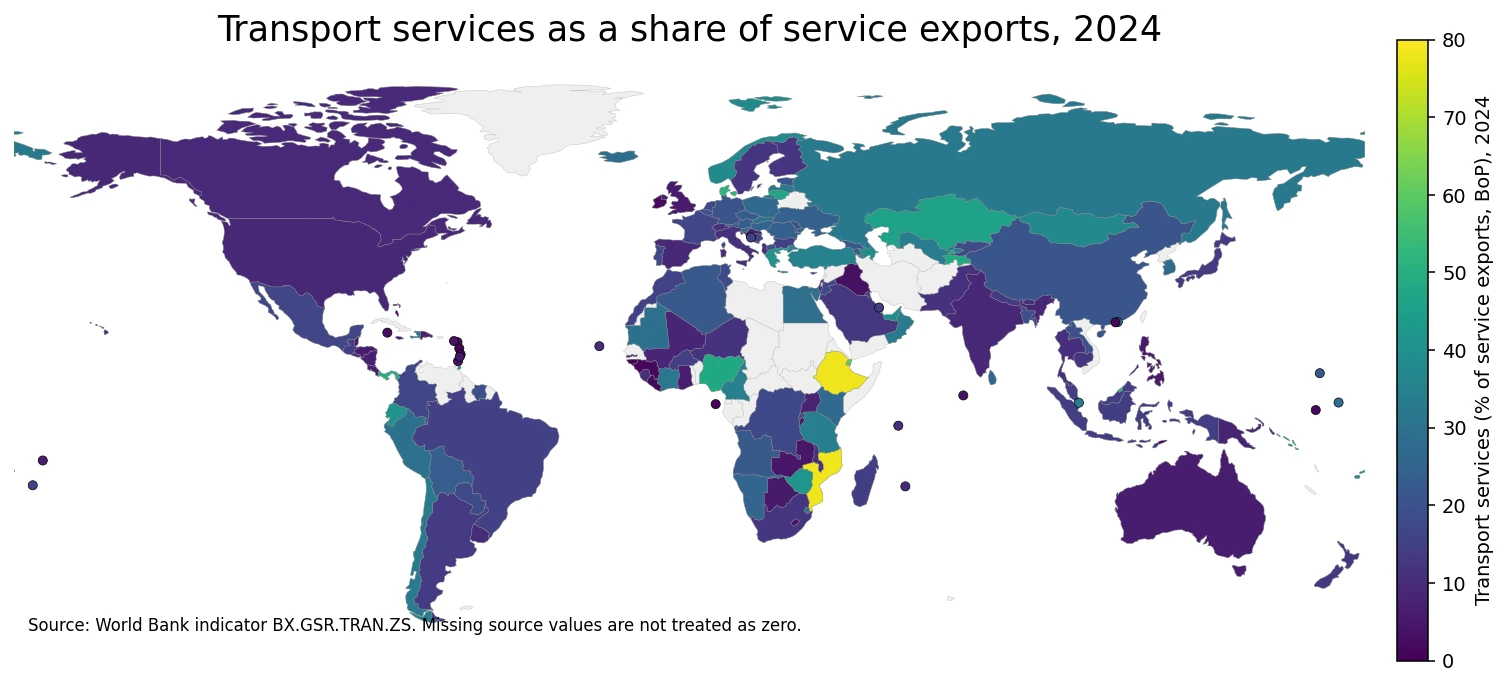
Table of Contents
The 2024 distribution had a median near 16% and a long upper tail
The mean across the 163 reported observations was 19.41%, above the median of 16.34%. That difference reflects the influence of a relatively small group of high-share economies. The first quartile was 8.48% and the third quartile was 28.14%, so the middle half of reported values fell within roughly a twenty-percentage-point band. The 10th percentile was 3.37% and the 90th percentile was 39.31%, showing that the full distribution stretches well beyond the central range.
Sixteen economies were at or above 40%, and 33 were at or above 30%. At the other end, 49 were below 10% and 23 were below 5%. These counts make the metric easier to interpret than a rank alone. In some economies, transport is a major component of exported services; in others, the service export basket is dominated by other categories. The indicator does not identify which alternative service categories explain a low transport share, so that question requires additional balance-of-payments detail.
Mozambique and Ethiopia were the two highest reported values
Mozambique had the highest 2024 value at 78.44%, followed almost exactly by Ethiopia at 78.35%. Djibouti was third at 60.51%, Qatar fourth at 59.61%, Brunei Darussalam fifth at 53.78%, and Denmark sixth at 51.97%. The leading group spans several regions rather than forming a single continental cluster, which is an early warning against treating geography alone as an explanation.
| Economy | 2024 share |
|---|---|
| Mozambique | 78.44% |
| Ethiopia | 78.35% |
| Djibouti | 60.51% |
| Qatar | 59.61% |
| Brunei Darussalam | 53.78% |
| Denmark | 51.97% |
| Panama | 49.43% |
| Tajikistan | 48.22% |
| Nigeria | 48.11% |
| Lithuania | 46.92% |
Panama followed at 49.43%, Tajikistan at 48.22%, Nigeria at 48.11%, and Lithuania at 46.92%. A high percentage does not mean that an economy has one of the world’s largest transport-service export values in absolute currency terms. This is a composition measure. A smaller exporter can record a high share if transport is unusually important within its own service export basket, while a very large service exporter can have a low share when finance, travel, telecommunications, computer services, professional services, or other categories are larger.
The lower end falls to roughly 1%
Dominica had the lowest reported value at 0.81%, followed by Guinea-Bissau at 0.87%, Sao Tome and Principe at 1.11%, St. Lucia at 1.17%, and Andorra at 1.29%. The Bahamas was 1.39%, Guinea 1.59%, Timor-Leste 1.65%, West Bank and Gaza 1.66%, and Macao SAR, China 1.70%. The highest value was therefore about 97 times the lowest reported value.
A low share should not be interpreted as an absence of transport activity. Because the denominator is total service exports, the percentage can be small when other exported services are comparatively large. The indicator also does not directly measure domestic passenger movements, freight tonnage, port throughput, airport traffic, logistics employment, or transport infrastructure quality. Its scope is specifically the composition of service exports in the balance of payments.
Geographic proximity does not guarantee similar export structures
The map reveals several sharp neighboring contrasts. In eastern Africa, Ethiopia was 78.35% and Djibouti 60.51%, while Kenya was 27.27%. In southern Africa, Mozambique was 78.44% and Zimbabwe 41.80%, whereas South Africa was 12.46%, Botswana 5.40%, and Zambia 4.91%. These values do not form a smooth regional gradient; nearby economies can occupy very different parts of the distribution.
The Gulf also shows a mixed pattern. Qatar was 59.61%, the United Arab Emirates 39.39%, and Oman 32.97%, but Kuwait was 15.43%, Bahrain 14.11%, and Saudi Arabia 12.79%. Northern Europe has another striking contrast: Denmark was 51.97% and Norway 37.91%, compared with Sweden at 12.17% and Finland at 12.39%. In Central America, Panama stood out at 49.43%, while Costa Rica was 6.14%, Nicaragua 7.33%, and Honduras 5.63%. Geography matters for transport networks, but the export-service mix is clearly shaped by more than adjacency.
Large economies are spread across the middle and lower parts of the distribution
The United States recorded 8.87%, Canada 9.19%, and Mexico 16.34%. Germany was 20.66%, France 16.36%, the Netherlands 16.44%, Belgium 19.70%, and Poland 26.94%. In Asia, China was 21.00%, Japan 13.76%, India 8.90%, Indonesia 14.08%, Malaysia 14.52%, and Singapore 34.61%. The result is a broad mixture rather than a simple relationship between economic size and the transport share.
The Republic of Korea was 28.12%, almost identical to the third-quartile threshold of 28.14%. That places the observation near the boundary of the upper quarter of the reported distribution, but it does not by itself say anything definitive about logistics competitiveness, port efficiency, or the overall composition of national exports. It is one peer observation within a global balance-of-payments ratio.
Why a high share cannot be read as a transport competitiveness score
The ratio can reflect many underlying conditions: the role of an economy as a shipping or aviation hub, cross-border land transport, pipeline services, postal and courier activity, the scale of travel exports, financial and business services, digital services, and the overall size of the service-export denominator. BX.GSR.TRAN.ZS does not contain those explanatory variables, so causal claims cannot be made from the percentage alone.
Ratio indicators can also move because of changes in either the numerator or the denominator. Transport-service exports might be flat while other service exports rise, causing the transport share to decline. Conversely, the share might rise if other service categories weaken even when transport exports do not grow. A time-series explanation therefore requires the underlying transport-service export value, total service exports, and the main competing service categories for the same economy and years.
There were 163 reported values and 54 source-missing observations
The source file contains 217 World Bank country and economy rows for 2024 after aggregate regional and income-group rows are excluded. Of those, 163 have an observed value and 54 are preserved as source-missing. Missing values were not replaced with zero. All summary statistics, percentiles, rankings, and comparisons in this article use only the 163 reported observations.
The 217-row universe should not be read as a count of sovereign states. World Bank country/economy reporting includes some separately reported territories and other economies. That is why “163 reported economies” is more precise than claiming that 163 sovereign countries reported data. For visual integrity, the map also distinguishes source-missing values from reported observations rather than coloring missing places as if they had a zero share.
What to keep in mind when using the 2024 comparison
First, this is a single-year cross-section. It does not show whether an economy’s transport share is rising or falling over time. Second, it is a percentage of service exports rather than an absolute export value. Third, it follows balance-of-payments classification and reporting, so it should not be substituted for domestic transport output, freight volumes, transport employment, or infrastructure measures.
Used within those boundaries, the indicator is a concise way to compare how different service-export baskets are organized. In 2024, 33 reporting economies had shares of at least 30%, while 49 were below 10%. The very high values in Mozambique and Ethiopia, the very low values in several small economies, and the large contrasts among neighbors all point to the same conclusion: the composition of service exports varies sharply, and the map is most useful when read together with the distribution rather than as a standalone ranking.
Frequently Asked Questions
Which economy had the highest transport-services share in 2024?
Mozambique had the highest reported value at 78.44%, narrowly above Ethiopia at 78.35%.
Does a 50% value mean transport is half of all exports?
No. It means transport services equal 50% of service exports recorded in the balance of payments, not 50% of all goods and services exports.
Were missing observations treated as zero?
No. Fifty-four source-missing observations were kept missing, and the comparisons use only the 163 economies with reported 2024 values.
Related Articles
Green Map creates custom-edited map images using open geographic data sources such as geoBoundaries, Natural Earth, OpenStreetMap, and government open data. These maps are edited visual materials, not raw data files, and are provided for education, documents, presentations, and graphic reference.