The 2025 state comparison uses the U.S. Energy Information Administration’s annual heat-content series for distillate fuel oil. The fixed identity is the electricity/electric-power-operational-data route, the heat-content field, fuel facet DFO, and sector facet 99. There are 51 observations: the 50 states plus the District of Columbia. This is a fuel-property comparison, not a ranking of electricity generation, fuel consumption, power prices, plant efficiency, or total petroleum demand.
Across the 51 jurisdictions, the mean is 5.8041 and the median is 5.7977. Oklahoma has the highest recorded value at 5.9650, followed by New Jersey at 5.9566 and Montana at 5.9126. Alaska is lowest at 5.5791, with Colorado next at 5.6017 and Mississippi at 5.7106. The full max-to-min spread is 0.3859, while the coefficient of variation is only about 1.18%. The series therefore has a clear ranking but a comparatively tight numerical distribution.
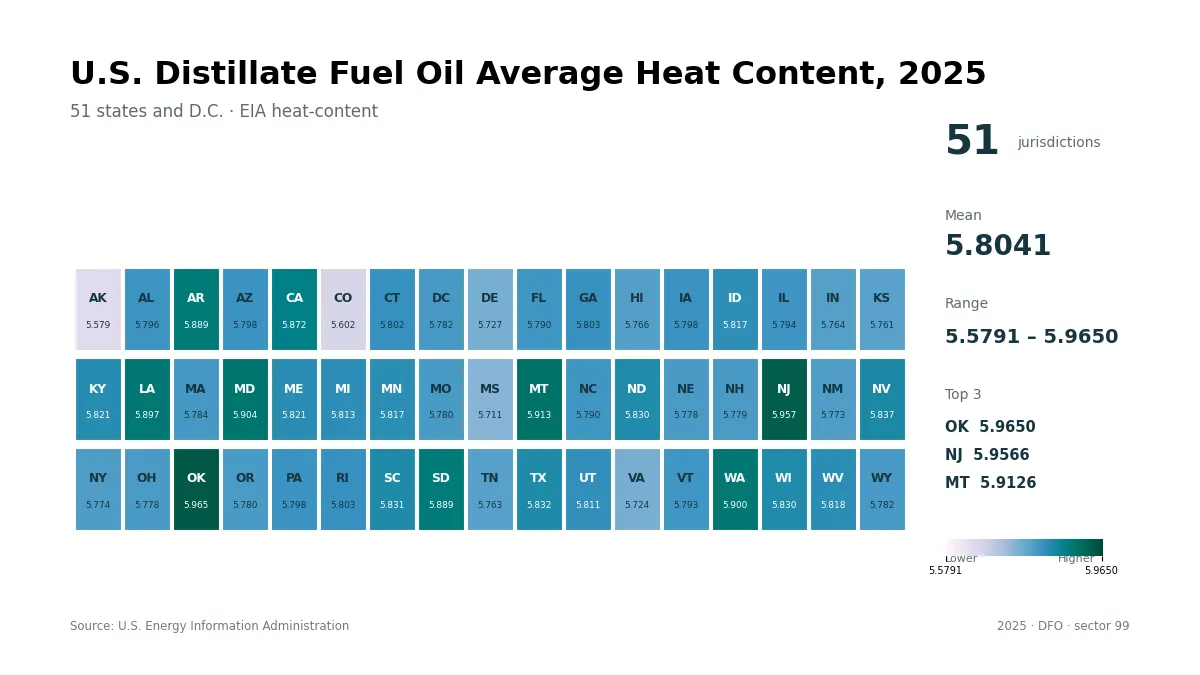
Table of Contents
What this heat-content series measures
Average heat content should not be read as fuel volume. A state with a higher heat-content value did not necessarily burn more distillate fuel oil, and the value does not tell us how much electricity the state generated. Heat content describes the energy associated with a physical amount of fuel. To estimate total energy input or compare fuel demand, a separate physical-consumption series is required. Keeping those concepts separate prevents a small difference in fuel characteristics from being mistaken for a large difference in fuel use.
The most important distributional feature is concentration around the center rather than a dramatic split between regions. Thirty-seven of the 51 observations fall within one percent of the overall mean. With a median of 5.7977, there are 25 jurisdictions above the median, 25 below it, and one exactly at the median. That balance means rank positions can change with very small differences, so the underlying values matter more than whether a state is, for example, eighth or twelfth.
A narrow distribution around the center
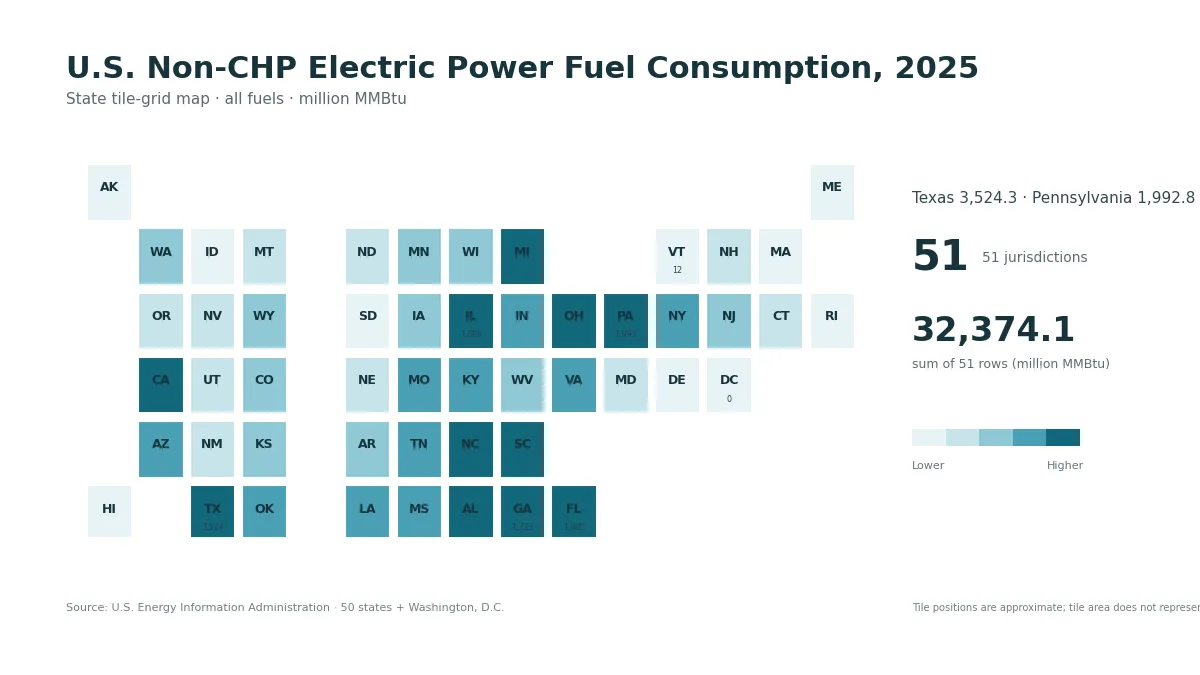
At the upper end, Oklahoma and New Jersey are the only two values above 5.95. Montana, Maryland, Washington, Louisiana, Arkansas, and South Dakota form another close group from roughly 5.889 to 5.913. California is also in the top ten at 5.8715. These differences are measurable, but they remain small in absolute terms. A color scale can make them look visually stronger than they are, which is why the range and summary statistics should be read together with the figure.
The lower tail has a slightly different shape. Alaska at 5.5791 and Colorado at 5.6017 are separated from most of the distribution, while Mississippi is already up to 5.7106. Virginia and Delaware sit just above 5.72, and then Kansas, Tennessee, Indiana, Hawaii, and New Mexico cluster near 5.76 to 5.77. That pattern shows why a single label such as ‘low-heat-content states’ would hide meaningful differences within the lower part of the ranking.
Why the top ranks need numerical context
The mean and median are separated by only about 0.0064. The first quartile is 5.7783 and the third quartile is 5.8297, so the middle half of the observations occupies a band only about 0.0515 wide. Compared with the full 0.3859 range, the interquartile band is very narrow. In practical terms, a handful of values at the ends create much of the total spread, while most jurisdictions sit in a much tighter central cluster.
Top 10 jurisdictions in 2025
| Rank | State / jurisdiction | Value |
|---|---|---|
| 1 | Oklahoma | 5.9650 |
| 2 | New Jersey | 5.9566 |
| 3 | Montana | 5.9126 |
| 4 | Maryland | 5.9039 |
| 5 | Washington | 5.9001 |
| 6 | Louisiana | 5.8972 |
| 7 | Arkansas | 5.8890 |
| 8 | South Dakota | 5.8886 |
| 9 | California | 5.8715 |
| 10 | Nevada | 5.8374 |
The lower end is not one uniform group
Oklahoma’s 5.9650 and New Jersey’s 5.9566 differ by just 0.0084. Montana and Maryland differ by 0.0087, and Washington and Louisiana are separated by only 0.0029. Those gaps are small enough that an ordered list should be treated as a precise description of the data, not as evidence of a large performance difference. Heat content is not a score, and higher is not automatically ‘better’ for every analytical purpose.
All 51 jurisdiction values
| State / jurisdiction | 2025 value |
|---|---|
| Oklahoma | 5.9650 |
| New Jersey | 5.9566 |
| Montana | 5.9126 |
| Maryland | 5.9039 |
| Washington | 5.9001 |
| Louisiana | 5.8972 |
| Arkansas | 5.8890 |
| South Dakota | 5.8886 |
| California | 5.8715 |
| Nevada | 5.8374 |
| Texas | 5.8316 |
| South Carolina | 5.8313 |
| Wisconsin | 5.8299 |
| North Dakota | 5.8295 |
| Kentucky | 5.8210 |
| Maine | 5.8205 |
| West Virginia | 5.8184 |
| Minnesota | 5.8170 |
| Idaho | 5.8168 |
| Michigan | 5.8132 |
| Utah | 5.8107 |
| Rhode Island | 5.8032 |
| Georgia | 5.8029 |
| Connecticut | 5.8019 |
| Iowa | 5.7985 |
| Pennsylvania | 5.7977 |
| Arizona | 5.7975 |
| Alabama | 5.7959 |
| Illinois | 5.7941 |
| Vermont | 5.7931 |
| North Carolina | 5.7898 |
| Florida | 5.7896 |
| Massachusetts | 5.7840 |
| District of Columbia | 5.7820 |
| Wyoming | 5.7815 |
| Missouri | 5.7799 |
| Oregon | 5.7796 |
| New Hampshire | 5.7786 |
| Nebraska | 5.7779 |
| Ohio | 5.7777 |
| New York | 5.7741 |
| New Mexico | 5.7731 |
| Hawaii | 5.7655 |
| Indiana | 5.7639 |
| Tennessee | 5.7625 |
| Kansas | 5.7612 |
| Delaware | 5.7274 |
| Virginia | 5.7241 |
| Mississippi | 5.7106 |
| Colorado | 5.6017 |
| Alaska | 5.5791 |
Mean, median, and quartiles
Looking at all 51 jurisdictions is especially useful for a metric with limited variation. Energy statistics can be shaped by the mix of plants, fuel procurement, reporting populations, and the specific fuel products represented in each state. A full-state table lets readers locate a state of interest and compare it with the mean, median, quartiles, and nearby values rather than relying only on a short list of extremes. It also makes the District of Columbia visible instead of silently dropping it from a 50-state narrative.
Four decimal places are retained because much of the distribution is tightly packed. Rounding every observation to two decimals would create many apparent ties and could obscure the actual ordering. Precision, however, should not be confused with importance. Reporting 5.9001 instead of 5.90 preserves the source value for comparison; it does not imply that every fourth-decimal difference has operational or policy significance. The context supplied by the range, quartiles, and coefficient of variation remains essential.
Why the District of Columbia is included
The District of Columbia is included because the EIA state-level series contains a comparable 2025 observation for D.C. Although it is not a state, excluding it simply to produce a 50-row table would change the coverage from the source and slightly alter the summary statistics. This article therefore uses 51 jurisdictions whenever it refers to the complete comparison and identifies D.C. explicitly rather than hiding it inside a generic state count.
Use the table for close comparisons
The 31 jurisdictions between the top ten and bottom ten are even more tightly grouped than the extremes. In that middle band, visual color differences are mainly a navigation aid. Readers should use the numeric table when the precise relationship between two states matters. A darker tile indicates a higher heat-content observation in this series only; it does not indicate more fuel consumption, more generation, a cleaner fuel mix, or greater plant efficiency.
A one-year snapshot is not a trend
This article is a cross-sectional view of 2025. It does not establish whether a state’s heat content rose or fell from 2024, whether the highest jurisdictions remain high over multiple years, or whether the lower observations are persistent. A time-series analysis would need the same heat-content field, DFO fuel facet, sector 99 definition, and compatible units for every year. Mixing another fuel, sector, or consumption field into the sequence would change the statistical meaning of the comparison.
A caution about the unit label
The unit label deserves caution. The EIA series record associated with this comparison labels the unit as ‘Btu per short tons,’ while EIA public heat-content documentation commonly describes distillate fuel oil in million Btu per barrel. The observed values near 5.8 are also on the scale seen in EIA’s published barrel-based heat-content references. For that reason, this article does not perform a conversion between tons and barrels. It reports the state observations exactly as values and treats the unit interpretation as something to verify against the source definition before using the figures in an engineering calculation.
What the series cannot explain
The data also cannot explain causes by themselves. If a state is near the top, the series does not reveal whether the difference comes from the mix of distillate products, sulfur categories, procurement patterns, plant types, or other reporting factors. Those questions require plant-level EIA-923 information or other primary records. The state series is strongest as a descriptive comparison: it identifies the magnitude, center, spread, and outliers without assigning an unsupported cause.
EIA energy tables contain many similarly named measures, so field identity matters. Distillate fuel oil can appear in consumption, heat-content, receipts, stocks, total-consumption-btu, and generation-related series. Those measures answer different questions and may use different units. The comparison here intentionally stays with heat-content rather than mixing another EIA field into the ranking. That keeps all 51 observations directly comparable within one statistical definition.
Geography does not show a simple regional rule
Geography should likewise be interpreted carefully. Neighboring states do not necessarily have adjacent values, and distant states can be nearly identical. Washington is near the upper end while nearby western states occupy several different positions; Louisiana is high while Mississippi is much lower. These contrasts do not prove a climate or regional effect. They show that broad regional labels are too coarse for explaining a tightly distributed fuel-property measure.
How to use the measure with other EIA series
For practical use, a good sequence is to locate the jurisdiction of interest, compare its value with the national mean and median of this 51-row set, and then consult a separate EIA consumption series if the question concerns fuel quantity. A generation series can be added when the question concerns electricity output. That layered approach preserves the meaning of each metric and produces a more reliable energy profile than a single rank table can provide.
Summary of the 2025 pattern
Overall, the 2025 state pattern is one of small differences around a stable center. Oklahoma and New Jersey lead the ranking, Alaska and Colorado are at the low end, and 37 of the 51 jurisdictions sit within one percent of the mean. The most useful reading is therefore not ‘which state wins,’ but how narrow the distribution is and how carefully the metric must be separated from consumption, generation, cost, and emissions.
Frequently Asked Questions
Which jurisdiction has the highest 2025 distillate fuel oil heat-content value?
Oklahoma is highest at 5.9650, followed by New Jersey at 5.9566 and Montana at 5.9126 in this EIA series.
Does a higher heat-content value mean a state consumed more distillate fuel oil?
No. Heat content is a fuel-property measure, not a fuel-volume measure. A separate consumption series is needed to compare how much fuel was used.
Why are there 51 jurisdictions instead of 50 states?
The 2025 EIA state-level series includes a comparable observation for the District of Columbia, so the complete coverage is 50 states plus D.C.
Related Articles
Green Map creates custom-edited map images using open geographic data sources such as geoBoundaries, Natural Earth, OpenStreetMap, and government open data. These maps are edited visual materials, not raw data files, and are provided for education, documents, presentations, and graphic reference.