This comparison uses annual 2024 observations from the U.S. Energy Information Administration to examine distillate fuel oil consumed for electricity generation across all 50 states and Washington, D.C. The metric is the EIA field consumption-for-eg-btu with the DFO fuel facet and a common unit of million MMBtu. It is not total petroleum consumption, highway diesel demand, heating-oil use, or electricity generation itself. The scope is narrower: thermal energy from distillate fuel oil that the selected EIA operational series records as fuel input for electricity generation.
The 51 jurisdiction rows sum to 55.71978 million MMBtu. Hawaii is highest at 14.565, followed by Alaska at 5.492 and Maryland at 2.772. Hawaii alone represents 26.1% of the row sum; the top three account for 41.0% and the top ten for 64.6%. The mean is 1.093, while the median is only 0.53943, showing a strongly right-skewed distribution in which a few large observations pull the average upward.
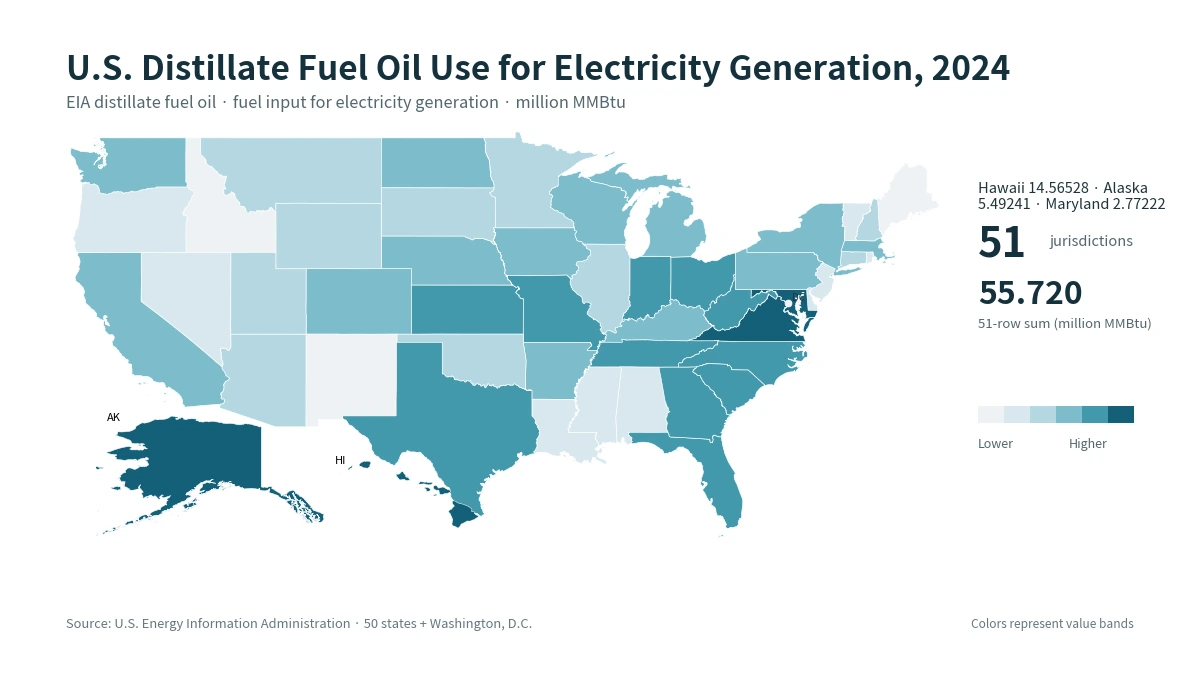
Table of Contents
What the EIA series actually measures
The metric is a fuel-input measure expressed in thermal units. That is different from electricity output measured in megawatt-hours. Plants can convert the same amount of fuel into different amounts of electricity depending on technology, efficiency, operating conditions, and load. A state with a high fuel-input value therefore does not automatically have the same rank in electricity generation, and a low value does not imply low electricity production overall. The dataset should be used to compare the scale of one fuel input under a fixed definition.
The fuel facet is fixed to DFO, the EIA distillate fuel oil category. The analysis does not merge residual fuel oil, natural gas, coal, or other petroleum products into the series, and it does not impute missing observations from another year. The 2024 EIA state table contains a value for every one of the 51 jurisdictions. Keeping the field, fuel category, annual frequency, sector facet, unit, and year unchanged is essential because a similar-looking EIA title can refer to a statistically different series when one of those dimensions changes.
States with the largest 2024 values
Hawaii leads at 14.565 million MMBtu, about 2.65 times Alaska’s 5.492. Maryland is third at 2.772, followed by Virginia, Missouri, Texas, North Carolina, Florida, Ohio, and Kansas. These are absolute quantities. They are not adjusted for state population, GDP, generating capacity, electricity sales, or total generation, so the ranking should be read as the size of distillate-fuel-oil input for the selected generation purpose rather than as an efficiency or intensity ranking.
| Rank | State | 2024 value (million MMBtu) |
|---|---|---|
| 1 | Hawaii | 14.565 |
| 2 | Alaska | 5.492 |
| 3 | Maryland | 2.772 |
| 4 | Virginia | 2.528 |
| 5 | Missouri | 2.107 |
| 6 | Texas | 1.999 |
| 7 | North Carolina | 1.824 |
| 8 | Florida | 1.781 |
| 9 | Ohio | 1.474 |
| 10 | Kansas | 1.437 |
Concentration is substantial. Hawaii accounts for 26.1% of the 51-row sum. The top three account for 41.0%, the top five for 49.3%, and the top ten for 64.6%. These percentages are calculated directly from the 51 state-and-D.C. observations in the 2024 EIA state table; they are not copied from a separate national aggregate series. Using the same row set as the denominator keeps the comparison reproducible even if a national total has a different accounting scope or later revision.
Why the median is much lower than the mean
The mean across the 51 jurisdictions is 1.093 million MMBtu, but the median is 0.53943. Colorado is the middle observation when the values are ordered. The first quartile is 0.20528 and the third quartile is 1.10434, so half of the jurisdictions lie approximately between those two values. The mean is about 2.03 times the median because Hawaii, Alaska, and several other large observations stretch the upper tail.
This skew is also why the map uses value bands rather than a simple visual scale dominated by the maximum. If every state were colored only in proportion to Hawaii, many of the smaller but meaningful differences would be difficult to see. The map is best for locating broad spatial patterns, while the tables are better for exact comparisons. Neither the mean nor the map color should be interpreted as a per-capita measure or as fuel efficiency per unit of electricity produced.
Very small values are still positive observations
The smallest observation is Washington, D.C. at 0.00040 million MMBtu. Idaho follows at 0.00049, and New Mexico at 0.01135. These are positive source values, not missing entries converted to zero. Because rounding to three decimals could make D.C. and Idaho appear as 0.000, the low-value table preserves additional decimal places. Maine, Vermont, Rhode Island, Mississippi, Nevada, Louisiana, and Oregon also appear among the ten smallest observations.
| Rank from low | State or district | 2024 value (million MMBtu) |
|---|---|---|
| 1 | District of Columbia | 0.00040 |
| 2 | Idaho | 0.00049 |
| 3 | New Mexico | 0.01135 |
| 4 | Maine | 0.01340 |
| 5 | Vermont | 0.05217 |
| 6 | Rhode Island | 0.05803 |
| 7 | Mississippi | 0.07234 |
| 8 | Nevada | 0.07323 |
| 9 | Louisiana | 0.10674 |
| 10 | Oregon | 0.13828 |
A small DFO value does not mean that a jurisdiction produces little electricity or uses no petroleum. It means that this particular fuel category is small within this specific electricity-generation fuel-input series. A state may rely mainly on natural gas, coal, nuclear, hydroelectricity, wind, solar, or other sources. It may also use petroleum in sectors or products that are outside this series. Converting the bottom of this ranking into a judgment about energy reliability, affordability, or environmental performance would therefore go beyond the evidence in the dataset.
The dataset shows where fuel use is large, not why
Hawaii and Alaska stand out on the map, but this state-level series does not contain the causal variables needed to explain their positions. Generating-unit configuration, fuel logistics, grid interconnection, reserve or backup operation, weather, plant outages, and the availability of alternative fuels could all matter. The single series cannot tell us which factor is decisive or quantify its contribution. For that reason, the analysis avoids turning geographic coincidence into a causal claim.
A deeper explanation would require additional 2024 EIA series such as generation by fuel, installed capacity, plant-level operations, and possibly fuel cost or stock data, all matched to the same geography and reporting scope. Those additions could help distinguish whether a large DFO input mainly reflects a larger generation role for the fuel, a particular operating pattern, or other system characteristics. The comparison therefore focuses on the reported state-level input values and descriptive statistics calculated from those observations.
What the top-ten concentration means
The ten largest jurisdictions sum to 35.97957 million MMBtu, which is 64.6% of the 51-row total. Hawaii and Alaska together account for 36.0%. This concentration means changes in a relatively small number of states can noticeably alter the annual state-level distribution. It also explains why the national pattern cannot be summarized well by a single typical value.
However, this concentration is not a petroleum-market share, electricity-sales share, or share of total U.S. power generation. The numerator is thermal fuel input from the selected DFO series, and the denominator is the sum of the same 51 observations. Refinery output, retail fuel sales, generation ownership, and electricity revenues are different statistical concepts. Similar percentages across those datasets would not make them interchangeable.
The geography is not confined to one U.S. region
The top of the distribution spans multiple parts of the country. Hawaii and Alaska lead outside the contiguous states, while Maryland and Virginia are high in the East, Missouri and Ohio appear in the Midwest, and Texas, North Carolina, and Florida rank high in the South. Kansas also enters the top ten. That spread is a useful reminder that distillate fuel oil use for power generation is not represented by a single regional pattern in this 2024 snapshot.
The low end is similarly diverse. Very small values appear in Washington, D.C., Idaho, New Mexico, Maine, Vermont, and several other states with different generation systems. Similar map colors do not imply the same operational reason. A choropleth can identify where observations are relatively large or small, but it cannot substitute for plant-level or fuel-mix analysis. Spatial description and causal explanation should remain separate.
How to compare 2024 with another year correctly
This is a one-year cross-section. It should not be described as a long-term trend without retrieving comparable observations for additional years. Distillate fuel oil use for electricity generation can change with fuel prices, weather, outages, changes in generating units, reserve operation, and the availability of other fuels. A state that is high in 2024 is not necessarily always high, and a low observation does not establish a persistent structural pattern.
For a valid time comparison, the EIA route alone is not enough. The field must remain consumption-for-eg-btu, fueltypeid must remain DFO, the sector facet and annual frequency must match, and the unit must remain million MMBtu. Changing any one of these dimensions creates a different statistical series even if the human-readable title still contains the words “fuel consumption” and “electricity generation.” For reproducibility, the EIA source URL and the full series dimensions should be checked alongside the reported values.
What this dataset can and cannot support
The data support statements about which jurisdictions had the largest or smallest 2024 DFO fuel input for electricity generation, the shape of the state-level distribution, and concentration shares calculated from the 51 observations. They do not by themselves support conclusions about generation efficiency, electricity prices, carbon emissions, outage risk, refinery production, petroleum supply security, or household energy use. Each of those questions requires additional variables or a different denominator.
For example, pairing fuel input with electricity generation could support an input-per-MWh measure, while combining the series with capacity could help examine utilization patterns. Those would be separate metrics requiring their own definitions and denominators. Here, the comparison is limited to the reported 2024 values and straightforward descriptive calculations such as sums, means, medians, quartiles, rankings, and shares of the same 51-row total.
Key numbers from the 2024 comparison
Hawaii records 14.565 million MMBtu, Alaska 5.492, and Maryland 2.772. The 51-row sum is 55.71978, the mean is 1.093, the median is 0.53943, and the top ten account for 64.6% of the sum. There are no missing jurisdictions in the 2024 EIA table, and tiny positive values such as Washington, D.C. at 0.00040 are retained rather than rounded into artificial zeros.
When this series is compared with other EIA fuel-use datasets, a sound comparison starts by checking the API field, fuel facet, sector facet, year, frequency, and unit. Two datasets can both describe fuel used for electricity generation while representing different fuel groups or reporting scopes. Keeping those dimensions fixed ensures like-for-like comparisons and avoids mixing neighboring EIA series that describe different fuel or sector scopes.
Frequently Asked Questions
Does this measure all diesel or petroleum consumption in each state?
No. It is the 2024 EIA thermal fuel-input series for distillate fuel oil used for electricity generation. Transportation diesel and other petroleum consumption are outside this metric.
Are the Washington, D.C. and Idaho values zero?
No. Washington, D.C. is 0.00040 and Idaho is 0.00049 million MMBtu. They are positive observations that would only look like 0.000 if rounded too aggressively.
Can this dataset explain why Hawaii is highest?
Not by itself. It measures fuel input. Explaining the ranking would require additional data on generation, capacity, fuel mix, plant operations, and other system characteristics.
Related Articles
Green Map creates custom-edited map images using open geographic data sources such as geoBoundaries, Natural Earth, OpenStreetMap, and government open data. These maps are edited visual materials, not raw data files, and are provided for education, documents, presentations, and graphic reference.