World Bank data for 2024 provide a female secondary gross enrollment ratio for 109 countries and economies. Another 108 of the 217 rows have no 2024 observation. Among the valid values, the median is 94.53% and the simple mean is 92.38%. Monaco is highest at 159.42%, followed by Finland at 150.74% and Sweden at 141.03%. At the lower end, Chad records 19.44%, Niger 19.54%, and Burkina Faso 33.24%. The range is unusually wide, and 36 observations exceed 100%, so the indicator needs to be read according to its formal definition rather than as a percentage with a hard ceiling.
The World Bank series SE.SEC.ENRR.FE is the female secondary gross enrollment ratio. Its numerator includes every female student enrolled in secondary education regardless of age, while the denominator is the female population in the official age group for that level. Students who enter late, repeat grades, return after interruption, or enter early can therefore be included even when they fall outside the theoretical secondary-school age. A value of 120% does not mean that 120% of official-age girls are enrolled; it means that total female secondary enrollment is equivalent to 120% of the size of the official-age female population.
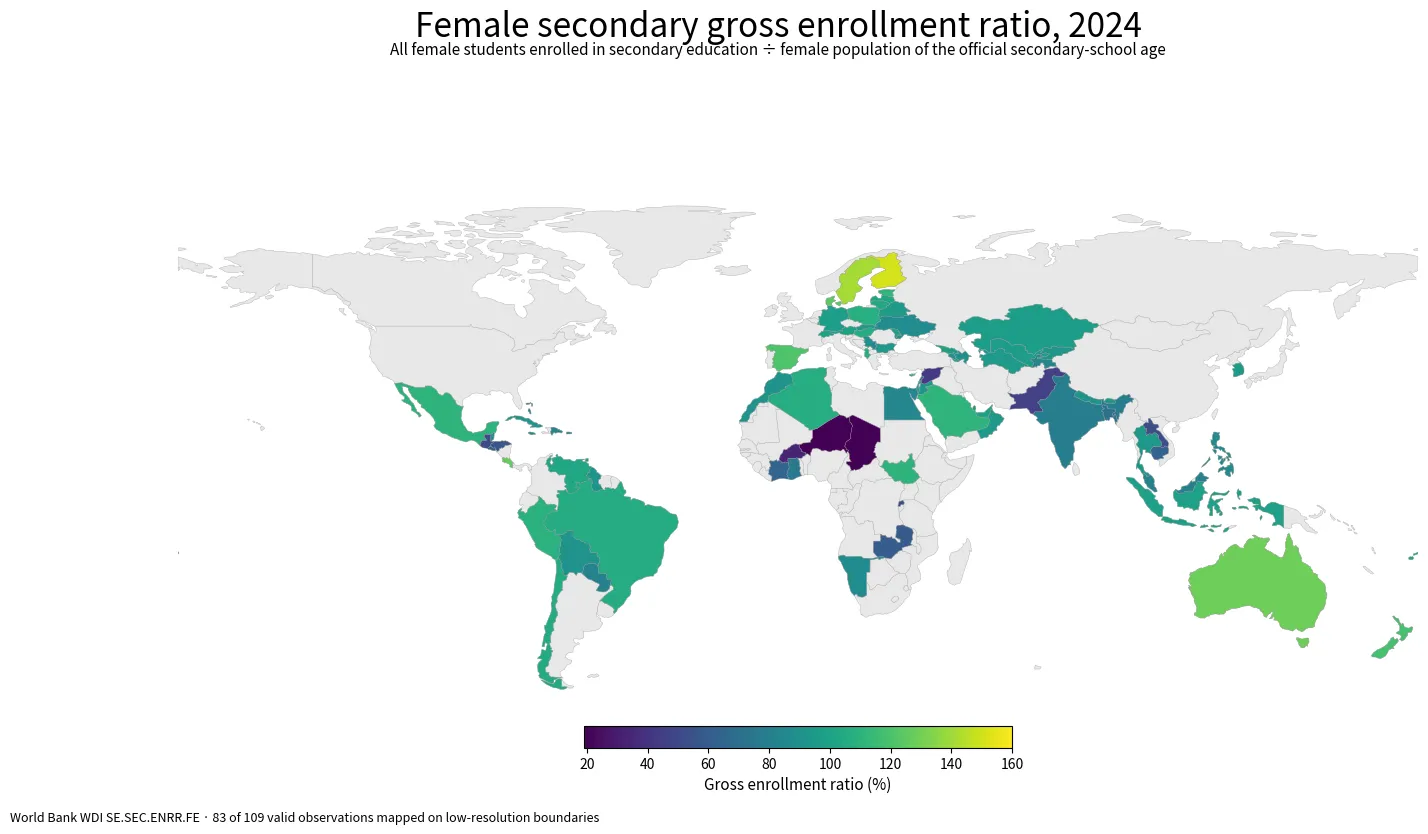
Table of Contents
The center of the distribution is in the 90s, but the tails are far apart
The 25th percentile of the valid observations is 83.92% and the 75th percentile is 104.40%. In other words, the middle half of reporting economies lies within a band of roughly 20 percentage points that crosses the 100% line. Seventy-three observations are at least 90%, 36 are at least 100%, and only five are below 50%. Those very low observations pull the mean below the median even though the upper tail extends beyond 140% and 150%.
The 92.38% mean is an unweighted average across reporting economies, not a global female enrollment rate weighted by population. A very large country and a small island economy each contribute one observation. To calculate a true global ratio, one would need country-level counts of enrolled female students and the corresponding official-age female populations and then aggregate those numerators and denominators. The statistics here answer a different question: how do same-year country-level ratios vary among the 109 economies with a usable 2024 observation?
Thirty-six values above 100% are valid gross-enrollment observations
The upper end includes Monaco at 159.42%, Finland at 150.74%, Sweden at 141.03%, Australia at 129.09%, Aruba at 128.75%, Costa Rica at 126.32%, St. Vincent and the Grenadines at 125.95%, Denmark at 124.97%, Spain at 120.84%, and New Zealand at 118.34%. These values should not be capped at 100 or discarded merely because they exceed a familiar percentage boundary. Gross enrollment was designed to count all students enrolled at the level, including those whose age differs from the official age range.
Small populations can make the ratio especially sensitive to the size of the age-group denominator, migration, repetition, delayed progression, and population estimates. The same conceptual issue also applies to larger countries: if many enrolled students are older or younger than the theoretical age group, the gross ratio can rise above 100%. A high value therefore describes the scale of enrollment relative to the official-age population. It does not by itself prove high learning quality, timely grade progression, low dropout, or universal completion.
| Country or economy, 2024 | Female secondary gross enrollment ratio |
|---|---|
| Monaco | 159.42% |
| Finland | 150.74% |
| Sweden | 141.03% |
| Australia | 129.09% |
| Aruba | 128.75% |
| Costa Rica | 126.32% |
| St. Vincent and the Grenadines | 125.95% |
| Denmark | 124.97% |
| Spain | 120.84% |
| New Zealand | 118.34% |
Only five valid observations fall below 50%
The bottom of the 2024 distribution starts with Chad at 19.44%, Niger at 19.54%, Burkina Faso at 33.24%, the Syrian Arab Republic at 41.81%, and Pakistan at 46.48%. Guatemala follows at 50.48%, Lao PDR at 51.00%, Rwanda at 53.32%, Honduras at 56.21%, and Zambia at 59.07%. A low ratio means that total female secondary enrollment is small relative to the size of the official secondary-school-age female population. It does not identify the cause of that shortfall.
Explaining a low observation would require additional evidence. School availability, household resources, conflict, safety, travel distance, early marriage, domestic responsibilities, grade repetition, transitions from primary school, and national education structures may matter in different places, but none can be inferred from this single series alone. Gross enrollment is strongest as a descriptive measure of enrollment scale and weakest when used as a stand-alone causal explanation.
| Country or economy, 2024 | Female secondary gross enrollment ratio |
|---|---|
| Chad | 19.44% |
| Niger | 19.54% |
| Burkina Faso | 33.24% |
| Syrian Arab Republic | 41.81% |
| Pakistan | 46.48% |
| Guatemala | 50.48% |
| Lao PDR | 51.00% |
| Rwanda | 53.32% |
| Honduras | 56.21% |
| Zambia | 59.07% |
Africa contains sharp contrasts rather than one uniform pattern
The African observations span a broad range. Algeria reports 106.53%, Morocco 91.25%, Egypt 83.92%, and Ghana 76.43%, while Chad and Niger are around 19% and Burkina Faso is 33.24%. Those differences are large enough that a single continental average would hide much of the country-level pattern. The map is useful for locating clusters, but neighboring countries can still have very different ratios because education systems and population structures differ.
Missing data also matter when reading the map. The source contains 108 economies without a 2024 value, and several small islands or separately reported territories do not have their own polygon in the generalized boundary layer. A blank area is therefore not automatically a low-enrollment area. Actual low values should be identified from the data and tables, while the map is best used to understand broad spatial patterns among the observations that can be joined to geography.
South Asia and Southeast Asia show large differences within each region
In South Asia, Pakistan records 46.48%, Bangladesh 70.47%, India 78.72%, Nepal 90.89%, and Bhutan 94.04%. The gap between the lowest and highest of these observations is nearly 48 percentage points. This shows that female secondary enrollment relative to the official-age population is far from uniform across the region. It still does not establish which system performs better overall because official age ranges, repetition, progression, and school structures can differ.
In Southeast Asia, Lao PDR is at 51.00%, Cambodia 63.10%, Malaysia 81.54%, the Philippines 86.12%, Thailand 94.06%, and Indonesia 98.67%. These figures show a steady spread from roughly half of the official-age population size to almost parity between total enrollment and that population. Whether students remain enrolled through the end of secondary school, complete on time, or achieve strong learning outcomes requires separate indicators.
Europe often sits above 100%, while Latin America combines high and low observations
Several European observations are above 100%: Finland is 150.74%, Sweden 141.03%, Denmark 124.97%, Spain 120.84%, Norway 115.50%, and France 104.37%. Germany is 97.71%. The pattern reinforces the point that gross enrollment is not a bounded test score. Students outside the official age range remain in the numerator, so values above 100% can be consistent with the indicator definition.
Latin American observations also vary sharply. Costa Rica records 126.32%, Mexico 109.98%, Brazil 105.25%, and Chile 104.45%, compared with Honduras at 56.21% and Guatemala at 50.48%. Geographic proximity alone does not explain those gaps. A fuller explanation would require evidence on school transitions, repetition, dropout, rural access, household conditions, official school ages, and demographic structure.
A female-only series cannot establish a gender gap on its own
This dataset contains the female gross enrollment ratio, not a paired female-versus-male comparison. It therefore cannot show whether female enrollment is higher or lower than male enrollment in any country, whether the gender gap is widening, or whether parity has been reached. A proper gender comparison would require the male series for the same year and definition and then a direct comparison of the two observations. A high female ratio by itself is not proof of gender equality.
The same caution applies to educational outcomes. High female enrollment does not automatically imply high completion, regular attendance, strong learning, or smooth transition to tertiary education. Gross enrollment answers a narrower question about the scale of participation in secondary education relative to the official-age female population. It is a useful starting point, but completion, learning, attendance, and gender-parity indicators are needed for a broader assessment.
The 108 missing observations must not be converted to zero
Of the 217 country and economy rows, 109 contain a valid 2024 value and 108 are source-missing. Replacing missing observations with zero would invent extremely low enrollment records, distort the mean and median, and mix non-reporting with actual low values such as 19% or 33%. There are no genuine zero observations in the valid data. Every descriptive statistic and ranking in this article therefore uses only the 109 reported values.
This coverage limitation means the analysis is not a complete ranking of all 217 rows. One could increase coverage by taking each economy’s latest available observation, but doing so would mix different years and weaken temporal comparability. Keeping the reference year fixed at 2024 produces a cleaner same-year comparison even though it leaves more missing entries. The correct scope is therefore 109 reporting economies in 2024.
The low-resolution map directly joins 83 of the 109 valid observations
The generalized world boundary layer joins 83 of 109 valid observations (76.1%) through ISO3 codes. Some small islands and separately reported economies do not have an independent polygon at this map resolution. Their values remain in the tables and distribution statistics even when they cannot be colored on the map. A missing shape is therefore not equivalent to a missing statistical observation.
Map area also changes visual emphasis. Large countries occupy many pixels while small economies can be nearly invisible even when they have extreme values. Monaco, which has the highest observation, is a good example. The map should be read together with the top and bottom tables, the median, and the interquartile range rather than treated as a complete ranking by itself.
Gross enrollment, net enrollment, completion, and learning measure different things
Gross enrollment asks how total female enrollment at the secondary level compares with the official-age female population. Net enrollment restricts the numerator to students who are actually within the official age range. Completion indicators ask whether students reach or finish the end of the level, while learning assessments measure skills or knowledge. These measures can move differently and should not be substituted for one another.
A country can have a gross ratio above 100% and still face delayed progression or dropout. Another country can have a ratio in the 90s and strong learning results. Determining which combinations occur requires additional data. What the 2024 series directly shows is a wide cross-country spread in the scale of female secondary enrollment, with the central half between 83.92% and 104.40% and the full observed range from 19.44% to 159.42%.
Source and interpretation rules
The source is the World Bank World Development Indicators series SE.SEC.ENRR.FE, measured in percent for 2024. The analysis uses individually reported countries and economies rather than regional or income aggregates. Missing observations remain missing, and values above 100% are preserved because they are consistent with the official gross-enrollment definition. The geographic visualization uses a generalized world boundary layer linked by ISO3 codes.
Three rules summarize the safest interpretation. First, gross enrollment can exceed 100% because students outside the official age group are included. Second, missing data are not zero. Third, the female series alone does not establish either education quality or a gender gap. With those limits in place, the map and statistics provide a clear same-year picture of how widely female secondary enrollment ratios differ across reporting economies.
Frequently Asked Questions
Can the female secondary gross enrollment ratio exceed 100%?
Yes. Gross enrollment counts all female students enrolled at the level regardless of age, while the denominator is the official secondary-school-age female population.
Do the 108 economies without a 2024 observation have a 0% ratio?
No. They are missing source observations and must remain separate from real low or zero values.
Can the female series alone show the gender gap in secondary enrollment?
No. A gender comparison requires the male series for the same year and definition so the two values can be compared directly.
Related Articles
Green Map creates custom-edited map images using open geographic data sources such as geoBoundaries, Natural Earth, OpenStreetMap, and government open data. These maps are edited visual materials, not raw data files, and are provided for education, documents, presentations, and graphic reference.