The 2022 World Bank series provides a value for 152 countries and economies and leaves 65 observations missing. Across the reported economies, the median share of medium- and high-tech products in manufactured exports is 31.53%, while the mean is 33.01%. The Philippines records the highest value at 80.02%, followed closely by the Central African Republic, Japan and Mexico. Iraq sits at the other end with 0.04%.
The denominator matters. TX.MNF.TECH.ZS.UN does not measure the share of all exports that are advanced products. It measures the share of manufactured exports classified by UNIDO as medium or high technology. The indicator therefore describes the technological composition of a manufacturing export basket, not the size of that basket and not a country’s overall technological capability.
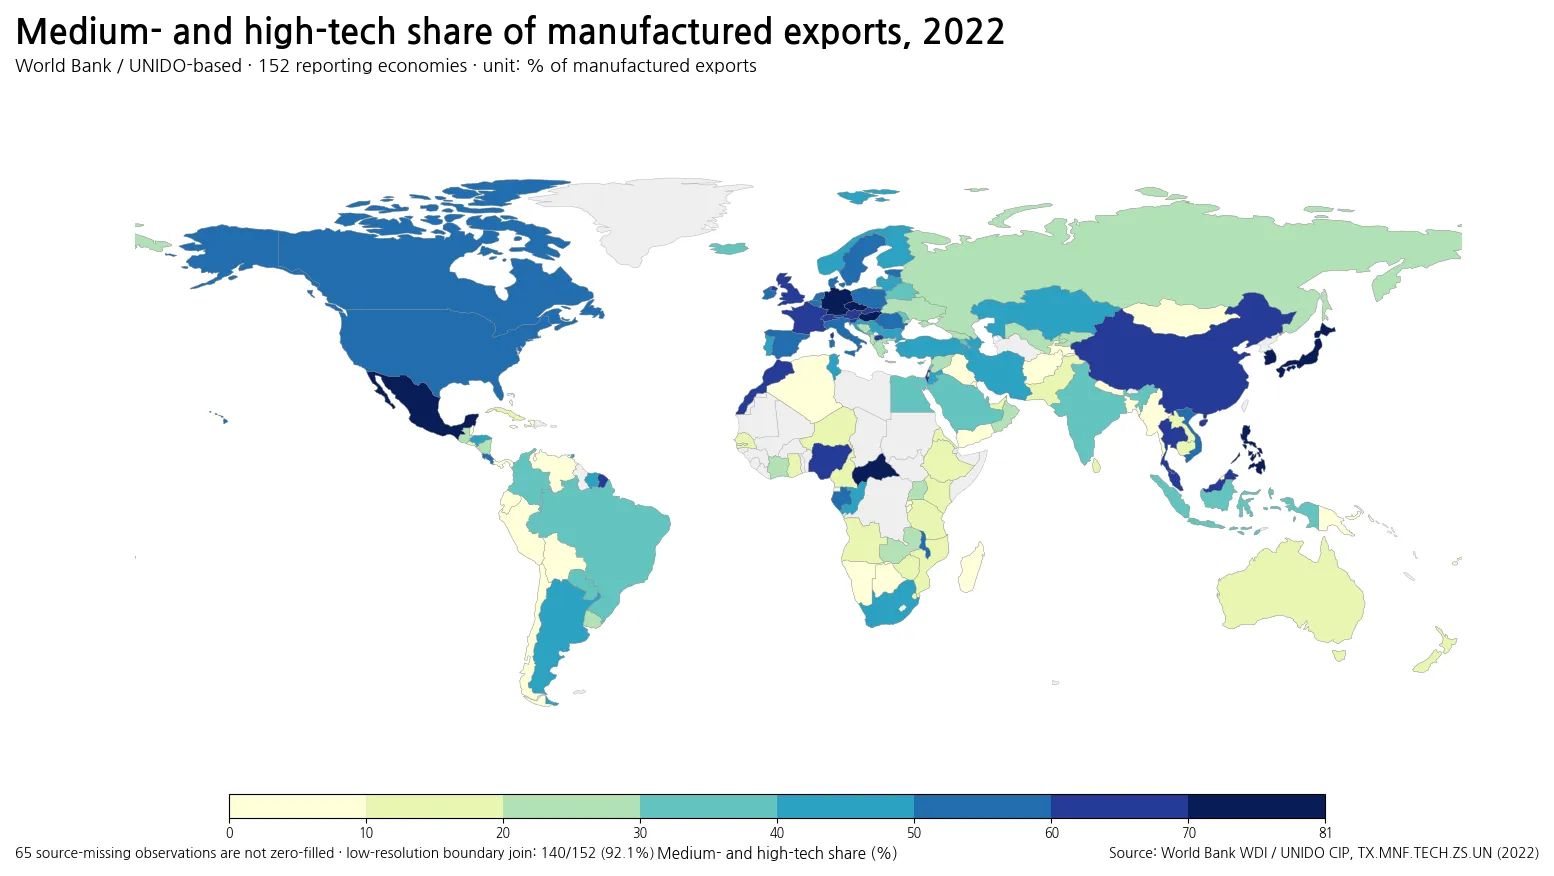
Table of Contents
The middle of the distribution is near 32%, but the range is exceptionally wide
The first quartile is 12.04%, the median is 31.53% and the third quartile is 51.62%. Half of the reporting economies therefore lie between roughly 12.0% and 51.6%. The 90th percentile reaches 65.70%. Only 10 economies are at or above 70%, while 31 are below 10%. A single average cannot capture that spread.
The interval counts make the dispersion visible: 31 observations are under 10%, 24 are between 10% and 20%, 19 between 20% and 30%, 17 between 30% and 40%, 21 between 40% and 50%, 16 between 50% and 60%, 14 between 60% and 70%, and 10 are at least 70%. The series spans almost the entire 0–80% range rather than clustering tightly around one global norm.
The Philippines, Japan and Mexico have very high shares, not necessarily the largest export values
The Philippines reports 80.02%, the Central African Republic 79.63%, Japan 78.43% and Mexico 78.22%. Hungary, Singapore, Germany and Czechia also sit near or above 70%. These figures mean that medium- and high-tech categories account for a large fraction of each economy’s manufactured export basket.
They do not establish which economy exports the largest dollar amount of medium- and high-tech goods. A small manufacturing export base can produce a high percentage if it is concentrated in the qualifying categories. A much larger exporter can show a lower percentage because resource-based or low-technology manufactured products occupy a larger part of its basket. Absolute trade values require a different dataset.
| Country or economy | Medium/high-tech share |
|---|---|
| Philippines | 80.02% |
| Central African Republic | 79.63% |
| Japan | 78.43% |
| Mexico | 78.22% |
| Hungary | 75.19% |
| Singapore | 73.50% |
| Korea, Rep. | 71.87% |
| Germany | 71.71% |
| Malta | 70.87% |
| Czechia | 70.66% |
The Central African Republic is a reminder that a ratio is not an industrial-capacity score
The Central African Republic appears near the top at 79.63%. That should not be interpreted as evidence that its industrial system is comparable in scale or complexity with Japan or Germany. The indicator contains no direct measure of manufacturing output, R&D spending, domestic value added, employment, patenting or the depth of supplier networks.
Ratios can also move sharply when the denominator is small. A limited number of qualifying products can dominate a narrow manufactured export basket, and re-export patterns or changes in a few product lines can alter the share substantially. The value is still a valid observation of export composition, but explaining why it is high requires product-level net-export data and information about the size and origin of production.
East and Southeast Asia contain several of the highest manufacturing-export shares
Japan stands at 78.43%, the Philippines at 80.02%, Singapore at 73.50%, Malaysia at 63.18%, Thailand at 61.93%, China at 60.47% and Viet Nam at 57.48%. The map therefore shows a broad belt of medium-to-high values across major Asian manufacturing exporters.
The region is not uniform. Indonesia records 32.04%, India 33.83% and Australia 14.95%. Those differences describe the mix of manufactured goods being exported, not an all-purpose ranking of technology policy. Countries can have strong capabilities in specific industries while still carrying a large share of low- or resource-based manufacturing in total manufactured exports.
Central Europe forms a visible cluster of high values
Hungary reports 75.19%, Germany 71.71%, Czechia 70.66%, the Slovak Republic 69.91% and Switzerland 69.87%. Poland is also above half at 53.91%. On the map, several neighboring economies fall into the upper classes, creating one of the clearest regional clusters.
Western Europe also includes substantial shares: the United Kingdom is 63.43%, France 61.31% and Ireland 59.71%. The aggregate indicator does not reveal whether vehicles, pharmaceuticals, electrical equipment, machinery or another group is driving a particular country’s result. That requires the underlying SITC product detail.
Mexico stands out within North America
Mexico reaches 78.22%, compared with 59.63% in the United States and 50.37% in Canada. All three sit above the global median, but the gap between Mexico and its neighbors is sizable. The contrast reflects different manufacturing export mixes within a closely connected trading region.
A higher share can arise because qualifying exports grow faster, because other manufactured exports grow more slowly, or because the denominator contracts. For that reason, a change in the percentage is not automatically the same as growth in the value of medium- and high-tech exports. A full trade analysis would track both the ratio and the corresponding export values.
South America displays a sharp contrast between mid-range and low shares
Argentina records 41.95%, Colombia 39.32% and Brazil 34.01%, placing them around the middle-to-upper part of the distribution. Chile, by contrast, stands at 7.60% and Peru at 5.63%. Neighboring economies can therefore have very different technological compositions inside their manufactured exports.
The ratio also says nothing about how large manufacturing is within total merchandise exports. An economy dominated by minerals or agricultural commodities may have a relatively small manufacturing export base, and this indicator then divides qualifying technology products only by that manufacturing subset. It should not be confused with the medium- and high-tech share of all merchandise exports.
Africa contains both very high outliers and much lower values
Nigeria reports 67.83%, South Africa 45.27%, Egypt 35.59%, Kenya 18.52% and Ethiopia 14.95%. The Central African Republic is an extreme high observation, while Angola is close to 12%. Geographic proximity clearly does not translate into a common export composition across the continent.
A high percentage should not be used as a stand-alone proxy for innovation capacity, and a low percentage does not imply the absence of technology-intensive activity. The mix is influenced by what is exported, the size of the manufacturing denominator and the classification of individual products. Manufacturing value added, productivity, R&D, patents and skilled employment answer different questions and can complement this series.
At the bottom, several economies report less than 1%
Iraq records 0.04%, Macao SAR 0.06%, Cabo Verde 0.06%, Belize 0.16%, Yemen 0.25%, Afghanistan 0.34% and Namibia 0.34%. Jamaica, Maldives and Bangladesh are still below 2%. These are reported values, not missing observations.
A low share means that the qualifying medium- and high-tech categories occupy a small portion of reported manufactured exports. It does not mean that the economy exports no machinery, electronics, chemicals or other technology-intensive goods at all, nor does it describe services exports. The measure is confined to the particular manufacturing classification used in the UNIDO methodology.
| Country or economy | Medium/high-tech share |
|---|---|
| Iraq | 0.04% |
| Macao SAR, China | 0.06% |
| Cabo Verde | 0.06% |
| Belize | 0.16% |
| Yemen, Rep. | 0.25% |
| Afghanistan | 0.34% |
| Namibia | 0.34% |
| Jamaica | 1.38% |
| Maldives | 1.66% |
| Bangladesh | 1.87% |
The 65 missing observations must remain distinct from low values
Of the 217 countries and economies in the prepared country master, 65 do not have a usable 2022 value. They are source-missing observations, not 0% shares. Replacing them with zero would artificially increase the number of very low economies, depress the average and distort country rankings.
The mean of 33.01%, median of 31.53%, percentile calculations and ranking tables in this article therefore use only the 152 reported values. Missing economies remain uncolored on the map. This treatment preserves the difference between “no reported value” and “a reported share close to zero.”
The map directly joins 140 observations; small economies remain in the statistics
The simplified Natural Earth boundary can be matched directly to 140 of the 152 reported economies, a join rate of 92.1%. Singapore, Malta, Bermuda, Hong Kong SAR, St. Lucia, Barbados, Bahrain, Tonga, Mauritius, Maldives, Cabo Verde and Macao SAR are among the observations that do not have a practical independent polygon in this low-resolution layer.
Their values still contribute to the summary statistics and tables. An uncolored location on the map therefore should not automatically be read as zero or missing; the map is a spatial overview rather than a substitute for the numeric table. Small territories are especially easy to underrepresent in a low-resolution global projection.
The technology groups are defined by product codes, not by a general label of “advanced industry”
World Bank metadata identifies UNIDO’s Competitive Industrial Performance database as the source. The methodology uses UN Comtrade SITC Revision 3 product codes, groups manufacturing exports into resource-based, low-tech, medium-tech and high-tech categories, and defines the numerator as the sum of medium- and high-tech manufacturing net exports. Re-exports are removed in the net-export calculation.
That product-based definition is more specific than a broad claim about whether an economy is “high tech.” A firm can make products in more than one technology class, and an economy may have sophisticated services or domestic industries that are not captured by merchandise exports. The indicator is most useful when the question is specifically about the technology composition of manufactured exports.
A 2022 snapshot does not establish a long-run structural trend
The comparison uses one observation year. Supply-chain disruptions, large contracts, shifts in assembly locations, commodity-price changes, exchange rates and changes in the rest of the manufacturing export basket can affect the ratio from year to year. A structural-transition claim needs a time series, not a single cross-section.
It is also possible for the ratio to rise even when the value of medium- and high-tech exports falls, if other manufactured exports fall faster. The reverse can happen as well. For trend analysis, pairing this percentage with the actual export value of the qualifying categories and total manufactured exports provides a more complete picture.
Source and interpretation
The source is World Development Indicators series TX.MNF.TECH.ZS.UN, “Medium and high-tech exports (% manufactured exports),” drawing on the UNIDO Competitive Industrial Performance database. The comparison keeps the 2022 country and economy observations, excludes aggregate regions and income groups, and preserves source-missing values as missing.
The safest reading is: what share of each reporting economy’s manufactured export basket was classified as medium or high technology in 2022? It is not a direct measure of export dollars, total merchandise-export composition, domestic innovation, research intensity, manufacturing employment or economic sophistication. Keeping those distinctions in view makes the map a useful comparison of trade structure rather than an overly broad technology ranking.
Frequently Asked Questions
Does a high medium- and high-tech share mean the country has the largest technology exports?
No. The indicator is a percentage of each economy’s manufactured exports. A separate value series is needed to compare export amounts in dollars.
Do the 65 missing 2022 observations mean 0%?
No. They are source-missing values and are kept separate from economies that report a very low percentage.
Can this indicator be used as a ranking of national technological capability?
Not by itself. It describes the technology composition of manufactured exports, while R&D, domestic value added, production scale, patents and skilled employment measure other dimensions.
Related Articles
Green Map creates custom-edited map images using open geographic data sources such as geoBoundaries, Natural Earth, OpenStreetMap, and government open data. These maps are edited visual materials, not raw data files, and are provided for education, documents, presentations, and graphic reference.