World Bank data for 2023 provide a usable value for short-term debt as a percentage of total reserves in 100 countries and separately reported economies. The numerator covers short-term external debt with an original maturity of one year or less, together with interest arrears on long-term debt. The denominator is total reserves, including gold. A reading of 100% therefore means that short-term debt is roughly equal to the stock of total reserves; a value above 100% means the numerator is larger than the reserve denominator. It is not a cap and it is not the percentage of debt that is short term.
The 2023 distribution is highly skewed. Its median is 23.90%, but the simple unweighted mean is 72.09%. Zimbabwe records 3406.99%, Argentina 238.79%, Tunisia 168.89%, and Sri Lanka 165.66%. At the bottom, Tonga is exactly 0.00%, Liberia is 0.02%, Comoros 0.14%, Bhutan 0.14%, and Burundi 0.33%. The enormous distance between the middle and the top explains why the average is much higher than the median and why a map using one continuous linear scale would hide most cross-country differences.
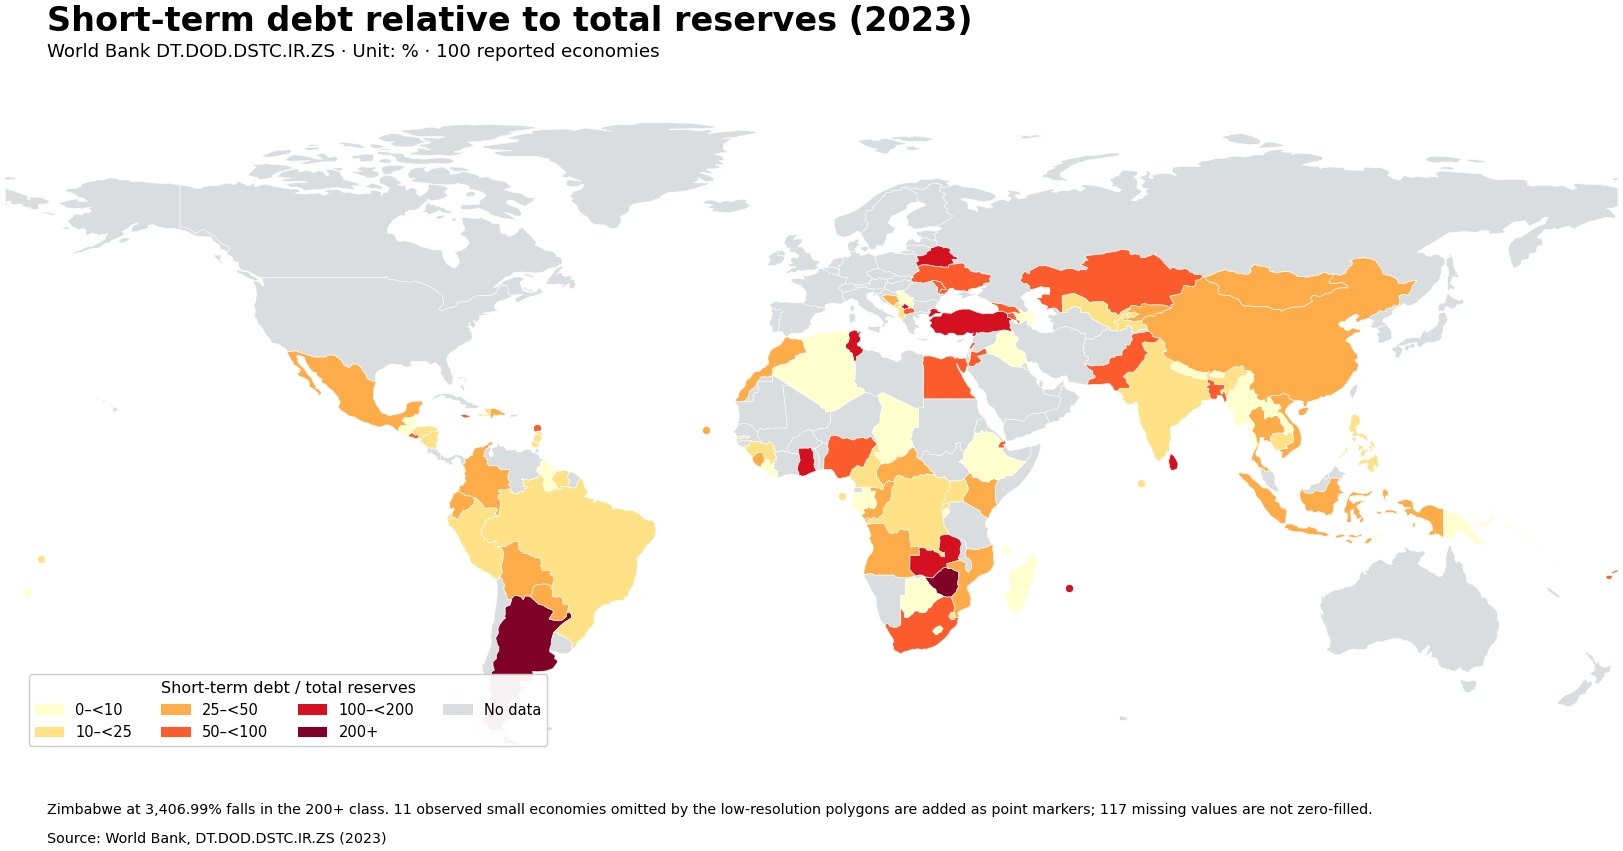
Table of Contents
Values above 100% are valid observations, not percentages that must be capped
Ten of the 100 reported economies are at or above 100% in 2023. They are Zimbabwe, Argentina, Tunisia, Sri Lanka, Mauritius, Belarus, Turkiye, Kosovo, Zambia, and Ghana. A ratio of 130% means short-term debt is about 1.3 times total reserves. Zimbabwe’s 3406.99% is approximately 34.1 times the reserve denominator. Truncating those values at 100 would destroy the meaning of the indicator because there is no mathematical rule that the numerator must be smaller than reserves.
The ratio should not, however, be converted directly into a probability of default or a stand-alone crisis score. Reserve usability, the schedule of repayments, private foreign-currency assets, access to refinancing, export receipts, exchange-rate arrangements, and the composition of the debt can all change the practical liquidity picture. Two economies with the same ratio can face different short-term financing conditions. The series is best used as one measure of the relationship between near-term external debt and official reserve assets.
| Economy | Short-term debt / total reserves |
|---|---|
| Zimbabwe | 3406.99% |
| Argentina | 238.79% |
| Tunisia | 168.89% |
| Sri Lanka | 165.66% |
| Mauritius | 130.30% |
| Belarus | 128.74% |
| Turkiye | 124.13% |
| Kosovo | 116.67% |
| Zambia | 107.44% |
| Ghana | 103.79% |
The middle of the distribution is far below the extreme upper tail
There are 25 observations below 10%, 26 from 10% to below 25%, 21 from 25% to below 50%, and 18 from 50% to below 100%. Another 8 fall between 100% and 200%, while 2 are at or above 200%. The first quartile is 10.63% and the third quartile is 52.56%, meaning that half of the reported values lie between those two points. The median of 23.90% is therefore much more representative of the center than the mean of 72.09%.
The 90th percentile is 96.14% and the 95th percentile is 128.82%. In other words, the ratio only approaches or exceeds 100% near the upper tenth of the observed distribution, after which the tail rises sharply. This is an unweighted country-and-economy comparison: each reporting unit counts once. It is not an estimate of the global ratio, because constructing a world total would require adding the underlying debt and reserve amounts rather than averaging national percentages.
Southern Africa contains one of the clearest neighboring contrasts
Zimbabwe is the global outlier at 3406.99%, while neighboring Zambia is 107.44% and South Africa 67.56%. Botswana is much lower at 6.10% and Lesotho at 0.39%; Mozambique is 39.06%. The region therefore spans values from below 1% to more than 3,000%. Such a range is a reminder that geographic proximity alone does not determine the relationship between short-term external debt and reserves.
A ratio can rise because the numerator increases, because reserves decline, or because both move in the same unfavorable direction. It can fall even when short-term debt is growing if reserves grow faster. For that reason, a change in this percentage cannot be attributed to debt issuance alone without examining the two underlying levels. The same caution applies when comparing countries: a small reserve base can make a moderate amount of short-term debt produce a large percentage.
South Asia ranges from near zero to more than 160%
Sri Lanka stands at 165.66%, while Pakistan and Bangladesh are almost identical at 65.12% and 65.10%. India is 20.24% and Maldives 16.68%. Nepal is only 3.35% and Bhutan 0.14%. This broad spread inside one subregion makes a regional average a poor substitute for country-level analysis. The ratio depends on both the amount and maturity of external debt and the size of the reserve stock.
A low value does not necessarily mean that the economy has little external debt in absolute terms. It may simply hold a much larger reserve stock relative to the short-term portion of its debt. Likewise, a high value does not tell us the country’s total external debt because long-term obligations are not represented in the numerator in the same way. Absolute debt, debt-to-GDP, debt-service ratios, and the reserve-to-imports ratio answer different questions.
Latin America also shows sharp differences among nearby economies
Argentina is at 238.79%, one of only two observations above 200%. Ecuador is 46.73%, Brazil 22.67%, Colombia 31.32%, and Bolivia 44.06%. In Central America, El Salvador is 94.57%, compared with Guatemala at just 0.89%, Honduras at 19.83%, and Nicaragua at 18.91%. Neighboring geography therefore coexists with very different reserve and maturity structures.
The map identifies where the ratio is high or low, but it does not establish why. Country-specific explanations require evidence on reserve accumulation, debt issuance and rollover, trade finance, exchange-rate management, capital flows, and the composition of external liabilities. Treating a geographic cluster as proof of a common cause would go beyond what this single World Bank series can support.
Eastern Europe and the Caucasus mix triple-digit and very low ratios
Belarus records 128.74%, Turkiye 124.13%, and Kosovo 116.67%, all above 100%. Armenia is 86.12% and Georgia 83.30%. North Macedonia stands at 62.61%, Moldova 51.77%, and Ukraine 52.13%, whereas Serbia is only 3.52%. These differences show that a broad regional label does not describe the maturity structure of external debt or the size of reserve buffers.
This also illustrates why the indicator is not interchangeable with short-term debt as a share of total external debt. A country may have a modest short-term share but limited reserves, producing a relatively high reserves-based ratio. Another may have a larger short-term share but an even larger reserve stock. The denominator determines the economic question being asked.
North Africa and the Middle East do not form a single ratio band
Tunisia is at 168.89%, Egypt at 89.15%, Jordan at 83.77%, and Lebanon at 62.41%. Morocco is lower at 27.97%, while Algeria is 2.36% and Iraq 0.87%. The observed range within the region therefore runs from below 1% to nearly 170%. A country-level map is useful precisely because it exposes those internal differences.
Reserve management and external borrowing can operate differently across exchange-rate regimes, commodity exporters, financial centers, and economies with different access to capital markets. Those institutional features may matter for interpretation, but the 2023 ratio alone does not identify a causal mechanism. Any detailed claim about why one country is higher than another should be based on additional official balance-of-payments, reserve, and debt data.
Short-term debt relative to reserves is different from short-term debt relative to exports
The numerator may refer to the same broad short-term external-debt concept, but changing the denominator changes the question. Total reserves are a stock of official reserve assets, while exports of goods and services plus primary income are flows earned over a period. Comparing debt with reserves asks how large near-term external liabilities are relative to an asset buffer. Comparing debt with exports asks how large they are relative to a stream of foreign-currency earnings.
Those ratios are complementary, not interchangeable. An 80% reserves ratio cannot be directly compared with a 20% exports ratio as though one were four times “riskier.” Different denominators represent different capacities. A sound interpretation first identifies the denominator and then uses other indicators to build a broader picture of external liquidity and debt service.
A reported zero and a missing value must remain separate
Tonga has a reported value of exactly 0.00% in this dataset. That is a real numerical observation. By contrast, 117 of the 217 country-and-economy rows have no usable 2023 observation and are preserved as source-missing. Replacing those missing values with zero would incorrectly place 117 additional economies in the lowest class and materially distort the median, average, rankings, and map.
All descriptive statistics in this article therefore use only the 100 reported values. The full set of 217 rows describes the World Bank country-and-economy coverage after aggregate groups are excluded, not a promise that every unit has a 2023 observation. Because more than half of the rows are missing for this particular year, the results should be described as a comparison of reporting economies rather than a complete census of every economy in the world.
Discrete map classes preserve information despite the extreme outlier
A linear color scale from 0 to 3406.99% would compress almost every country into the lightest part of the palette. The map therefore uses six classes: 0–10%, 10–25%, 25–50%, 50–100%, 100–200%, and 200% or more. Zimbabwe remains correctly classified above 200%, while the visual still distinguishes the much more common 10%, 30%, and 80% ranges. The classes are a visualization choice; the tables and statistics retain the original continuous values.
The low-resolution polygon layer directly represents 89 of the 100 reported values. Comoros, Cabo Verde, Dominica, Grenada, St. Lucia, Maldives, Mauritius, Sao Tome and Principe, Tonga, St. Vincent and the Grenadines, and Samoa are added as point markers, bringing the map representation to all 100 reported observations. The points indicate approximate location and value category rather than land area.
One year cannot by itself establish long-run debt resilience
Both short-term debt and reserves can change quickly. Debt can mature, be refinanced, or shift between maturity categories; reserves can move with foreign-exchange intervention, balance-of-payments flows, valuation changes, and official transactions. A high ratio in one year may be temporary, while a moderate value could be part of a persistent upward trend. Multi-year analysis is needed to distinguish a one-off movement from a structural pattern.
The institutional coverage of the two sides also deserves attention. Total reserves are official reserve assets under monetary authorities, while external debt can include liabilities across sectors of the economy. The ratio is useful because it compares a near-term external obligation measure with an official liquidity buffer, but it is not a balance sheet in which the numerator and denominator belong to the same institution. That difference is another reason not to interpret the number as a mechanical solvency test.
Source and reading guide
The source is the World Bank World Development Indicators series DT.DOD.DSTC.IR.ZS, “Short-term debt (% of total reserves).” The official definition includes external debt with an original maturity of one year or less and interest in arrears on long-term debt. Total reserves include gold. This comparison uses the official 2023 observations, excludes regional and income-group aggregates, and preserves source-missing values without imputation.
The most useful reading is therefore relative rather than absolute: the map asks how large short-term external debt is compared with total reserves in each reporting economy. Values above 100% are valid, a high value can result from either side of the ratio, and missing observations are not zeros. A fuller external-liquidity assessment would combine this measure with total external debt, debt-service schedules, reserve levels, exports, primary income, and a multi-year trend.
Frequently Asked Questions
Can short-term debt exceed 100% of total reserves?
Yes. This is a ratio of short-term debt to total reserves, so it can exceed 100% whenever the numerator is larger than the reserve stock. 100% is not a cap.
Does a high ratio automatically mean default risk is high?
No. It is one external-liquidity indicator. Repayment schedules, export earnings, refinancing access, reserve usability, and other assets and liabilities also matter.
Should the 117 missing 2023 observations be treated as 0%?
No. They are source-missing values, not measured zeros. Replacing them with 0% would create false observations and distort the distribution.
Related Articles
Green Map creates custom-edited map images using open geographic data sources such as geoBoundaries, Natural Earth, OpenStreetMap, and government open data. These maps are edited visual materials, not raw data files, and are provided for education, documents, presentations, and graphic reference.