The World Bank indicator used here measures the share of each reporting economy’s total merchandise imports that came from economies classified in the World Bank’s Arab World group. It is a percentage of merchandise imports, not the dollar value of imports. That distinction matters immediately: a high share means suppliers in the Arab World occupied a large portion of an economy’s import mix, but it does not automatically mean the economy imported a larger absolute amount than a country with a lower share. A very large importer can record a modest percentage while still buying substantial goods from the region.
The 2023 dataset contains 217 countries and separately reported economies after aggregate groups are excluded. Values are available for 196 of them, while 21 remain missing in the official source. Across the available observations, the simple mean is 6.70% and the median is 2.59%. The large gap between those two summary measures shows that the distribution is strongly pulled upward by a relatively small group of high-share economies. Oman records 53.13%, Comoros 46.69%, and Yemen 39.28%, while a large part of the dataset is in the low single digits.
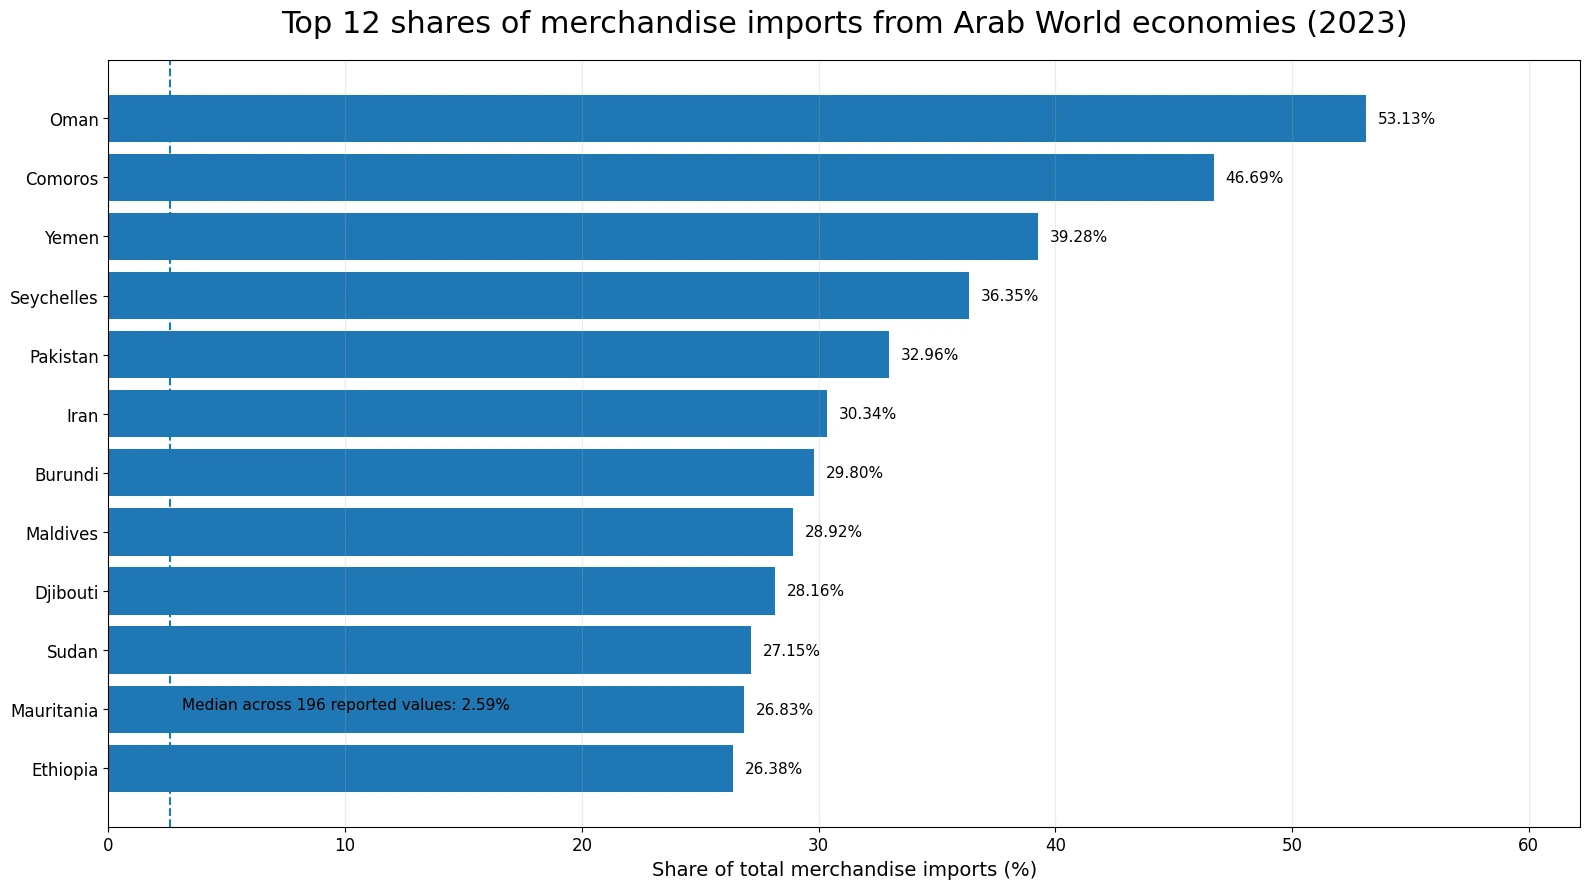
Table of Contents
The highest shares are large enough to shape the overall distribution
Oman stands out at 53.13%, meaning that slightly more than half of its merchandise import value in this indicator came from economies in the Arab World group. Comoros follows at 46.69%, then Yemen at 39.28%, Seychelles at 36.35%, Pakistan at 32.96%, and Iran at 30.34%. Burundi, Maldives, Djibouti, Sudan, Mauritania, and Ethiopia are also above 26%. The upper end therefore includes Arab World economies as well as countries in South Asia, the Indian Ocean, and sub-Saharan Africa. Geography may be relevant, but the indicator alone does not identify the cause of a high share.
Several mechanisms could contribute to a high value, including transport links, energy or food purchases, re-export hubs, historical trading relationships, or the size of alternative supplier networks. Those are plausible analytical questions rather than conclusions contained in this dataset. The series provides the partner-group share; it does not break the imports into products, routes, contracts, or individual Arab World partners. A careful reading therefore separates what is observed—the percentage—from explanations that would require additional evidence.
| Reporting economy, 2023 | Share from Arab World economies |
|---|---|
| Oman | 53.13% |
| Comoros | 46.69% |
| Yemen, Rep. | 39.28% |
| Seychelles | 36.35% |
| Pakistan | 32.96% |
| Iran, Islamic Rep. | 30.34% |
| Burundi | 29.80% |
| Maldives | 28.92% |
| Djibouti | 28.16% |
| Sudan | 27.15% |
Most reported economies are far below the leaders
The high values can make the dataset look more concentrated than it usually is. Of the 196 reported values, 75 are below 1%. Another 50 are at least 1% but below 5%, and 24 are between 5% and 10%. Only 47 reach 10% or more, and just 18 reach 20% or more. The first quartile is 0.43% and the third quartile is 9.44%, so the middle half of the reported economies lies roughly inside that interval.
The median of 2.59% is particularly useful because it is less affected by the handful of economies above 30% or 40%. The mean of 6.70% is a valid summary, but it answers a different question and is more sensitive to the long upper tail. Neither figure is weighted by each economy’s import value. In other words, this is a summary across reporting economies where each economy contributes one observation. It is not the percentage of all world merchandise imports that came from the Arab World.
The partner group is the World Bank Arab World classification
The phrase “Arab World” in the indicator is a defined partner-economy group used by the World Bank, not a label that should be freely substituted with every Middle East or North Africa classification. According to the indicator description, merchandise imports from the partner group are summed and expressed as a percentage of the reporting economy’s total merchandise imports. The data are computed only when at least half of the economies in the partner group have non-missing data. That coverage rule is part of the meaning of the series.
This is also why apparently similar indicators should not be treated as interchangeable. A series for imports from low- and middle-income MENA economies uses a different partner set. A series for imports from high-income economies uses another set again. Even for the same reporting country and year, changing the partner group changes the numerator and can materially change the percentage. Comparisons across related trade indicators should therefore begin with the exact indicator code and partner definition, not just a similar-looking title.
A high percentage is a sourcing pattern, not a complete dependency measure
A high share indicates that Arab World economies were important merchandise suppliers in 2023, but “dependency” is a broader concept. Merchandise trade does not include services, domestic production capacity, investment links, or financial flows. Even within merchandise imports, the economic implications depend on which goods dominate the relationship. A high share driven by petroleum has a different risk profile from a high share spread across food, chemicals, metals, machinery, and consumer goods.
Concentration inside the partner group matters as well. Two economies can both record 20%, yet one might source nearly all of that amount from a single country while the other buys from many Arab World suppliers. The dataset does not reveal that internal distribution. Assessing supply-chain exposure would require partner-by-partner import values, product composition, historical volatility, and ideally information about substitute suppliers and transport routes. The percentage in this article is a useful screening signal, not a self-contained measure of resilience.
A low share does not mean trade with the region is unimportant
The same caution applies at the bottom of the distribution. A share below 1% can still correspond to a large absolute import value if the reporting economy has a very large merchandise import base. Some strategically important commodities can also be economically significant even when their value represents a small portion of total imports. The indicator is designed to show relative sourcing within the import basket; it does not rank the strategic importance of individual products.
Several of the smallest positive observations are extremely close to zero. American Samoa, the Democratic People’s Republic of Korea, Sint Maarten, the Marshall Islands, Palau, and the Bahamas are among the lowest reported values. These are positive observations, not missing cells. Ranking tiny differences far below one tenth of a percent can easily imply more precision than is economically meaningful, particularly for small economies where a few transactions may noticeably change a yearly percentage.
Missing values are preserved and must not be converted to zero
There are 21 source-missing observations among the 217 country and economy rows, including Andorra, Fiji, Cambodia, Samoa and several small territories. A missing value does not mean that imports from Arab World economies were zero. It means the source does not provide a usable 2023 observation under this series. Replacing those missing cells with zero would create false low values and distort both maps and distribution statistics.
The dataset metadata identifies 2023 as the comparison year and preserves missing source values while excluding World Bank aggregate groups. As a result, statements about medians, quartiles, and counts in percentage bands refer to the 196 economies with actual values. The wider list of 217 is the coverage frame, not the denominator for every distribution statistic. Keeping those two counts separate prevents an easy but important reporting error.
Absolute trade values and product detail provide the next layer of context
A stronger analysis combines this partner-group share with at least three additional views. First, total merchandise imports show whether a high percentage sits on a large or small import base. Second, product-level data reveal whether energy, food, chemicals, manufactured inputs, or other goods explain the relationship. Third, bilateral partner data show which particular Arab World economies supply the imports. Adding a time series then shows whether 2023 was typical, rising, falling, or an unusual year.
Those combinations can produce very different interpretations from the share alone. An economy with a high percentage, a large absolute import value, and heavy concentration in one essential commodity may face a different exposure than an economy with the same percentage spread across many products and suppliers. Conversely, an economy with a low percentage can still have meaningful trade if its total import base is enormous. The indicator is most informative when it is treated as one dimension of a broader trade profile.
The 2023 snapshot should not be assumed to be permanent
Trade shares move over time. Commodity prices, exchange rates, shipping costs, conflict, sanctions, infrastructure changes, trade agreements, and domestic demand can all alter the value of imports from one partner group relative to total imports. A change in the denominator can matter just as much as a change in imports from the Arab World. For example, the share can rise because Arab World imports increased, because imports from other regions fell, or because both changed at different rates.
That makes a single-year comparison valuable but limited. The 2023 cross-section clearly shows that sourcing relationships differ widely: a small number of economies obtain more than one fifth of their merchandise imports from the group, while 75 reported economies are below 1%. To determine whether these are persistent structures, users should compare several years using the same definition and investigate large changes with product and partner data.
How to interpret the indicator without overstating it
Three rules keep the comparison grounded. First, read the number as a share of merchandise import value, not as an import-value ranking. Second, keep the World Bank Arab World partner definition fixed instead of substituting a different MENA or income group. Third, treat missing values as unavailable rather than zero. With those safeguards, the series is useful for identifying economies where the Arab World is a prominent source of imported goods and for locating cases where the relationship is relatively small in the overall import basket.
The source is the World Bank World Development Indicators series TM.VAL.MRCH.AL.ZS. The 2023 observations used here are official country and economy records, with aggregate regions excluded and source-missing values retained as missing. The indicator reports merchandise imports from economies in the Arab World as a percentage of total merchandise imports of the reporting economy.
Frequently Asked Questions
What exactly does this import share measure?
It is the percentage of a reporting economy’s total merchandise imports that came from economies in the World Bank Arab World group. It is not an absolute import-value ranking.
Should missing 2023 observations be treated as 0%?
No. Twenty-one economies have source-missing values. Missing means no usable observation is provided for this series and year, not that imports from the partner group were zero.
Does the highest percentage mean the largest import amount?
Not necessarily. The indicator divides imports from the partner group by total merchandise imports, so an economy with a lower percentage can still import a larger dollar amount.
Related Articles
Green Map creates custom-edited map images using open geographic data sources such as geoBoundaries, Natural Earth, OpenStreetMap, and government open data. These maps are edited visual materials, not raw data files, and are provided for education, documents, presentations, and graphic reference.