World Bank national-estimate data for 2024 provide a labor-force participation value for people ages 15–24 in 104 reporting economies. Across those observations, the mean is 42.46%, the median is 39.85%, and the range runs from 14.122% to 83.242%. The spread is large enough that youth participation cannot be described by one global benchmark.
Labor-force participation is not the same as employment. A young person is in the labor force if they are employed or if they are unemployed and actively seeking work. Students and other people who are not working and not seeking work remain outside the labor force. The indicator therefore describes contact with the labor market, not simply the share of young people who currently have jobs.
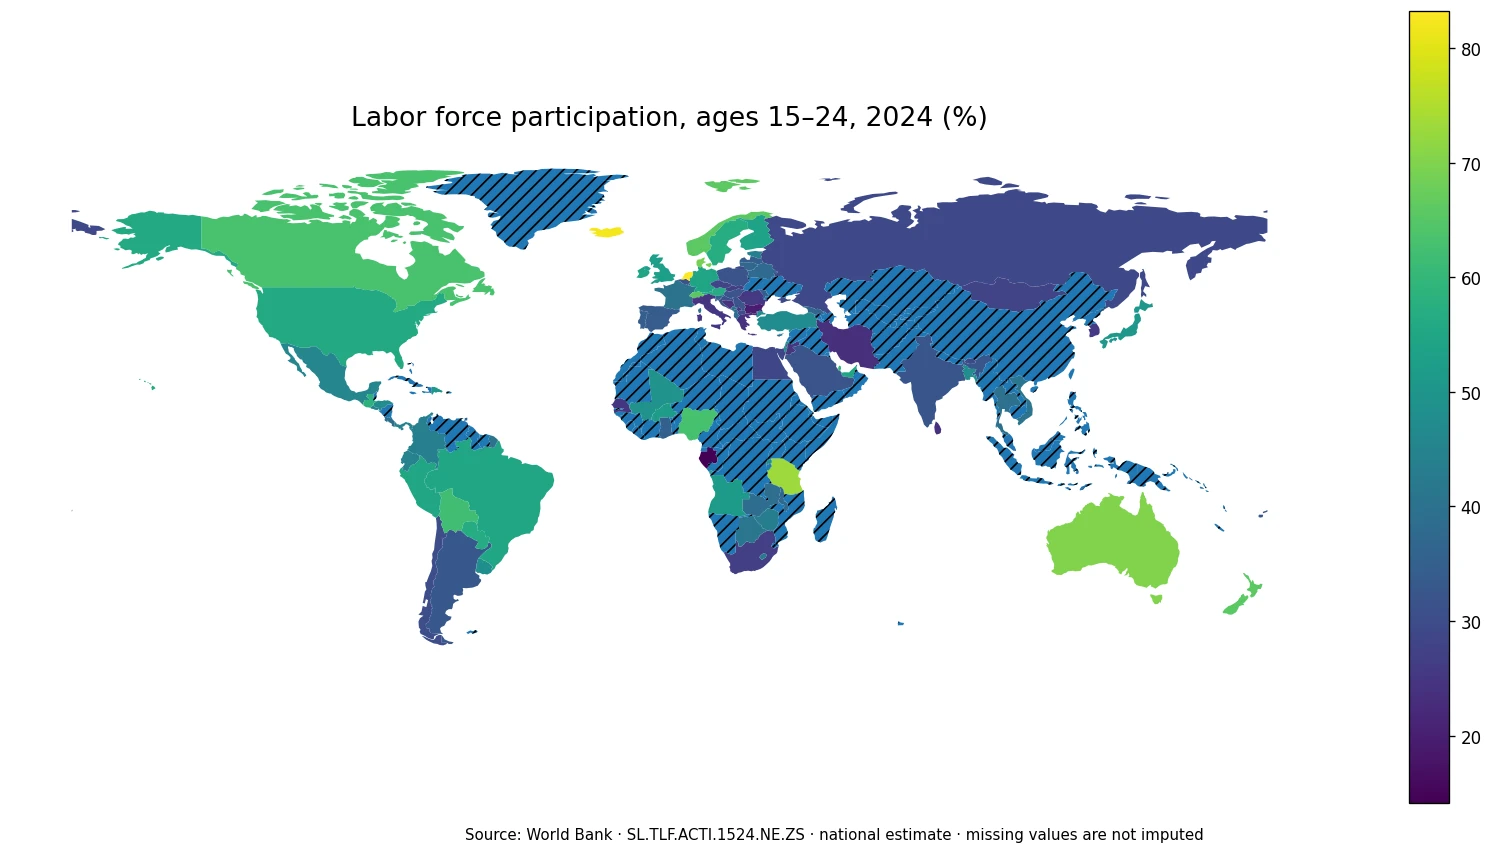
Table of Contents
The middle half of observations spans about 32% to 52%
The first quartile is 32.03% and the third quartile is 52.16%, so half of the available observations fall between roughly 32.0% and 52.2%. The median of 39.85% sits below the mean of 42.46%, reflecting a group of high-participation economies in the 60% to 80% range. Looking at quartiles helps avoid treating the mean as if it represented a typical country equally well.
Ages 15–24 cover a transition period in which education and work overlap. Participation can be affected by the length of schooling, the prevalence of part-time work, apprenticeships, military service, job-search practices, informal employment and the timing of entry into full-time work. Because those institutions differ, two economies with the same participation rate can still have very different youth experiences.
The highest observations reach above 80%
| Economy | 2024 participation rate |
|---|---|
| Netherlands | 83.242% |
| Iceland | 82.107% |
| Tanzania | 73.100% |
| Australia | 70.188% |
| Denmark | 69.103% |
| Norway | 65.916% |
| Switzerland | 65.738% |
| New Zealand | 65.506% |
| Canada | 63.070% |
| Nigeria | 62.740% |
The Netherlands and Iceland are above 80%, while Tanzania is above 70%. Australia and Denmark are close to 70%, followed by Norway, Switzerland, New Zealand, Canada and Nigeria. The composition of the top group is geographically diverse, which is a reminder that high youth participation is not a feature of one income group or one region alone.
A high rate does not by itself mean that youth employment conditions are strong. Unemployed job seekers are included in the labor force, and participation can also be high where young people combine study with part-time work or enter informal employment early. Employment rates, unemployment rates, hours worked and job quality are needed to distinguish those possibilities.
The lowest observations cluster in the teens and twenties
| Economy | 2024 participation rate |
|---|---|
| Gabon | 14.122% |
| Bulgaria | 19.733% |
| Iran, Islamic Rep. | 23.164% |
| Sri Lanka | 23.711% |
| Greece | 23.829% |
| Bosnia and Herzegovina | 24.251% |
| Kosovo | 24.434% |
| Senegal | 24.671% |
| Italy | 24.740% |
| Jordan | 24.969% |
Gabon has the lowest reported value at 14.122%, followed by Bulgaria at 19.733%. Iran, Sri Lanka, Greece, Bosnia and Herzegovina, Kosovo, Senegal, Italy and Jordan are between about 23% and 25%. In these economies, a much smaller share of the 15–24 population is either working or actively seeking work.
Low participation can have very different meanings. It may reflect extended schooling and later entry into the labor market, but it can also coincide with discouragement or a large group of young people outside both work and education. Participation alone does not identify the reason. Enrollment, NEET rates and employment-to-population ratios provide useful context for separating education-related nonparticipation from labor-market exclusion.
Europe contains both very high and very low values
Within Europe, the Netherlands is at 83.2%, Iceland at 82.1%, Denmark at 69.1%, Norway at 65.9% and Switzerland at 65.7%. At the other end, Bulgaria is 19.7%, Greece 23.8% and Italy 24.7%. Germany records 54.5%, the United Kingdom 52.7% and France 40.4%.
Such a wide within-region spread points toward differences in how education and work are combined. Countries vary in apprenticeship systems, student employment, the timing of tertiary education, the availability of part-time jobs and the way job search is captured by labor-force surveys. A continental average would hide much of that variation.
The Americas and Oceania mostly sit in the middle and upper ranges
Australia records 70.2% and New Zealand 65.5%, while Canada stands at 63.1% and the United States at 55.9%. Brazil is 54.7%, Mexico 45.5%, Guatemala 58.2% and Bolivia 62.1%. The range across the Americas remains broad even without the most extreme global observations.
Higher participation in some of these economies may be consistent with more widespread student employment or earlier labor-market entry, but the indicator cannot establish the cause. Informal work, household income needs and local labor demand can also influence whether young people work or search for work while studying. Country-level labor-force and education data are needed for causal interpretation.
Asia and Africa show large internal contrasts
In Asia, Japan is at 50.8%, India 32.3%, Sri Lanka 23.7%, Iran 23.2%, Jordan 25.0% and Qatar 59.0%. In Africa, Tanzania reaches 73.1% and Nigeria 62.7%, while Gabon is 14.1%, Senegal 24.7% and South Africa 26.8%.
These contrasts caution against explaining participation with a single factor such as income level. School attendance, informal work, labor demand, family responsibilities and survey conditions can all matter. The map is useful for locating high and low observations, but explaining those observations requires evidence specific to each economy.
Participation, employment and unemployment answer different questions
The participation rate uses the entire 15–24 population as the denominator and asks what share is in the labor force. The employment-to-population ratio asks what share is actually employed. The unemployment rate uses the labor force as its denominator and asks what share of participants are without work but seeking it. Those denominator differences are central to interpretation.
An economy can have a high participation rate and still have high youth unemployment if many participants are looking for work. Another economy can have low unemployment among labor-force participants while also having low participation because many young people remain outside the labor force. Reading the three indicators together separates labor-market entry from success in finding work.
National estimates should not be mixed with modelled series
The series used here is World Bank indicator SL.TLF.ACTI.1524.NE.ZS and is labelled a national estimate. It should not be treated as interchangeable with a separate internationally modelled series even when the indicator names look similar. National estimates rely on country statistical sources and may differ in survey timing or measurement from harmonized modelled estimates.
This is also a single-year comparison. A 2024 rank does not establish a long-term structural position. Economic cycles, changes in education systems, shifts in youth population composition and revisions to survey methods can move participation rates. Trend analysis should use the same indicator definition over multiple years and check for breaks in statistical methodology.
Missing observations remain missing
The country-and-economy frame contains 217 rows, but only 104 have a 2024 value and 113 are source-missing. None of those missing observations has been replaced with zero. They are excluded from the mean, median and ranking because “no value reported” is not equivalent to 0% participation.
The low-resolution world boundary file matches 96 of the 104 valid observations to visible polygons. Small islands and separately reported territories may therefore be absent as distinct map surfaces even when they have valid data. Their values remain in the statistics and source table. This is a mapping limitation rather than a deletion of observations.
What the 2024 map is most useful for
The clearest message is the width of the distribution. Youth labor-force participation ranges from the teens to above 80%, with major differences even among nearby economies. The map is therefore useful for identifying where labor-market contact among young people is relatively high or low, but it should not be converted into a simple “better versus worse” ranking.
A stronger follow-up is to compare this total rate with youth employment-to-population ratios, youth unemployment, female and male participation, and NEET rates for the same year. Together, those measures distinguish participation from actual employment, reveal gender differences and show how many young people remain outside work, education and training. That combination gives a fuller view of the transition from school to work.
Frequently Asked Questions
What does labor force participation among ages 15–24 measure?
It is the share of people ages 15–24 who are in the labor force, meaning they are either employed or unemployed and actively seeking work.
Does a high participation rate mean youth employment conditions are strong?
Not necessarily. Unemployed job seekers are included in the labor force, so participation can be high even when youth unemployment is also high.
Were economies without a 2024 value treated as 0%?
No. The 113 missing observations remain missing and are excluded from the mean, median and rankings.
Related Articles
Green Map creates custom-edited map images using open geographic data sources such as geoBoundaries, Natural Earth, OpenStreetMap, and government open data. These maps are edited visual materials, not raw data files, and are provided for education, documents, presentations, and graphic reference.