The 2024 EIA state series for petroleum consumed in the Electric Power Sector Non-CHP shows a distribution that is much tighter in the middle than the headline maximum and minimum suggest. Maine recorded the highest average heat content at 6.3659 MMBtu per barrel, while Michigan recorded 4.0008, the lowest of the 50 states. The full range is 2.3651 MMBtu per barrel. These values come from one fixed annual slice: heat-content, fueltypeid PET, sectorid 90, and year 2024. The metric is therefore a comparison of average energy content per barrel within that exact sector and fuel definition, not a ranking of petroleum consumption, electricity generation, or power-plant efficiency.
Across all 50 states, the unweighted mean is 5.7685 MMBtu per barrel and the median is 5.8026. The mean sits below the median mainly because Michigan is far below the main cluster. If Michigan is removed, the other 49 states average about 5.8046, which is almost identical to the full-sample median. 35 states fall between 5.70 and 5.90, and 35 states lie within 0.10 MMBtu per barrel of the median. In other words, most observations form a narrow central band even though the overall minimum-to-maximum span looks large.
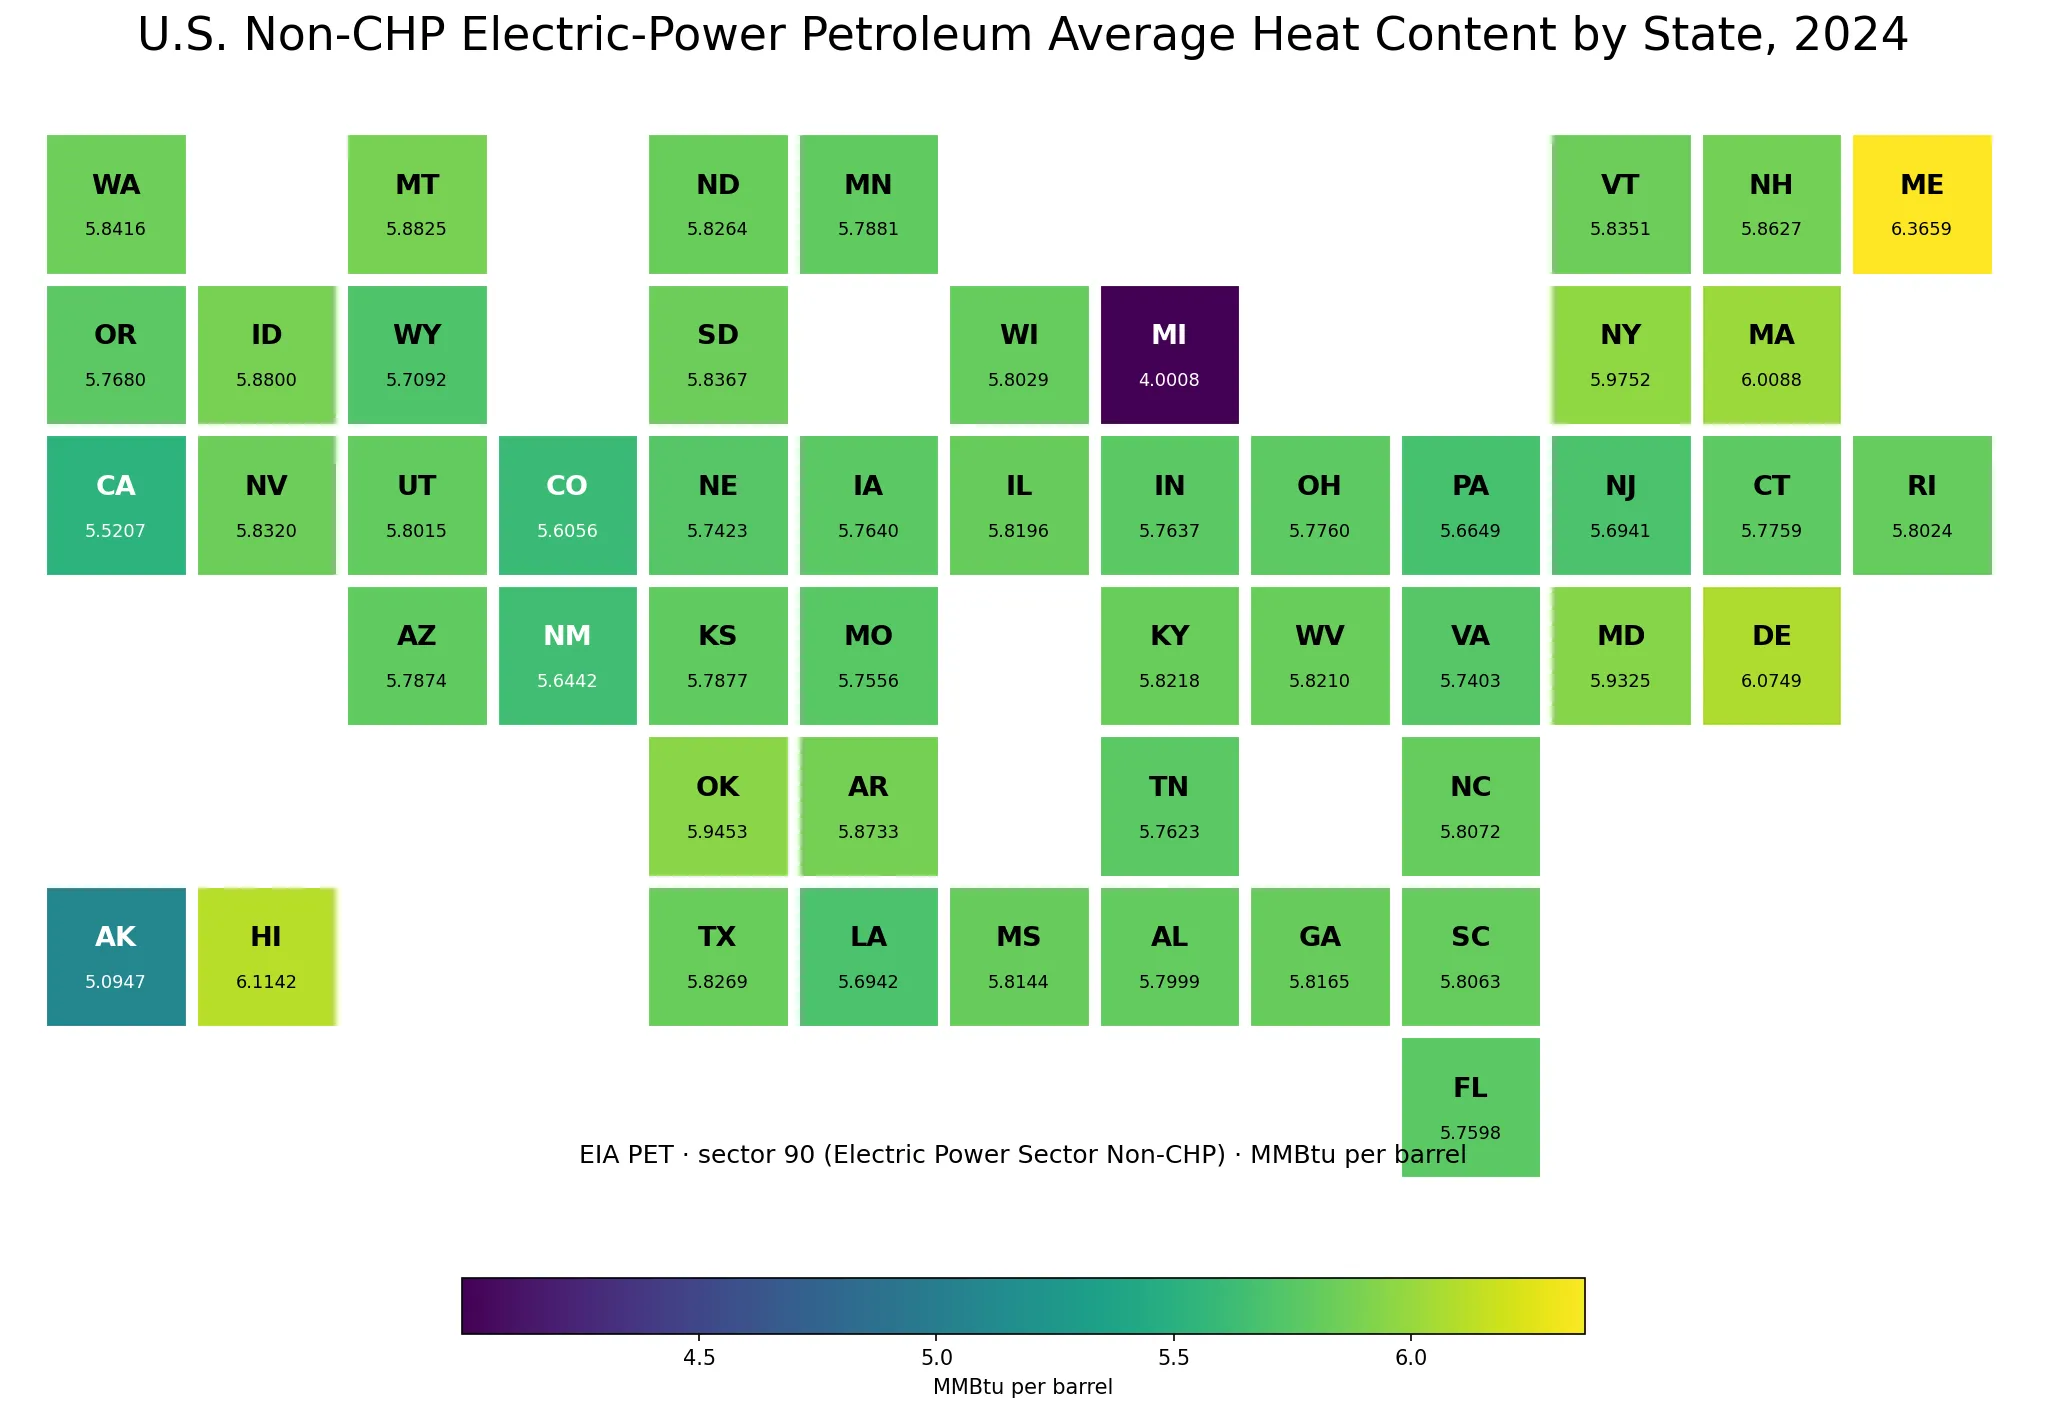
Table of Contents
Maine was the only state above 6.3 MMBtu per barrel
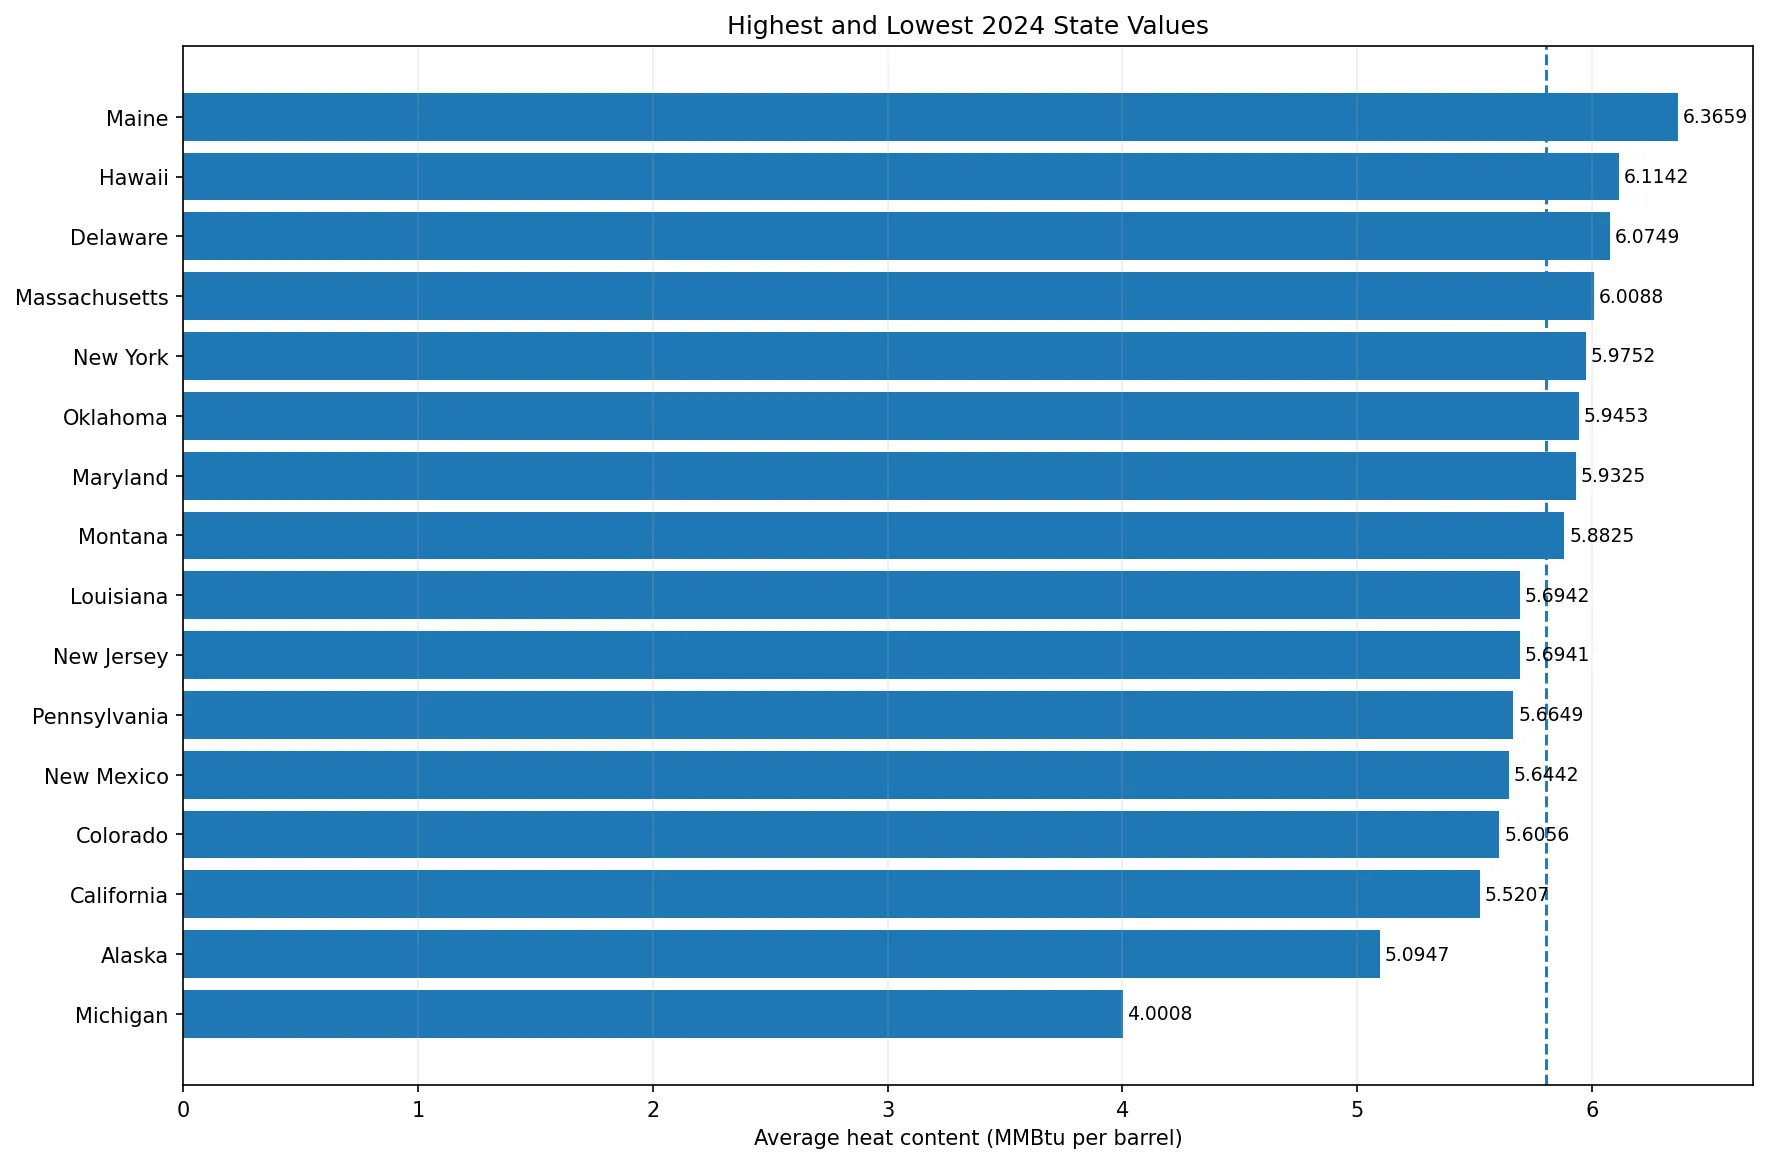
Maine stands apart at the top with 6.3659 MMBtu per barrel. Hawaii follows at 6.1142, Delaware at 6.0749, and Massachusetts at 6.0088. Those are the only four states at or above 6.0. New York, Oklahoma, and Maryland form the next tier just below that threshold. The ranking describes the average energy content of the petroleum represented by one barrel in this EIA series. It does not indicate that Maine burned the most petroleum or generated the most petroleum-fired electricity. A state can have a high heat-content value and still have a small consumption volume.
| State | Code | Average heat content (MMBtu/barrel) |
|---|---|---|
| Maine | ME | 6.3659 |
| Hawaii | HI | 6.1142 |
| Delaware | DE | 6.0749 |
| Massachusetts | MA | 6.0088 |
| New York | NY | 5.9752 |
| Oklahoma | OK | 5.9453 |
| Maryland | MD | 5.9325 |
| Montana | MT | 5.8825 |
The difference between Maine and the median is about 0.5633 MMBtu per barrel. That is a noticeable fuel-property difference within the state comparison, but it should not be converted into an efficiency claim. Heat content is energy per physical unit of fuel. Heat rate, by contrast, describes energy input per unit of electricity output and is usually expressed in Btu per kilowatthour. EIA publishes both types of statistics, but they answer different questions. A higher-energy barrel does not by itself establish that a generator converted fuel to electricity more efficiently.
Michigan is the dominant lower-tail outlier
Michigan is much farther from the central cluster than any other state. Its 4.0008 MMBtu per barrel is 1.0939 below Alaska, the second-lowest state at 5.0947. California, the third-lowest, is already back at 5.5207. Once Michigan and Alaska are passed, the lower tail moves rapidly toward the middle of the distribution. This is why the total range should not be treated as the typical difference among states. Most pairwise comparisons near the center are far smaller than the 2.3651 MMBtu gap between Maine and Michigan.
| State | Code | Average heat content (MMBtu/barrel) |
|---|---|---|
| Michigan | MI | 4.0008 |
| Alaska | AK | 5.0947 |
| California | CA | 5.5207 |
| Colorado | CO | 5.6056 |
| New Mexico | NM | 5.6442 |
| Pennsylvania | PA | 5.6649 |
| New Jersey | NJ | 5.6941 |
| Louisiana | LA | 5.6942 |
The first quartile is 5.7604 and the third quartile is 5.8363, leaving an interquartile range of only 0.0759 MMBtu per barrel. Twenty-eight states fall between 5.75 and 5.85, and 35 are within 0.10 of the median. The sample standard deviation is 0.3040, but that statistic is enlarged by the unusually low Michigan observation. The more representative description is therefore a compact center near 5.8 with a small number of observations stretching both tails.
Average heat content is not fuel volume, generation, or heat rate
A heat-content value tells us how much energy is represented by a unit of fuel. It does not tell us how many barrels a state consumed. Total energy input depends on both the amount of fuel and its heat content. It also does not tell us how many megawatthours were generated, because electricity output depends on the quantity of fuel used and on conversion performance. Finally, the metric is not an operating heat rate. Heat rate uses a different denominator—Btu per kilowatthour—and is a common efficiency-oriented measure. Keeping these units separate prevents a state ranking in one metric from being misread as a ranking in another.
This distinction is especially important when reading several EIA series with nearly identical labels. Petroleum consumption for electricity generation, total petroleum consumption, energy consumption in Btu, net generation, and average heat content may all be available for similar sector and state dimensions. They are related, but they are not interchangeable. A state can rank high in one and low in another without any contradiction. The 2024 series here should be used only for the question it directly answers: how did average petroleum heat content vary across states within EIA sector 90?
Sector 90 keeps the comparison inside Electric Power Sector Non-CHP
EIA sectorid 90 is Electric Power Sector Non-CHP. It excludes combined-heat-and-power activity from this sector definition and is not the same as every broader electric-power or all-sector category. A similar article can legitimately produce a different ranking if it uses sector 98, sector 99, a utility-only category, or an independent-power-producer category. The fuel facet matters too. PET is the petroleum category used in this dataset; a series using PEL for petroleum liquids is a different identity. Matching only the year and the words “petroleum heat content” is not enough to establish equivalence.
That exact-series discipline also helps with duplicate control. The dataset identity here is annual 2024, field heat-content, PET, sector 90, state geography. If any of those dimensions changes, the resulting values may answer a different question. For example, a broader sector can include facilities absent from non-CHP sector 90, while a narrower petroleum-liquids fuel category can change the average composition represented by one barrel. Readers comparing related articles should therefore check fuel code, sector code, field, unit, and year before drawing a numerical comparison.
All 50 states have a 2024 observation
The cleaned state slice contains exactly 50 observations and no missing values. The District of Columbia is not part of this 50-state comparison. Because every state has a value, the map does not fill any missing state with zero and does not borrow a value from another year. This matters because a zero in a heat-content field would have a physical meaning very different from “not reported.” Here there is no such ambiguity: every tile corresponds directly to a 2024 observation in the source data.
Complete coverage does not imply that petroleum use was substantial in every state. An average heat-content statistic can exist even when the physical volume consumed is small. The presence of a value simply means the average could be reported for that state-sector-fuel combination. To answer a scale question—where petroleum use was largest—one would need a physical-consumption or energy-consumption series. To answer a contribution question—where petroleum supplied a large share of electricity—one would need petroleum generation together with a suitable total-generation denominator.
Why the center of the distribution matters more than the extremes alone
35 of the 50 states are between 5.70 and 5.90 MMBtu per barrel. Only 4 states are at or above 6.0, and only 2 are below 5.5. That pattern makes the central concentration the defining characteristic of the dataset. Maine and Michigan are useful for locating the endpoints, but they are not representative of the typical state. A map colored from the absolute minimum to maximum can visually emphasize those endpoints, so the numeric median and quartiles are necessary context. They show that most states are much closer together than the color scale might initially imply.
One year is a clean comparison, not a trend
The analysis intentionally keeps all observations in 2024. That makes the state ranking temporally consistent, but it cannot show whether Maine has been persistently high or whether Michigan has been persistently low. Fuel procurement, the mix of petroleum products, plant operation, and the set of reporting facilities can change over time. A trend analysis would need the same PET, sector 90, and heat-content definition for multiple years. Mixing “latest available” observations from different years would weaken comparability, so no cross-year substitution was used here.
Related EIA measures can add scale and operational context
A useful next step is to compare this heat-content series with petroleum consumption and net generation for the same sector and year. Consumption adds the physical quantity of fuel, while net generation adds the electricity output. Together, those measures can help separate a high energy-per-barrel value from a high total-energy-use state or a high-output state. Any multi-series comparison still requires careful identity matching. If the sector or petroleum definition changes between series, the apparent relationship can be driven by scope rather than by an underlying physical difference.
Source and calculation notes
The source is the U.S. Energy Information Administration Electric Power Operational Data system. The annual slice is fixed to 2024 with field heat-content, fueltypeid PET, sectorid 90, and state geography. The 50 reported values were used directly to calculate the mean, median, quartiles, standard deviation, ranks, and distribution counts in this article. Petroleum heat-content values on this EIA scale are presented as million Btu per barrel, abbreviated MMBtu/barrel. The tile map and extremes chart were generated from the same state data rather than copied from an external graphic.
Frequently Asked Questions
Which state had the highest and lowest 2024 average petroleum heat content?
Maine was highest at 6.3659 MMBtu per barrel, while Michigan was lowest at 4.0008. The 50-state median was 5.8027.
Does higher heat content mean a state used more petroleum or generated electricity more efficiently?
No. Heat content is energy per barrel. Consumption requires a fuel-quantity measure, and efficiency requires a metric such as heat rate together with electricity output.
Were any missing state values replaced with zero?
No. All 50 states have a 2024 observation in the PET, sector 90 slice, so no missing-value fill or cross-year substitution was used.
Related Articles
Green Map creates custom-edited map images using open geographic data sources such as geoBoundaries, Natural Earth, OpenStreetMap, and government open data. These maps are edited visual materials, not raw data files, and are provided for education, documents, presentations, and graphic reference.