Unemployment among people with intermediate education varied sharply across the economies reporting a 2023 value to the World Bank. The dataset contains 217 country and economy codes after aggregate groups are excluded, but only 103 have an observation for this indicator in 2023. The remaining 114 are preserved as missing rather than treated as zero. Across the 103 observations, the median is 6.186% and the mean is 7.711%, a difference that reflects a small group of very high values.
The indicator should be read narrowly. It is the unemployment rate within the labor force that has intermediate education, not the share of the whole population that is unemployed and not the share of workers who have this education level. That distinction matters because unemployment and labor-force participation answer different questions. A country can have a low unemployment rate for this education group while also having a relatively small share of the group participating in the labor market.
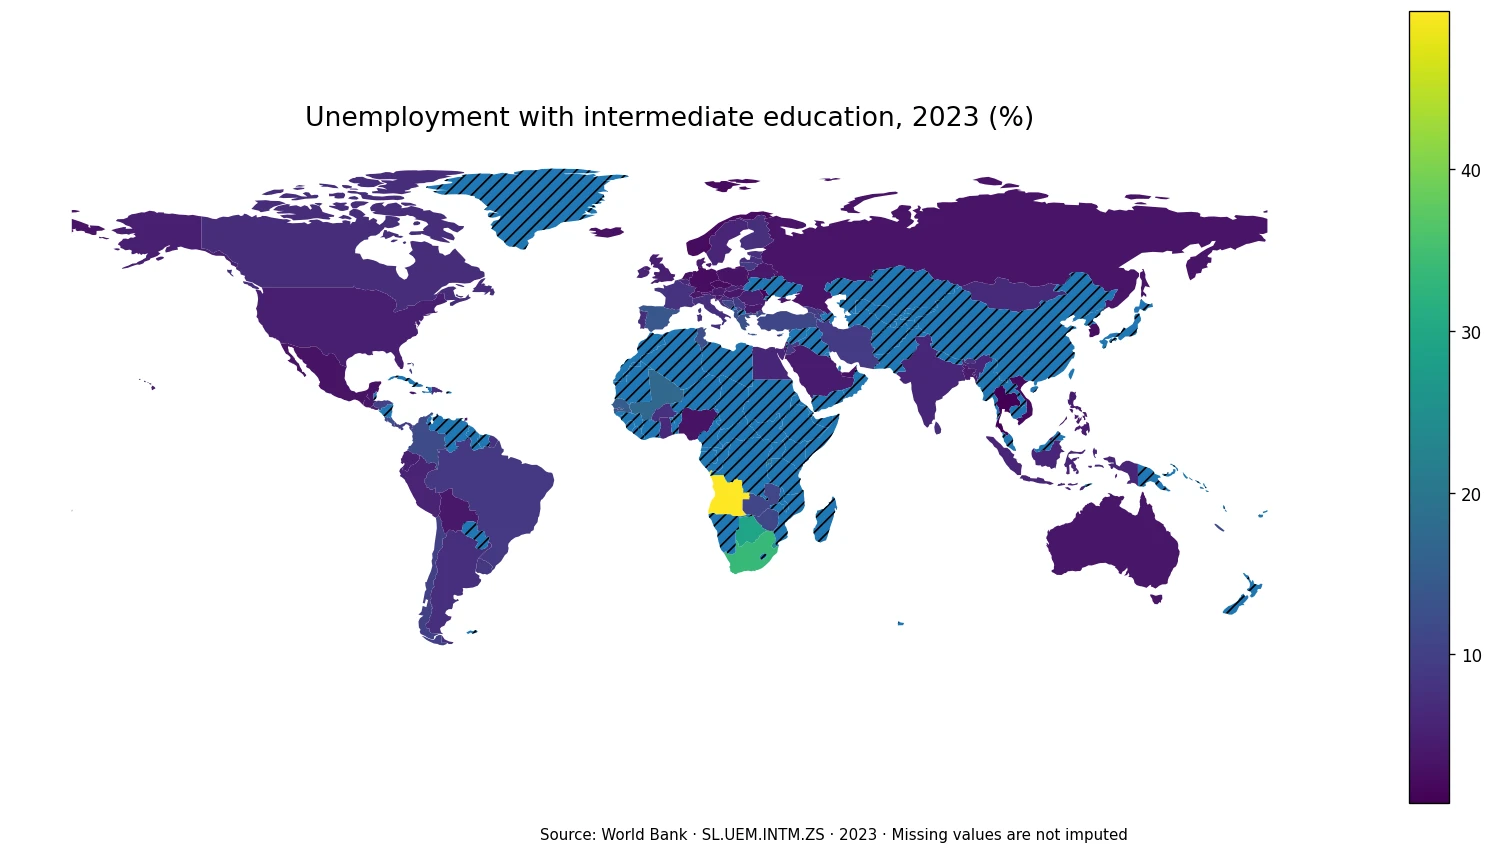
Table of Contents
What the indicator measures
World Bank indicator SL.UEM.INTM.ZS expresses unemployed people with intermediate education as a percentage of the total labor force with intermediate education. In practical terms, a value of 8% means that about eight out of every 100 people in the labor force belonging to this education category are unemployed. The labor force consists of people who are employed plus people who are unemployed and participating in the labor market. People outside the labor force are not part of this unemployment-rate denominator.
That denominator is the reason the indicator cannot be used as a stand-alone measure of educational attainment, job quality, wages, or overall employment. A low rate does not tell us whether jobs are formal, stable, productive, or well paid. A high rate shows that a larger share of participating people in this education group lack employment, but the dataset by itself does not identify why. Comparing the rate with participation, employment, age, sex, and industry indicators produces a more complete labor-market picture.
How the 103 reported values are distributed
The observed range is unusually wide: from 0.816% at the low end to 49.771% at the high end, a gap of about 49.0 percentage points. The first quartile is 3.833% and the third quartile is 9.098%, so the middle half of reporting economies lies in a band of roughly 3.8% to 9.1%. The distribution is concentrated at relatively modest rates even though a few economies sit far above that band.
Eleven economies are at or below 3%, 31 are above 3% and at or below 5%, and 28 are above 5% and at or below 8%. That means 70 of the 103 reported values are no higher than 8%. Another 12 fall between 8% and 10%, while 21 exceed 10%. Only four are above 20%. These high-end observations pull the mean above the median, which is why the 6.186% median is often a better description of the center of the distribution than the 7.711% mean alone.
Economies with the highest 2023 rates
| Economy | 2023 unemployment rate |
|---|---|
| Angola | 49.771% |
| South Africa | 33.612% |
| Botswana | 29.242% |
| Eswatini | 25.145% |
| Rwanda | 19.222% |
| Mali | 17.073% |
| Senegal | 14.839% |
| Spain | 13.978% |
| Albania | 12.823% |
| Greece | 12.816% |
Angola is the most pronounced outlier at 49.771%. South Africa follows at 33.612%, Botswana at 29.242%, and Eswatini at 25.145%. Rwanda is fifth at 19.222%, followed by Mali at 17.073% and Senegal at 14.839%. Spain, Albania, and Greece complete the top ten with rates between about 12.8% and 14.0%. The top of the ranking is therefore dominated by several African economies, but it is not confined to one region.
The African pattern is especially important because variation within the continent is also large. Nigeria records 3.286%, Egypt 6.085%, and Ghana 6.432%, far below Angola, South Africa, Botswana, and Eswatini. A continental label therefore hides substantial differences in the labor-market position of people with intermediate education. The map is most useful when it helps identify these clusters and contrasts rather than when it is used to assign one value or interpretation to an entire region.
Economies with the lowest 2023 rates
| Economy | 2023 unemployment rate |
|---|---|
| Thailand | 0.816% |
| Moldova | 1.546% |
| Viet Nam | 1.924% |
| Palau | 2.038% |
| Norway | 2.321% |
| Czechia | 2.439% |
| Korea, Rep. | 2.490% |
| Germany | 2.524% |
| United Arab Emirates | 2.786% |
| Tonga | 2.877% |
Thailand has the lowest observed value at 0.816%. Moldova follows at 1.546%, Viet Nam at 1.924%, and Palau at 2.038%. Norway, Czechia, the Republic of Korea, Germany, the United Arab Emirates, and Tonga make up the rest of the ten lowest observations, all below 2.9%. These are unemployment rates for the intermediate-education labor force only; they should not be interpreted as economy-wide unemployment rates.
Low unemployment can emerge under very different labor-market conditions. Strong labor demand may be one factor, but labor-force participation, informal work, demographic composition, migration, continued study, and discouragement from job search can also shape the observed rate. The indicator does not separate those mechanisms. As a result, the bottom of the ranking should not be treated as a quality ranking of national labor markets. It is a descriptive comparison of one education-specific unemployment measure.
Spatial contrasts visible on the map
The strongest high-rate cluster is visible in parts of southern Africa. Angola, South Africa, Botswana, and Eswatini all stand out, while Rwanda is also high. Yet nearby or same-continent economies can look very different. Nigeria is close to 3.3%, Egypt to 6.1%, Ghana to 6.4%, and Zambia to 11.0%. This sharp within-region dispersion is one of the main reasons a country map adds information beyond a simple global ranking.
Europe also contains a wide range. Spain is at 13.978% and Greece at 12.816%, while Germany is at 2.524%, Czechia at 2.439%, and Norway at 2.321%. France is at 8.073%, Italy at 7.396%, and the United Kingdom at 4.836%. In Asia, Thailand and Viet Nam are below 2%, whereas Turkiye reaches 11.225%, Iran 9.142%, and Jordan 9.055%. These neighboring contrasts caution against assuming that broad geographic proximity produces similar labor outcomes.
The Americas show another set of differences. The United States records 4.888%, Canada 6.953%, and Mexico 3.293%. In South America, Colombia reaches 11.745%, Chile 10.144%, Brazil 8.832%, and Argentina 7.421%. The map therefore shows both regional clustering and local exceptions. The useful question is not simply which continent is high or low, but where nearby economies diverge and which additional labor-market indicators might explain the difference.
Why high and low values need careful interpretation
An education-specific unemployment rate is an outcome of several interacting processes. The supply of workers with that education level, the type of jobs being created, the sector mix of the economy, the business cycle, public-sector hiring, migration, and the age profile of the group can all matter. The 2023 cross-section can reveal where the outcome differs, but it cannot establish which of these factors caused the difference. Causal explanations require additional evidence and often country-specific analysis.
The unemployment rate also excludes people who are not in the labor force. Someone who is not working and is not counted as unemployed because they are not seeking work is outside this denominator. For that reason, comparing unemployment without participation can miss an important part of labor-market disengagement. Two economies can report the same unemployment rate while having very different participation rates among people with intermediate education.
Pairing unemployment with labor-force participation
Labor-force participation for people with intermediate education is a natural companion measure. Participation asks what share of the working-age population in this education group is economically active. Unemployment asks what share of that active group does not have a job. Reading the two together helps distinguish a low-participation problem from a job-matching problem among people who are already in the labor force.
Comparisons across education levels can add another layer. If basic, intermediate, and advanced education unemployment rates are available for the same year and definitions, they can show whether job-finding outcomes differ systematically by education. Even then, the groups may have different age structures and participation patterns, so the results should not be reduced to a simple statement that one education level is always better. The comparison is strongest when the year, denominator, source methodology, and population coverage are kept aligned.
Missing data are not zero unemployment
The source frame contains 217 country and economy codes, but 114 do not have a 2023 value in this dataset. Those missing observations are not replaced with zero and are excluded from the mean, median, ranking, and distribution counts. Several major economies, including China and Japan, have no value in this single-year frame. A blank area on the map therefore means “no 2023 observation in this dataset,” not “no unemployment.”
At the low-resolution world boundary used for the visual, 93 of the 103 valid observations can be joined to a distinct polygon. Some small islands and separately reported territories, such as Palau, Tonga, Singapore, and Hong Kong, are not drawn as separate areas at this resolution even though their values remain in the tables and summary statistics. This is a cartographic limitation, not a data deletion. Country tables are the safer reference when exact small-territory values matter.
Limits of a single-year comparison
This article uses one common comparison year, 2023. That keeps the cross-country ranking internally consistent, but it also means the map is a snapshot rather than a trend. Unemployment can respond quickly to recessions, recoveries, policy changes, or temporary shocks. A multi-year analysis would be needed to determine whether a high or low 2023 value is persistent. Mixing 2022, 2023, and 2024 observations to fill geographic gaps would create a visually fuller map but a less comparable one, so the missing values are left missing.
The World Bank country/economy framework may also include separately reported territories, so the 103 observations should not be described as 103 sovereign states. The most reliable use of this map is to identify large differences, outliers, and neighboring contrasts, then follow up with participation, employment, wage, age, sex, and sector indicators from compatible sources. That approach preserves what the indicator can tell us without asking it to answer questions outside its statistical definition.
Frequently Asked Questions
What does unemployment with intermediate education mean?
It is the share of the labor force with intermediate education that is unemployed. It is not the unemployment rate for the whole economy and not the share of all unemployed people with that education level.
Does a lower rate automatically mean a stronger labor market?
No. The rate covers only people in the labor force. Participation, job quality, wages, informal employment, and demographic composition can differ substantially even when unemployment rates are similar.
Were missing 2023 observations treated as zero?
No. The 114 country and economy codes without a 2023 observation remain missing and are excluded from the mean, median, rankings, and mapped values.
Related Articles
Green Map creates custom-edited map images using open geographic data sources such as geoBoundaries, Natural Earth, OpenStreetMap, and government open data. These maps are edited visual materials, not raw data files, and are provided for education, documents, presentations, and graphic reference.