Simpson County sits on Kentucky’s southern edge, where Franklin forms the clear local center and Interstate 65 runs north to south through the middle of the county. This Simpson County Kentucky map set separates that geography into four useful views: a county road map, a simplified city map, a terrain-and-water map, and an elevation map. Together they show Franklin, I-65 and the surrounding state highways, Red River and the Drakes Creek tributaries, and relief that ranges from roughly 141 to 282 meters. After reviewing the web previews, visitors can download a ZIP containing all four high-resolution JPG files.
The county is compact enough that its main patterns are easy to recognize. Franklin lies a little south of the geographic center, with local roads spreading outward into rural areas. Warren County is to the north, Logan County to the west, and Allen County to the east, while the southern county line is also the Kentucky–Tennessee state boundary. That combination of a single dominant city, a major interstate, and many small creek valleys gives Simpson County a different visual character from Kentucky counties with several similarly sized towns or a large reservoir.
Table of Contents
Franklin at the center of the I-65 corridor
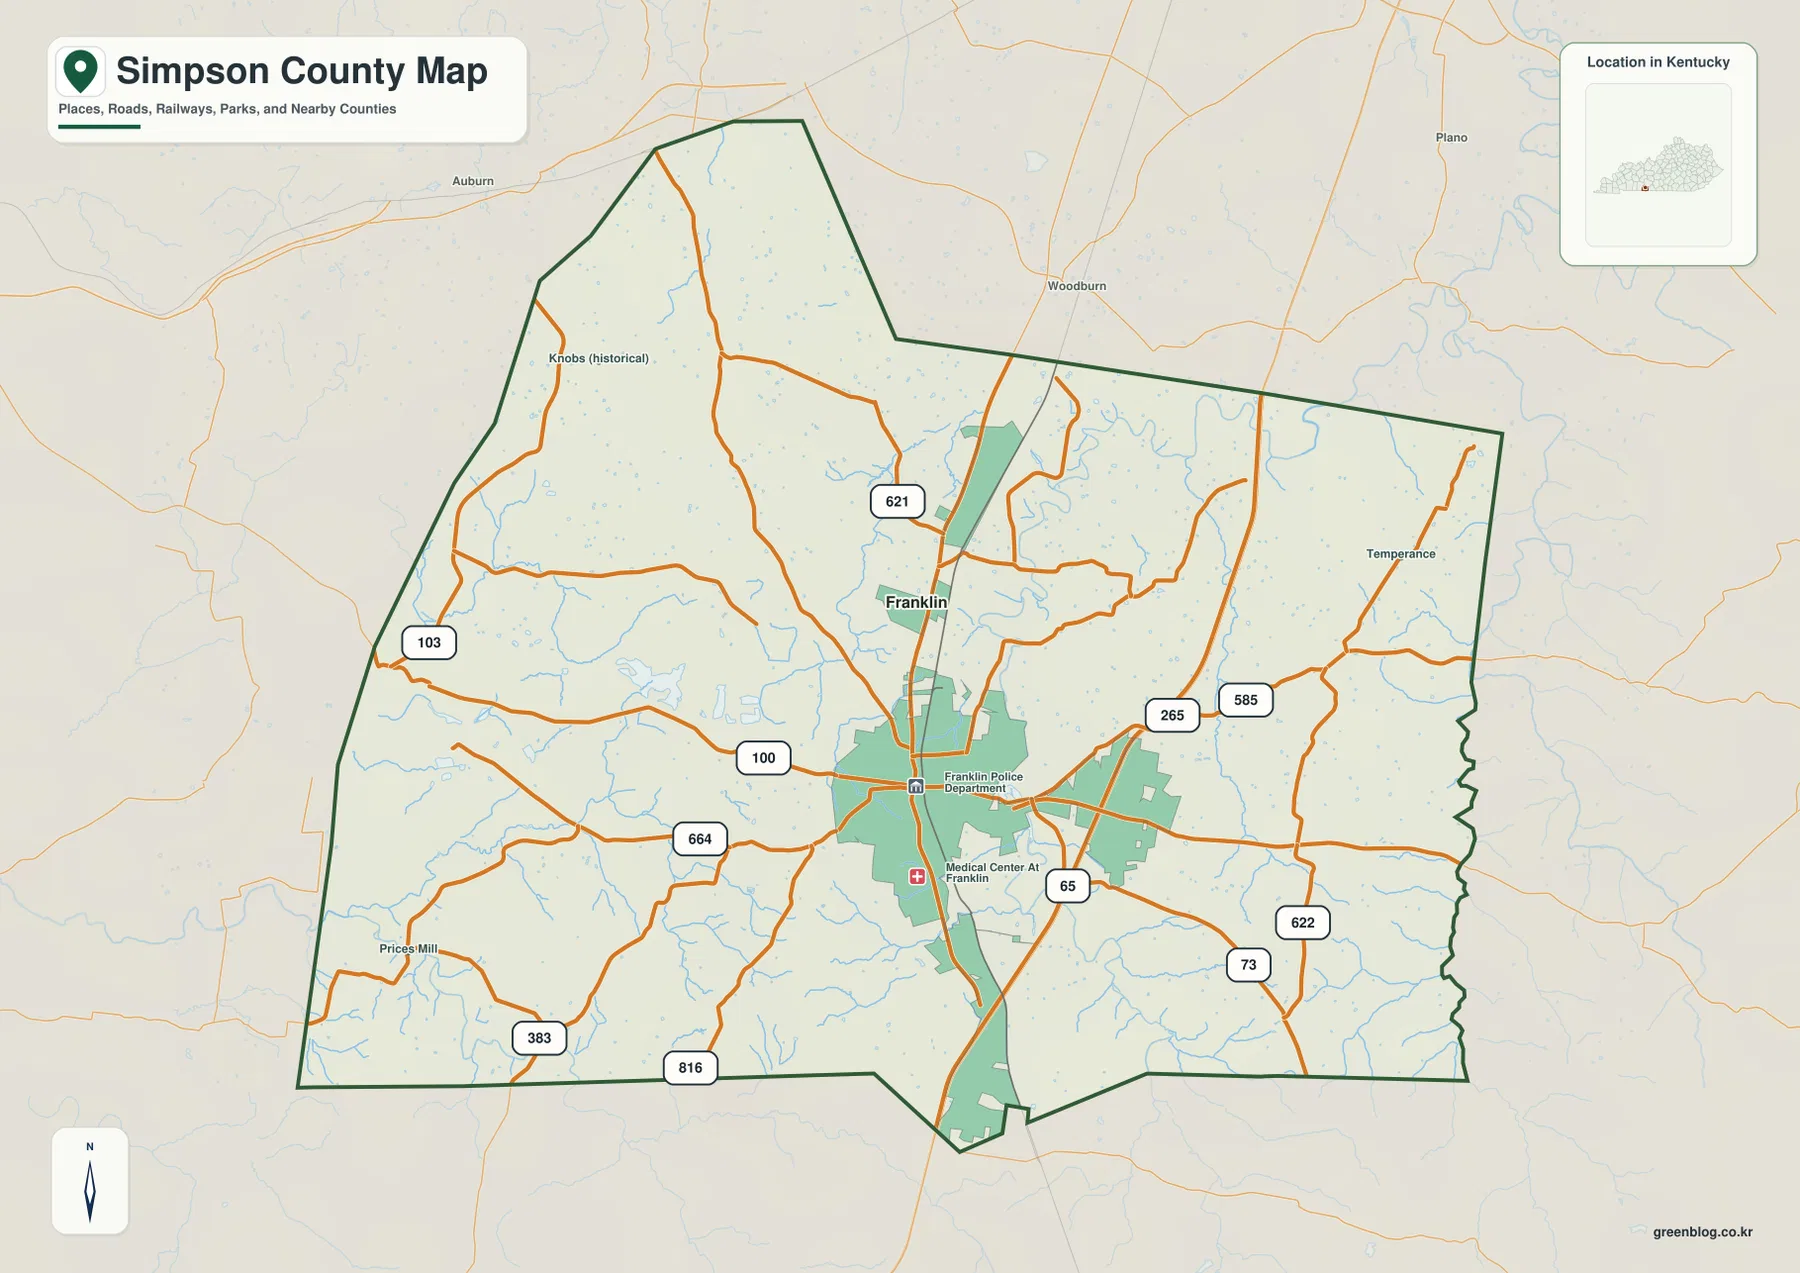
The general county map makes I-65 the easiest feature to follow. The interstate enters from Warren County, passes just east of Franklin, and continues south across the state line toward Tennessee. Franklin occupies the broadest developed area on the map, and several numbered routes converge around it. KY 100 extends across the county, while KY 73, 585, 621, 622, 664, 383, and 816 connect different rural sections to the Franklin area. The contrast between the straight interstate corridor and the more winding local roads is visible at a glance.
West of Franklin, KY 100 and KY 664 reach across the rolling countryside, while KY 383 runs toward the southwest. East of the city, KY 100 approaches the KY 265 and KY 585 area, and KY 73 and KY 622 serve the southeast. KY 621 runs northward from the Franklin area. Many of these local routes bend rather than following a strict grid, reflecting the shallow creek valleys and low ridges that become more obvious on the terrain maps.
The map also includes useful reference places outside or near the county. Auburn appears beyond the northwest side, Woodburn is visible to the northeast, and Temperance is marked in the eastern part of the county. These labels help orient a reader who is trying to place Franklin in relation to neighboring communities rather than treating the county boundary as an isolated shape. The developed footprint around Franklin stands out sharply from the more lightly marked countryside.
Franklin’s position on I-65 is not only a map observation. The Franklin-Simpson County Tourism Commission describes the community as being between Bowling Green, Kentucky, and Nashville, Tennessee, along I-65. That regional location explains why the interstate is such a strong visual anchor on the county map. For actual driving, however, this image should be treated as a geographic overview rather than a live navigation product; construction, closures, and current traffic conditions require an up-to-date road service.
A city map built around one dominant center
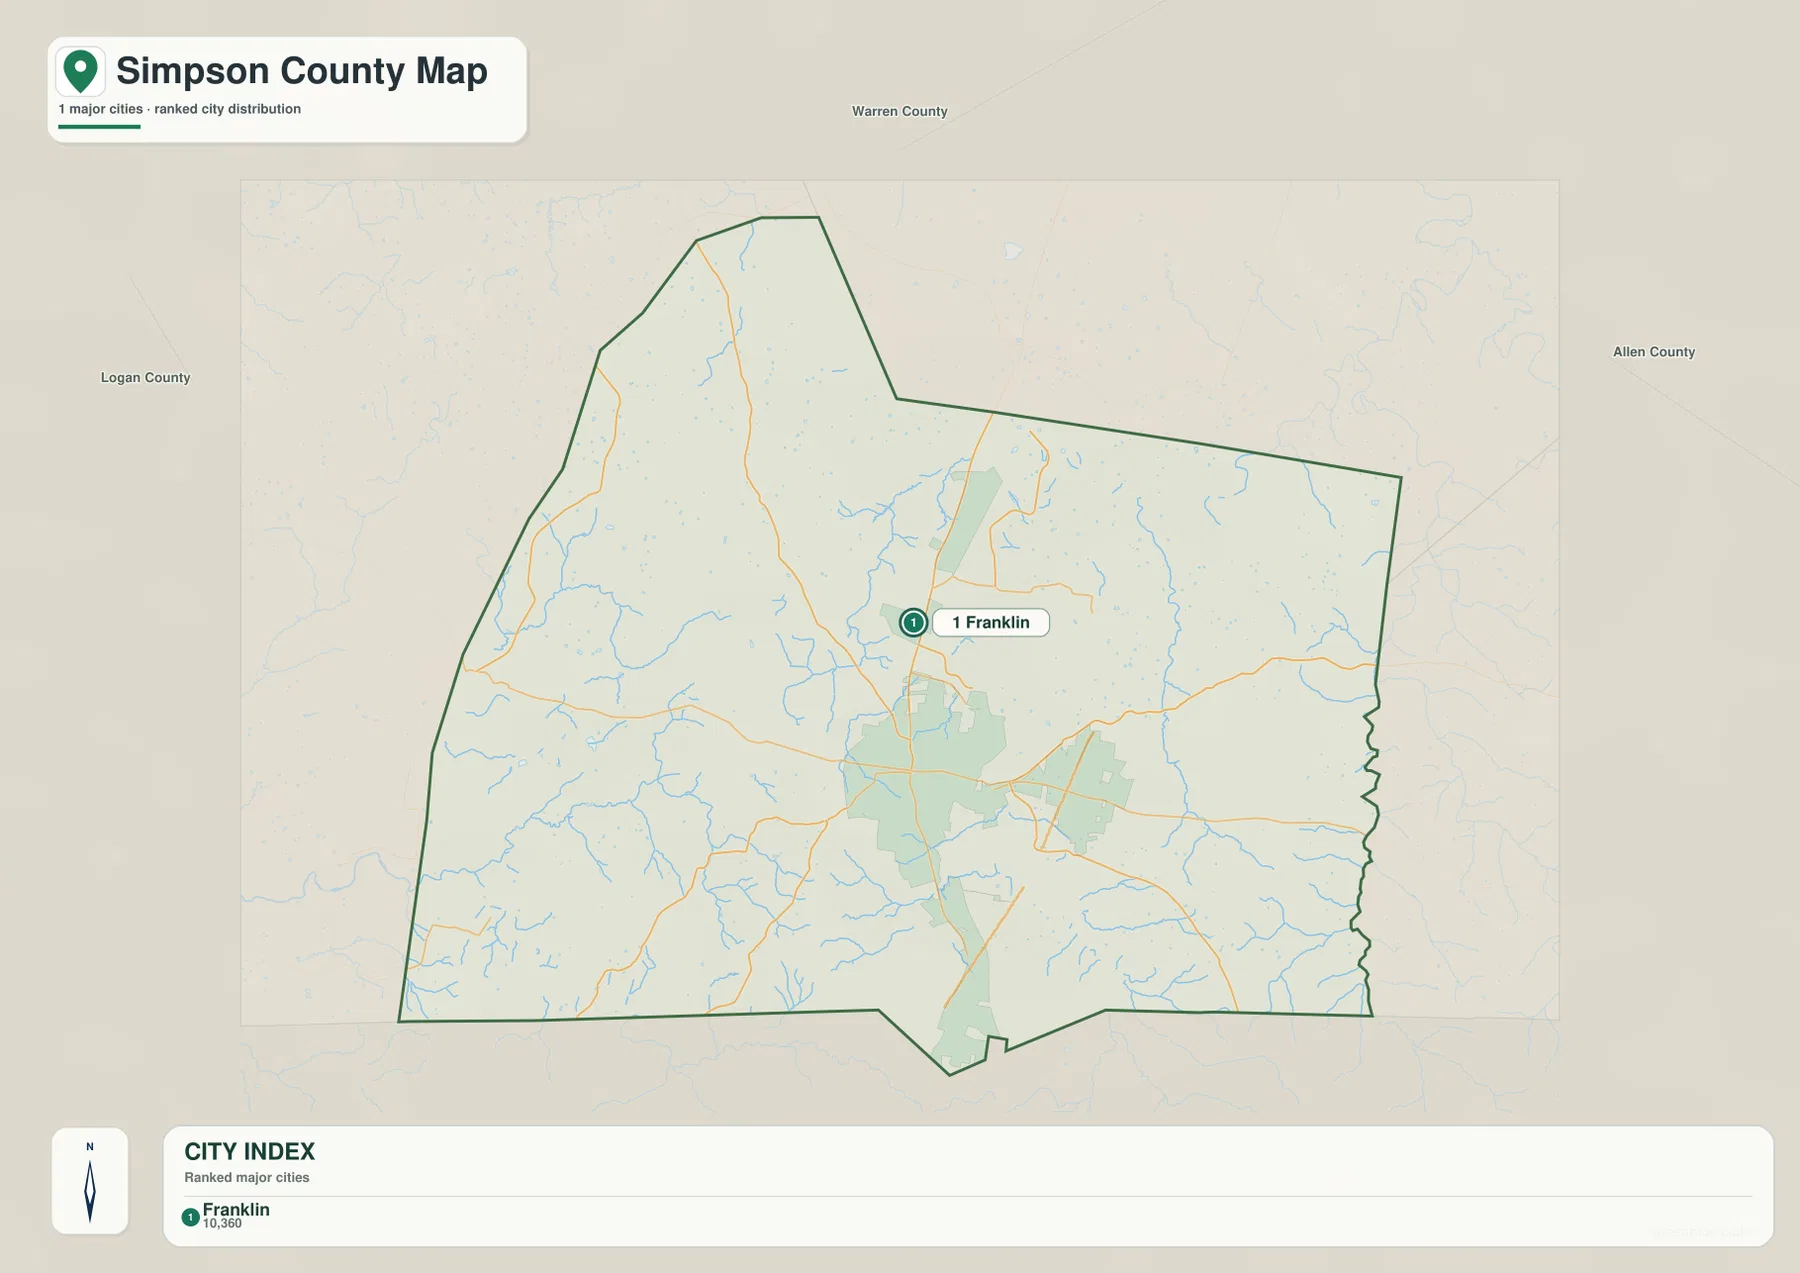
The city map is intentionally sparse. Franklin is the only major city highlighted in the ranked city display, making the county’s settlement pattern unusually straightforward. The city sits slightly south of center, while the labels for Warren, Logan, and Allen counties frame the map on the north, west, and east. Because the southern edge of Simpson County is the state line, the map also works well for showing how close Franklin is to Tennessee without filling the page with minor road labels.
This simplified version is useful when the general county map contains more detail than a presentation or classroom handout needs. A reader can first identify Franklin and the neighboring counties here, then move to the general map to trace I-65 and the numbered highways. Keeping those tasks separate makes the geography easier to explain, especially for someone unfamiliar with southern Kentucky.
The city index includes a numeric value next to Franklin, but it is best treated as part of the map’s internal city-ranking dataset rather than assumed to be a current official population count. Anyone who needs current demographic figures should consult the U.S. Census Bureau or local government sources. The purpose of this file is location: it shows where the principal urban area sits inside the county and how that center relates to the surrounding county lines.
Simpson County’s official website describes a community where economic activity and agriculture both remain important. The maps support that broad visual picture without attempting to classify individual parcels. Franklin is concentrated in one central area, while the rest of the county is crossed by local roads and many small drainage lines. The city map therefore should not be read as if the unshaded rural portions were empty; it is simply a deliberately reduced view of settlements.
Red River, Sinking Creek, and the Drakes Creek branches
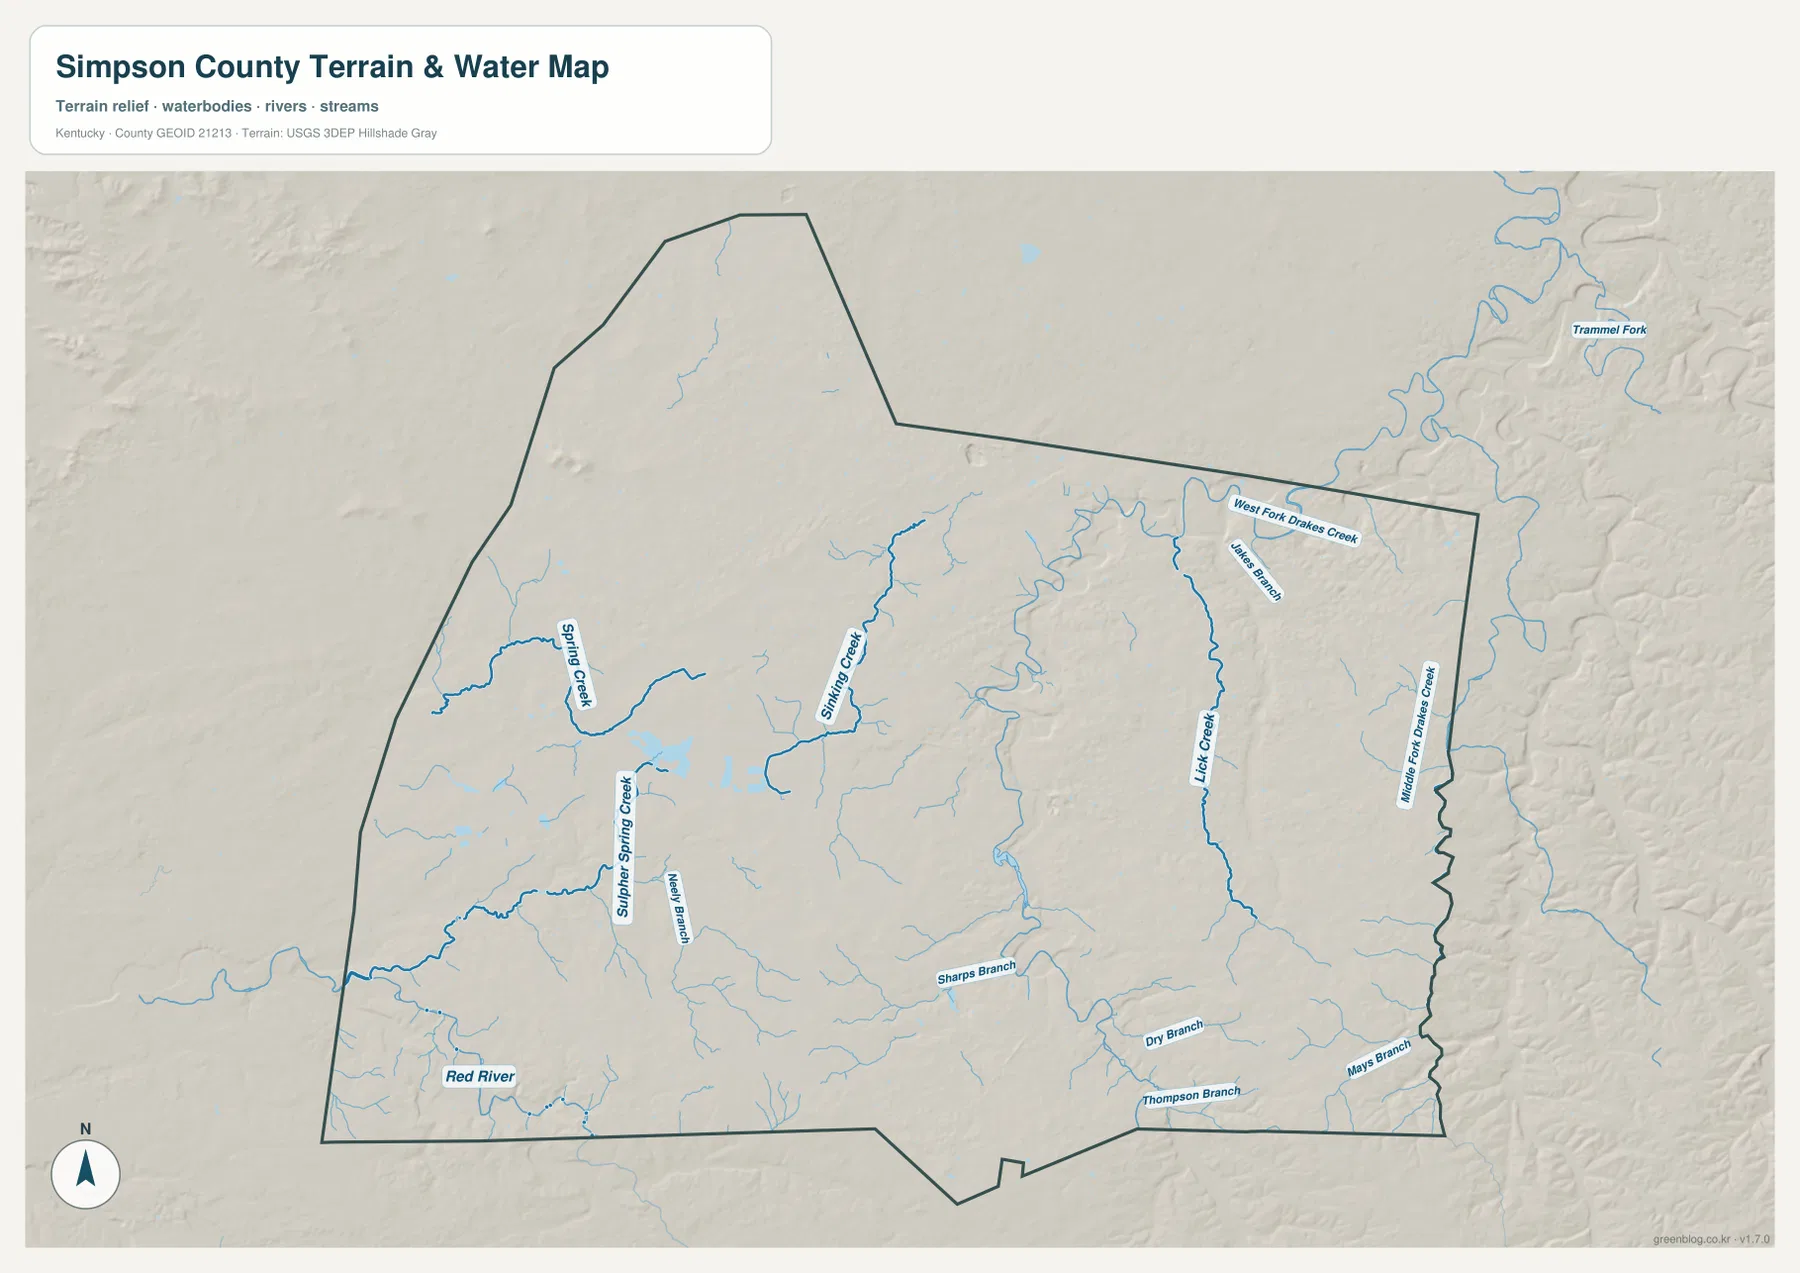
The terrain-and-water map changes the emphasis completely. Instead of highways and developed areas, it brings forward the numerous creeks that dissect the county. Red River is labeled along the southwest, while Spring Creek and Sulphur Spring Creek occupy western drainage areas. Sinking Creek runs through the west-central portion of the county. These streams are joined by many shorter unnamed or lightly labeled tributaries, creating a fine network across the rolling ground.
Eastern Simpson County has its own distinct group of waterways. Lick Creek forms a long north-south feature, and the northeast includes West Fork Drakes Creek and Slate Branch. Middle Fork Drakes Creek follows the area near the eastern boundary. Farther south, Dry Branch, Thompson Branch, and Mays Branch appear among smaller drainage lines. The result is not a single dominant river system on the map but several creek networks that occupy separate shallow valleys.
Comparing this map with the county road map helps explain why many local routes curve. Roads frequently cross or follow the spaces between drainage lines, while the creeks occupy lower terrain. Around Franklin, several small channels weave through the broader developed zone, but they are much easier to distinguish here because the map removes most urban detail and adds shaded relief. In the east, the long low corridors around Lick Creek and the Drakes Creek branches are especially clear.
This water map is designed for geographic orientation, not for floodplain, water-quality, parcel, or legal-boundary decisions. A blue stream line shows relative location and drainage pattern; it does not establish flood risk, channel ownership, exact bank position, or safe crossing conditions. For those questions, readers should use current specialized products from agencies such as USGS, FEMA, Kentucky authorities, or the local government. Its strength is showing how the named creeks relate to one another and to the county’s terrain.
Relief from about 141 to 282 meters
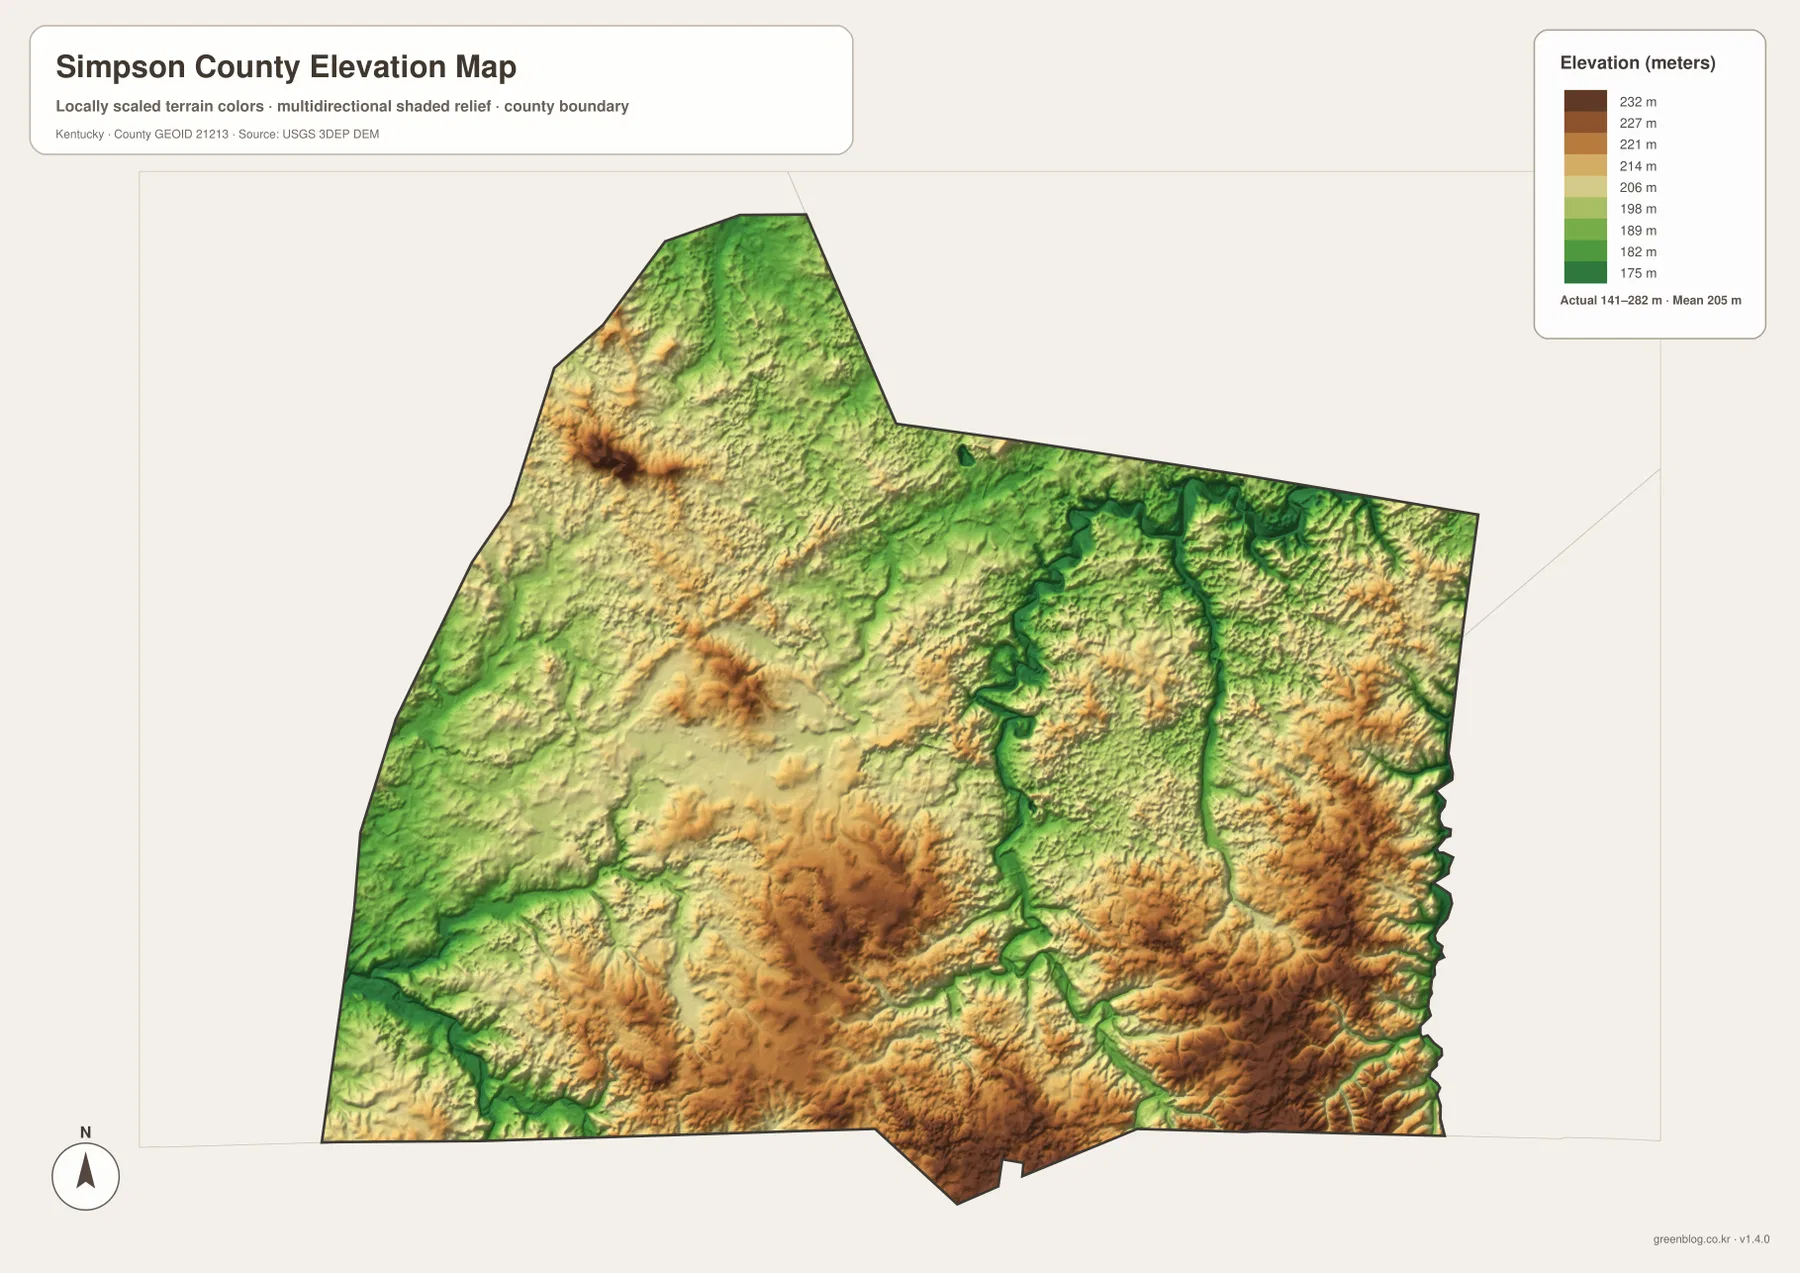
The elevation map reports an actual county range of roughly 141 to 282 meters, with a mean around 205 meters. Greens represent lower terrain, while yellow, tan, and brown mark progressively higher ground. Simpson County is not mountainous, yet the shaded relief makes clear that it is not a flat plain either. Rounded uplands rise between creek valleys, and narrow green corridors trace many of the same drainage lines shown on the water map.
A higher patch stands out in the west-central part of the county, with additional elevated ground across the south-central and southeastern areas. The lower terrain is more continuous along creek corridors in the central and eastern sections. In particular, the low green channels near Lick Creek and the Drakes Creek system create long, branching shapes through surrounding hills. Similar relationships appear in the western drainage areas around Spring Creek and the Red River tributaries.
The southern state-line area varies considerably instead of ending on one level surface. Higher ridges occur in several places, separated by lower channels. That contrast helps explain why road lines sometimes bend sharply even though the county is relatively small. When the elevation map and road map are viewed side by side, the interstate appears comparatively direct, whereas many county and state routes negotiate the rolling terrain and stream crossings.
These colors are locally scaled to make differences within Simpson County visible. They should not be interpreted as survey-grade elevation for a specific property, construction site, or drainage design. Engineering and legal work requires higher-resolution source data and, often, field surveying. For educational and regional use, however, the 141–282 meter range and the mean near 205 meters provide a useful summary of how modest uplands and creek-cut lowlands alternate across the county.
The Kentucky–Tennessee line and the neighboring counties
Simpson County’s southern boundary has extra geographic importance because it is also the state boundary. I-65 crosses that line on its way south, linking Franklin with places beyond Kentucky. On the other sides, Warren County provides the northern connection toward Bowling Green, Logan County frames the west, and Allen County lies to the east. This arrangement gives a reader a quick regional reference even before looking at a statewide map.
The county boundary is not perfectly rectangular. The northern edge steps and angles around the Warren County side, while the eastern edge has irregular sections near creek country. Natural drainage does not simply follow the administrative line: branches near the Drakes Creek system approach or cross the broader border area, and the Red River drainage in the southwest cuts across the landscape independently of county geometry. This is a useful reminder that political boundaries and watersheds describe different kinds of geography.
For a regional presentation, a clear sequence is to begin with the city map to establish Franklin and the neighboring counties, then use the general map to add I-65 and the local road network. The terrain-and-water and elevation maps can follow to explain what lies between those roads. That order turns a simple location map into a fuller picture of a border county shaped by transportation, agriculture, small stream valleys, and rolling uplands.
Choosing the right Simpson County file
Each file answers a different question. The general county map is the best starting point for Franklin, I-65, KY 100, KY 73, and the county boundary. The city map removes most of that detail so the location of Franklin and the directions toward Warren, Logan, and Allen counties are easier to see. The terrain-and-water map is the choice for Red River, Sinking Creek, Lick Creek, and the Drakes Creek branches. The elevation map is most useful when the goal is to compare low creek corridors with higher rolling ground.
- County map: best for Franklin, I-65, KY 100, KY 73, KY 383, KY 585, KY 621, and the overall road-and-boundary pattern.
- City map: best for a clean view of Franklin and the directions toward Warren, Logan, and Allen counties.
- Terrain and water map: best for Red River, Spring Creek, Sinking Creek, Lick Creek, West Fork Drakes Creek, Middle Fork Drakes Creek, and smaller branches.
- Elevation map: best for comparing the approximately 141–282 meter range, low drainage corridors, and higher rolling areas.
For classroom use, one practical approach is to locate Franklin and I-65 first, identify the county’s state-line position second, and then compare the creek and elevation maps. The same creek corridors that appear as blue lines on the water map often reappear as green lowlands on the elevation map. That visual connection makes it easier to explain why drainage, topography, and road alignment are related without turning the lesson into a technical GIS exercise.
The original JPG files measure 2572 by 3638 pixels each, providing more detail than the web previews for labels, road numbers, creek names, and shaded relief. When printing, preserve the aspect ratio and choose a page size large enough to keep small labels legible. Because the maps emphasize different information, selecting the relevant file usually produces a cleaner result than trying to force all four themes into a single graphic.
Frequently Asked Questions
Which map is best for seeing Franklin and I-65 together?
Use the general county map. It shows the Franklin developed area, I-65, and the numbered state highways in the same frame, making it the most useful overview for transportation and location. If you only need Franklin’s position relative to Warren, Logan, and Allen counties, the simplified city map is cleaner.
Where can I see Red River and the Drakes Creek branches?
The terrain-and-water map is the appropriate file. It labels Red River in the southwest, Spring Creek and Sulphur Spring Creek in the west, Sinking Creek near the center-west, Lick Creek in the east, and West Fork and Middle Fork Drakes Creek in the northeastern and eastern areas. It is a geographic reference map, not a flood-risk or water-quality product.
Can the 141–282 meter elevation map be used for surveying?
No. The elevation map is intended to compare broad terrain differences across Simpson County. The approximately 141–282 meter range and mean near 205 meters are useful for understanding creek valleys and rolling uplands, but property surveys, engineering, drainage design, and construction require more precise source data and professional measurements.
Map File Information
The ZIP contains high-resolution JPG versions of the Simpson County general map, city map, terrain-and-water map, and elevation map. Review Franklin, I-65, the Red River and Drakes Creek networks, and the roughly 141–282 meter terrain in the previews, then use the files that fit your project.
- Included Files: Use only the versions confirmed in the article and supplied images
- File Type: Use the confirmed download contents
- Intended Use: Printing, education, presentations, and map-based projects
Related Maps
Sources and references
The road, settlement, water, and elevation descriptions are based primarily on the supplied Simpson County map assets, with the following official and public sources used for regional context and geographic data background.
- Simpson County, Kentucky official website — local government and community information for Simpson County and Franklin.
- Franklin-Simpson County Tourism Commission — official visitor information describing Franklin’s regional setting along I-65.
- U.S. Census Bureau TIGER/Line Shapefiles — official geographic boundary and transportation data resources.
- USGS National Hydrography — official hydrographic data background for rivers, creeks, and water features.
- USGS 3D Elevation Program — official U.S. elevation and terrain data program.
Green Map creates custom-edited map images using open geographic data sources such as geoBoundaries, Natural Earth, OpenStreetMap, and government open data. These maps are edited visual materials, not raw data files, and are provided for education, documents, presentations, and graphic reference.