Robertson County occupies a compact piece of northeastern Kentucky, with Mount Olivet serving as the county seat and the clearest reference point on the maps. This Robertson County Kentucky Map set brings together the boundary and road network, the county’s single indexed major city, named rivers and creeks, and a generalized elevation surface. The original JPG files can be downloaded from this page, so the maps are useful both for quick on-screen orientation and for larger printed reference sheets. High-resolution map files are available for download in the section below.
The county government describes Robertson County as lying between the Licking River and Bluegrass regions. It was organized in 1867 from parts of Bracken, Harrison, Mason, and Nicholas counties, and it remains a small rural county today. That compact scale makes the relationship between Mount Olivet, the road network, creek valleys, and surrounding counties easier to see in one view than it would be in a much larger county. Reading the four maps together also helps explain why local roads bend across short ridges instead of forming a simple grid.
Table of Contents
Mount Olivet anchors the county road network
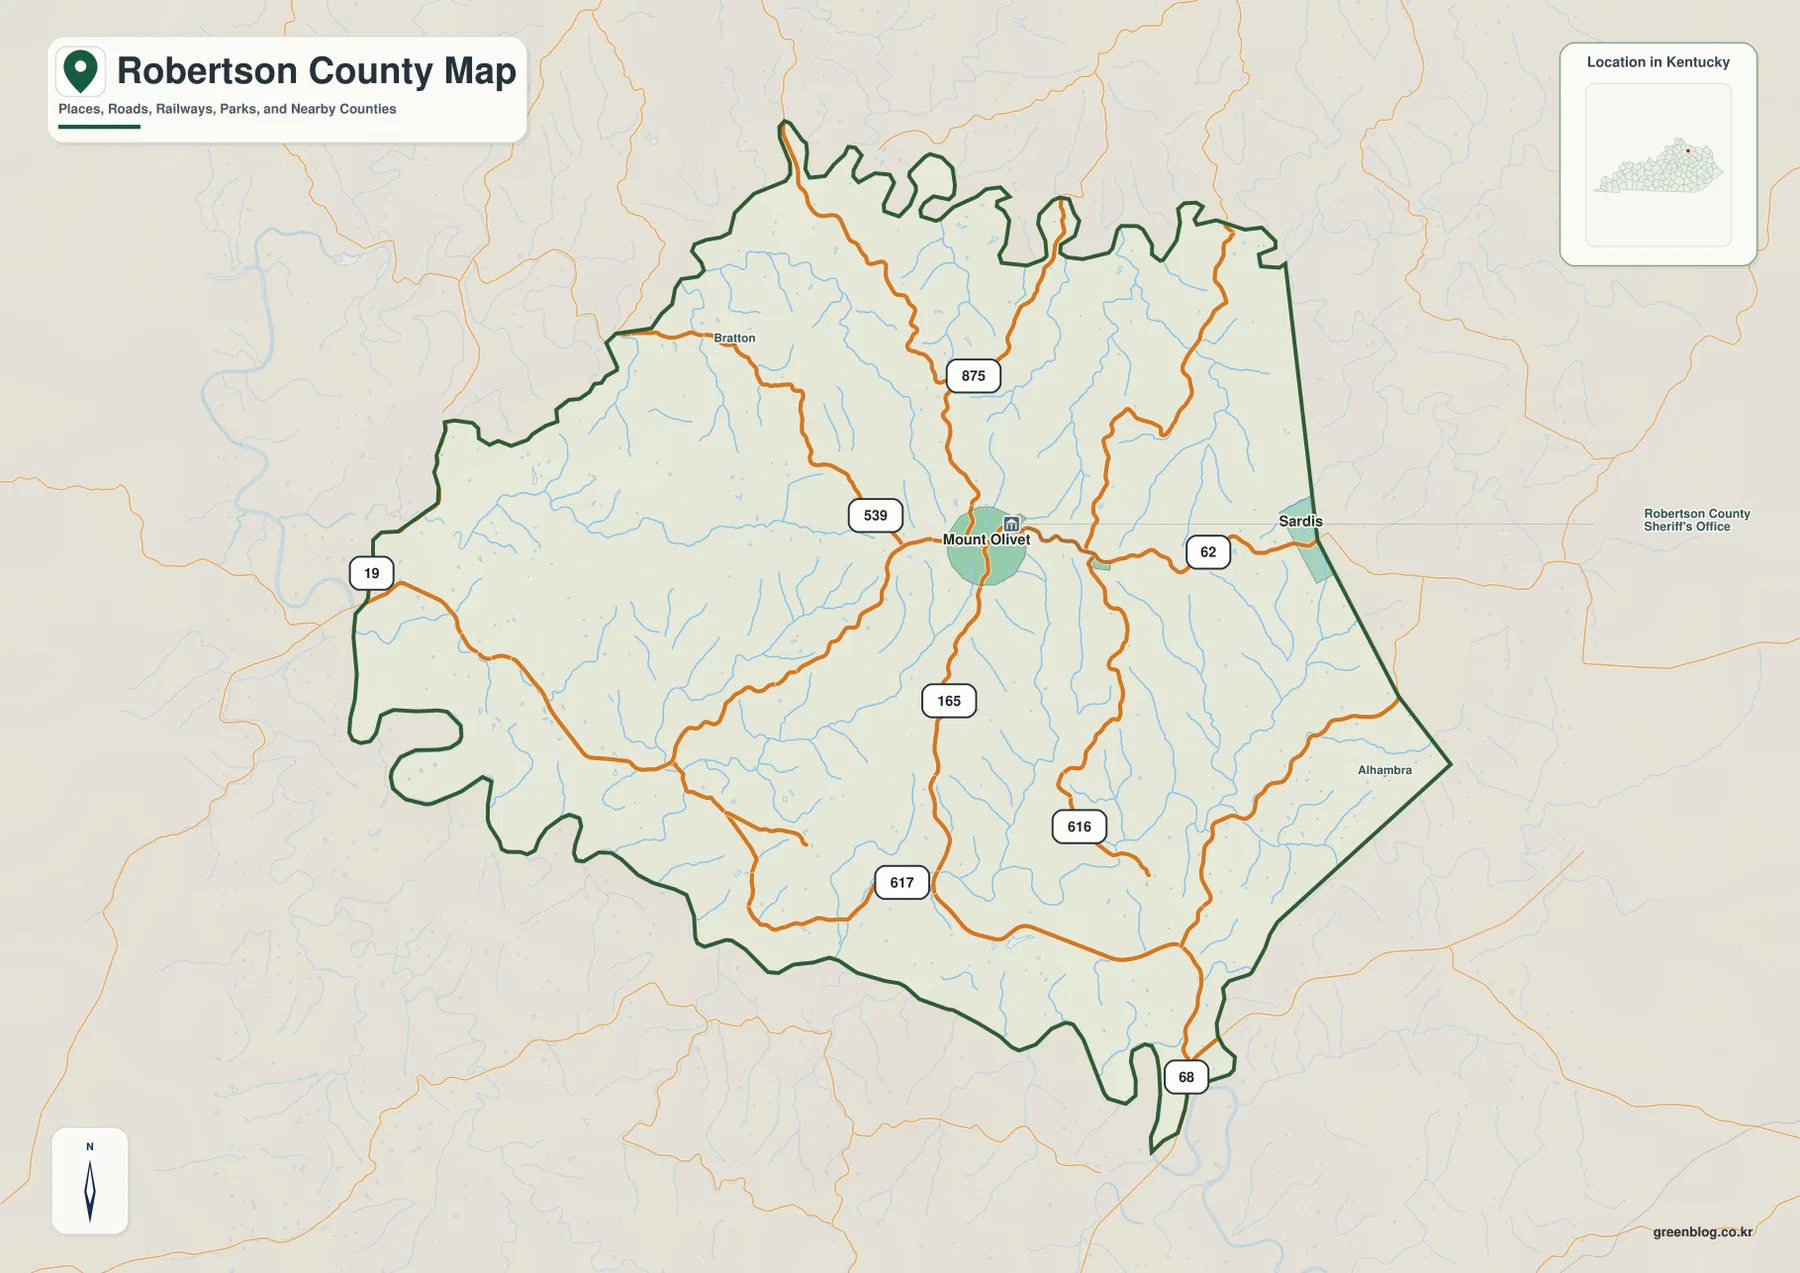
On the general county map, Mount Olivet sits near the middle of the county and functions as the main road reference. U.S. Route 62 crosses through town, while Kentucky Route 165 runs south from the same area. Robertson County’s tourism page also identifies Mount Olivet as the junction of U.S. 62 and KY 165, which matches the road pattern shown on the map. KY 539 reaches northwest from the central area, KY 875 runs north, and routes such as KY 616 and KY 617 serve the southern part of the county.
The outer boundary is unusually irregular for such a small county. The northern edge contains several narrow bends and protrusions, the west side folds around creek-cut terrain, and the southern edge narrows in places before reaching the area where KY 68 is marked. Neighboring county labels provide useful orientation: Bracken County is to the north, Mason and Fleming are on the eastern side, while Harrison, Nicholas, and Pendleton appear around the western and southwestern side. Keeping those names visible makes the map more useful for readers who are trying to place Robertson County within northeastern Kentucky rather than viewing it in isolation.
Smaller place labels add local context that a statewide map would usually omit. Bratton appears northwest of Mount Olivet, Sardis lies to the east along the U.S. 62 corridor, and Alhambra is shown near the southeastern side. KY 19 is visible along the western edge and KY 68 near the southern tip. These details are helpful for geographic orientation, but the map is not a live navigation product. Current closures, road conditions, and driving directions should be checked through the Kentucky Transportation Cabinet or another current transportation source.
A city map built around one clear center
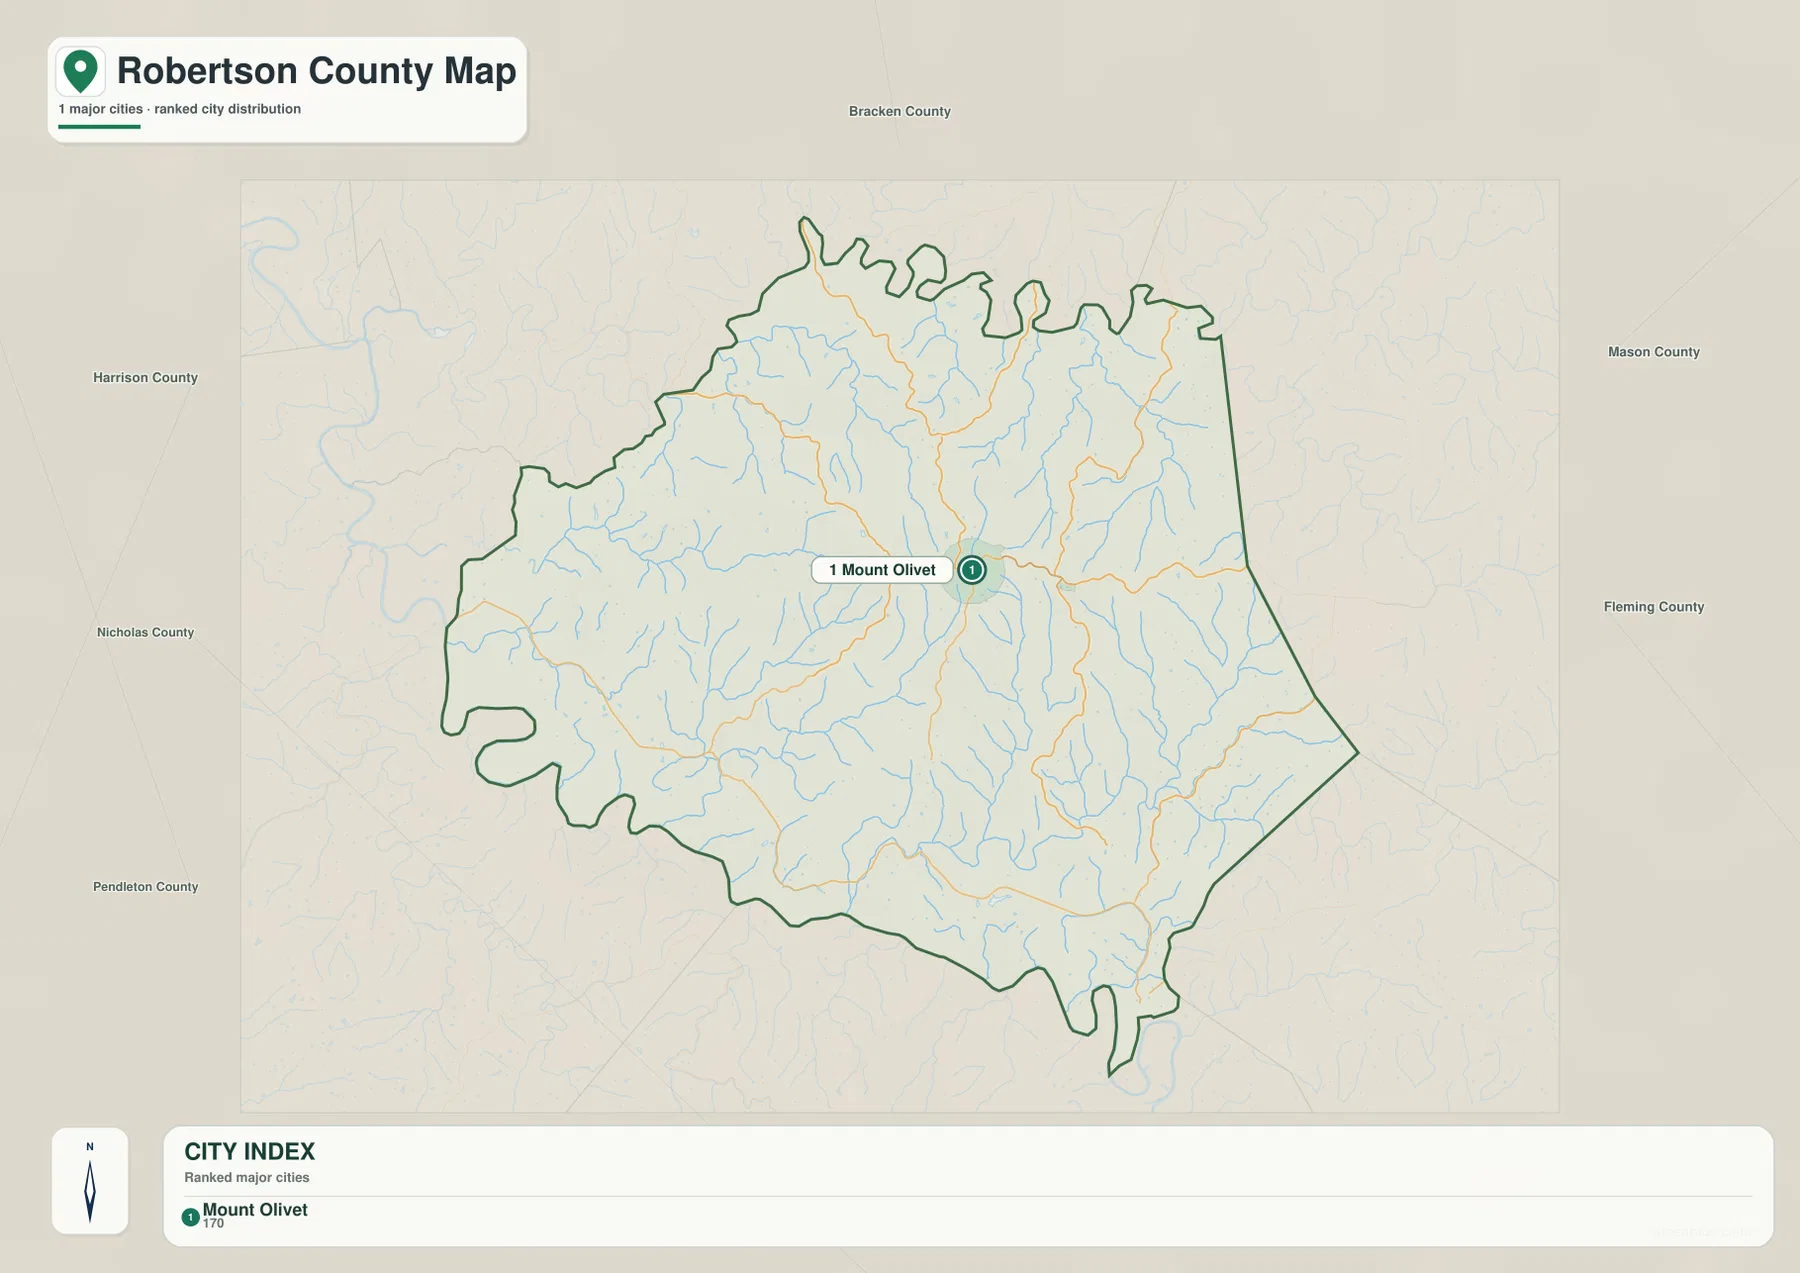
The city map is intentionally simple. Its ranked city index contains one major city, Mount Olivet, so there are no multi-city connector lines or city-to-city distance comparisons in this version. Instead, the map places Mount Olivet inside the county outline and leaves the surrounding county names visible. That design is useful in a county where the main question is often not which large city is closest to another, but where the county seat sits relative to the county boundary and its neighbors.
From Mount Olivet, Bracken County lies beyond the northern boundary, while Mason and Fleming are shown to the east. Harrison and Nicholas provide orientation on the west side, and Pendleton appears farther southwest. The map also retains faint roads and streams in the background, so Mount Olivet can be understood as part of the same road-and-valley landscape shown in greater detail on the other maps. For a classroom handout or a simple county locator, this uncluttered view can be easier to read than the full road map.
The official county site identifies Mount Olivet as the county seat, and its central placement on the map helps explain why county government functions are concentrated there. The map should not be read as a complete inventory of every community, settlement, or named locality in Robertson County. Its purpose is narrower: it highlights the principal city reference and the surrounding county context. Readers who need smaller community names can return to the general county map, where more local labels and numbered highways are visible.
Licking River tributaries cut a dense network of valleys
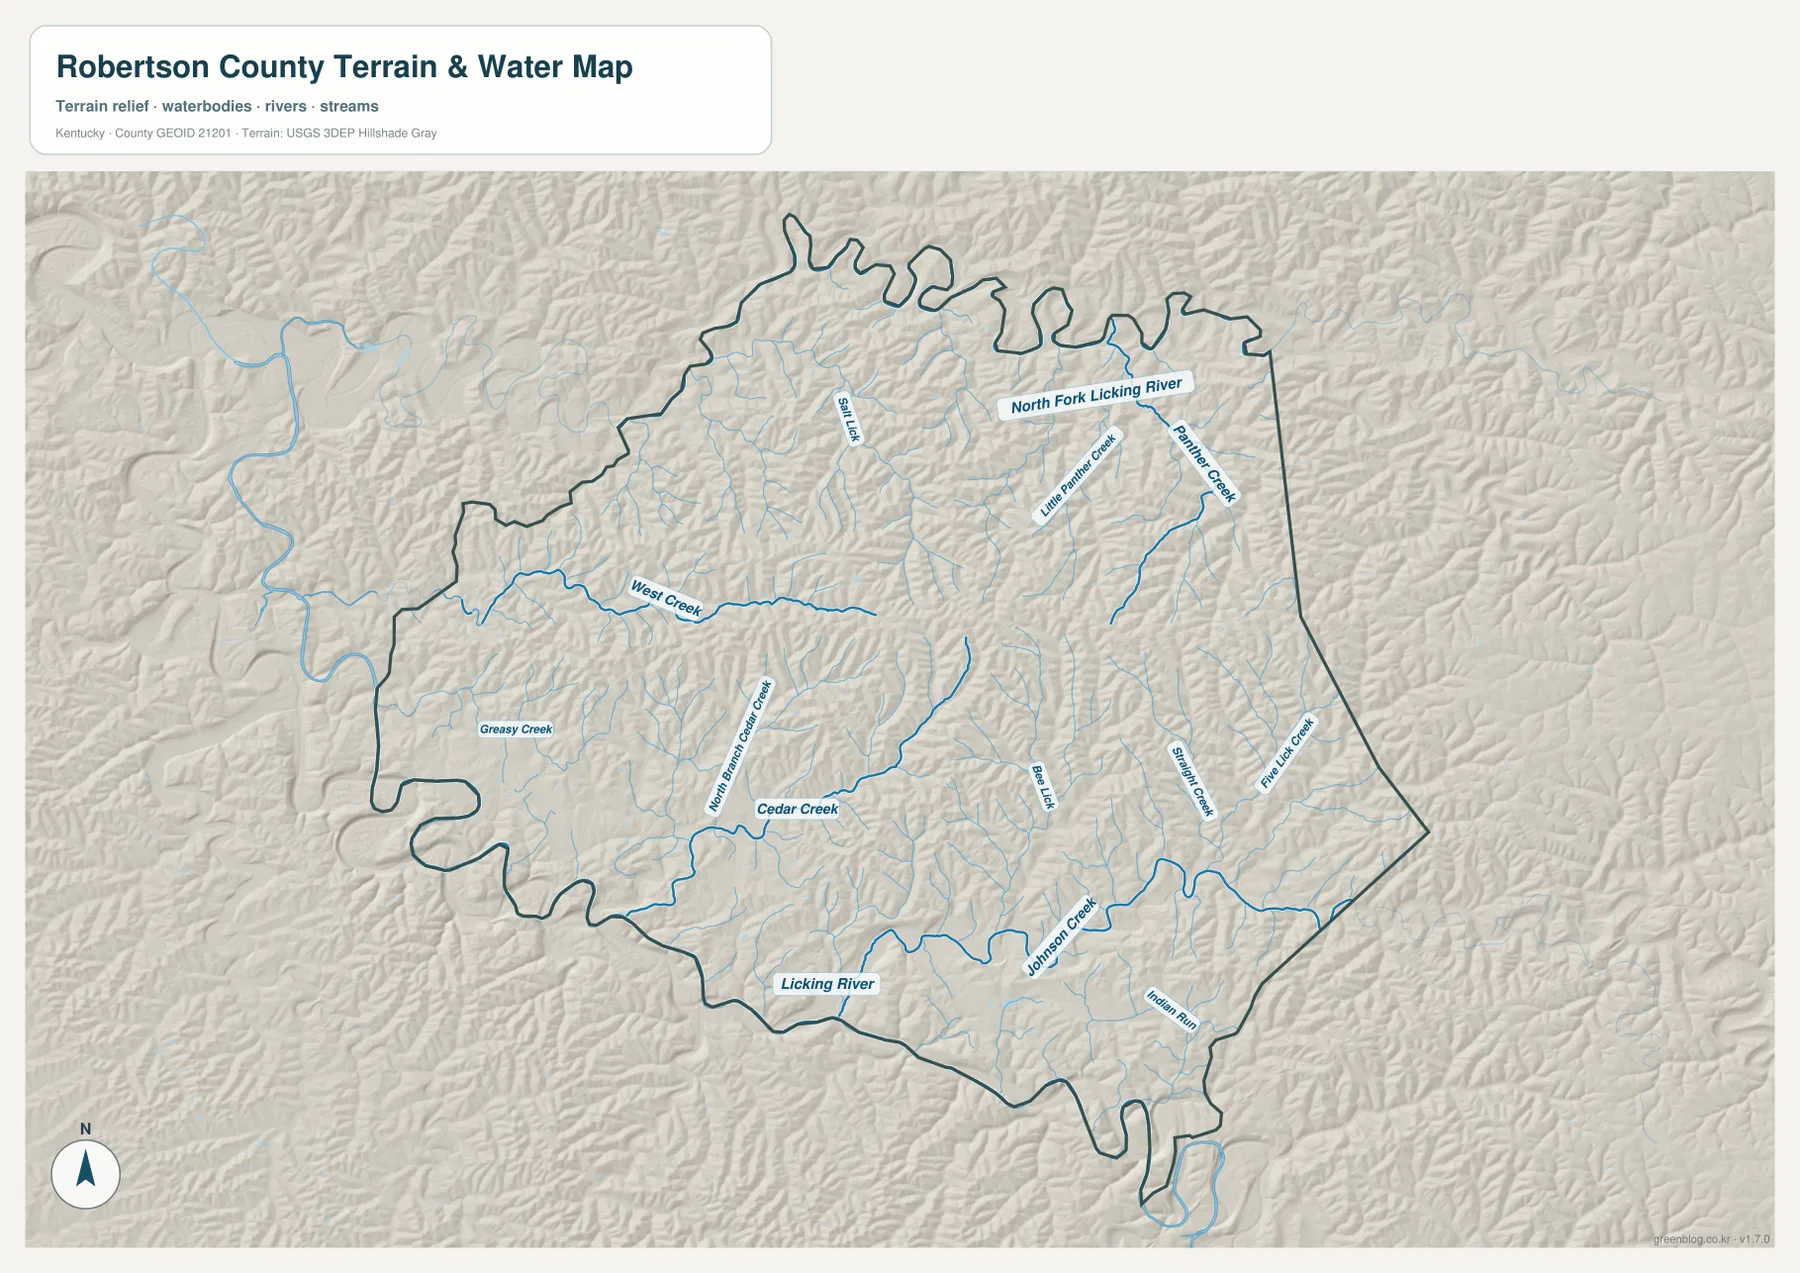
The terrain and water map reveals the county’s most distinctive physical pattern: a dense network of short valleys separated by narrow ridges. The Licking River is labeled along the southern side, while the North Fork Licking River appears in the northern part of the county. Between them, named streams include West Creek, Cedar Creek, Johnson Creek, Panther Creek, Little Panther Creek, Greasy Creek, and several smaller branches. The shaded relief makes it easy to see that these blue lines occupy lower corridors rather than crossing a flat surface.
West Creek extends across much of the western half, while Cedar Creek occupies a lower valley in the south-central area. Johnson Creek reaches the southern side near the Licking River, and the northeastern portion contains the North Fork Licking River together with Panther Creek and Little Panther Creek. The map does not need flow arrows to show the broader relationship: stream corridors thread between ridges, and the ridge pattern helps explain why roads frequently curve as they move through the county.
This layer is a geographic reference, not a flood-risk, parcel, legal-water-boundary, or navigation map. Small channels can also be generalized at the map scale, so the absence or placement of a thin tributary should not be used for site-level decisions. For ordinary map reading, however, the layer is especially informative because it connects familiar names such as the Licking River with the smaller creek valleys that shape the interior of Robertson County. It also provides a natural bridge between the road map and the elevation map: the same valleys visible in blue appear as lower ground on the elevation surface.
Ridges stand out within a 167–307 meter elevation range
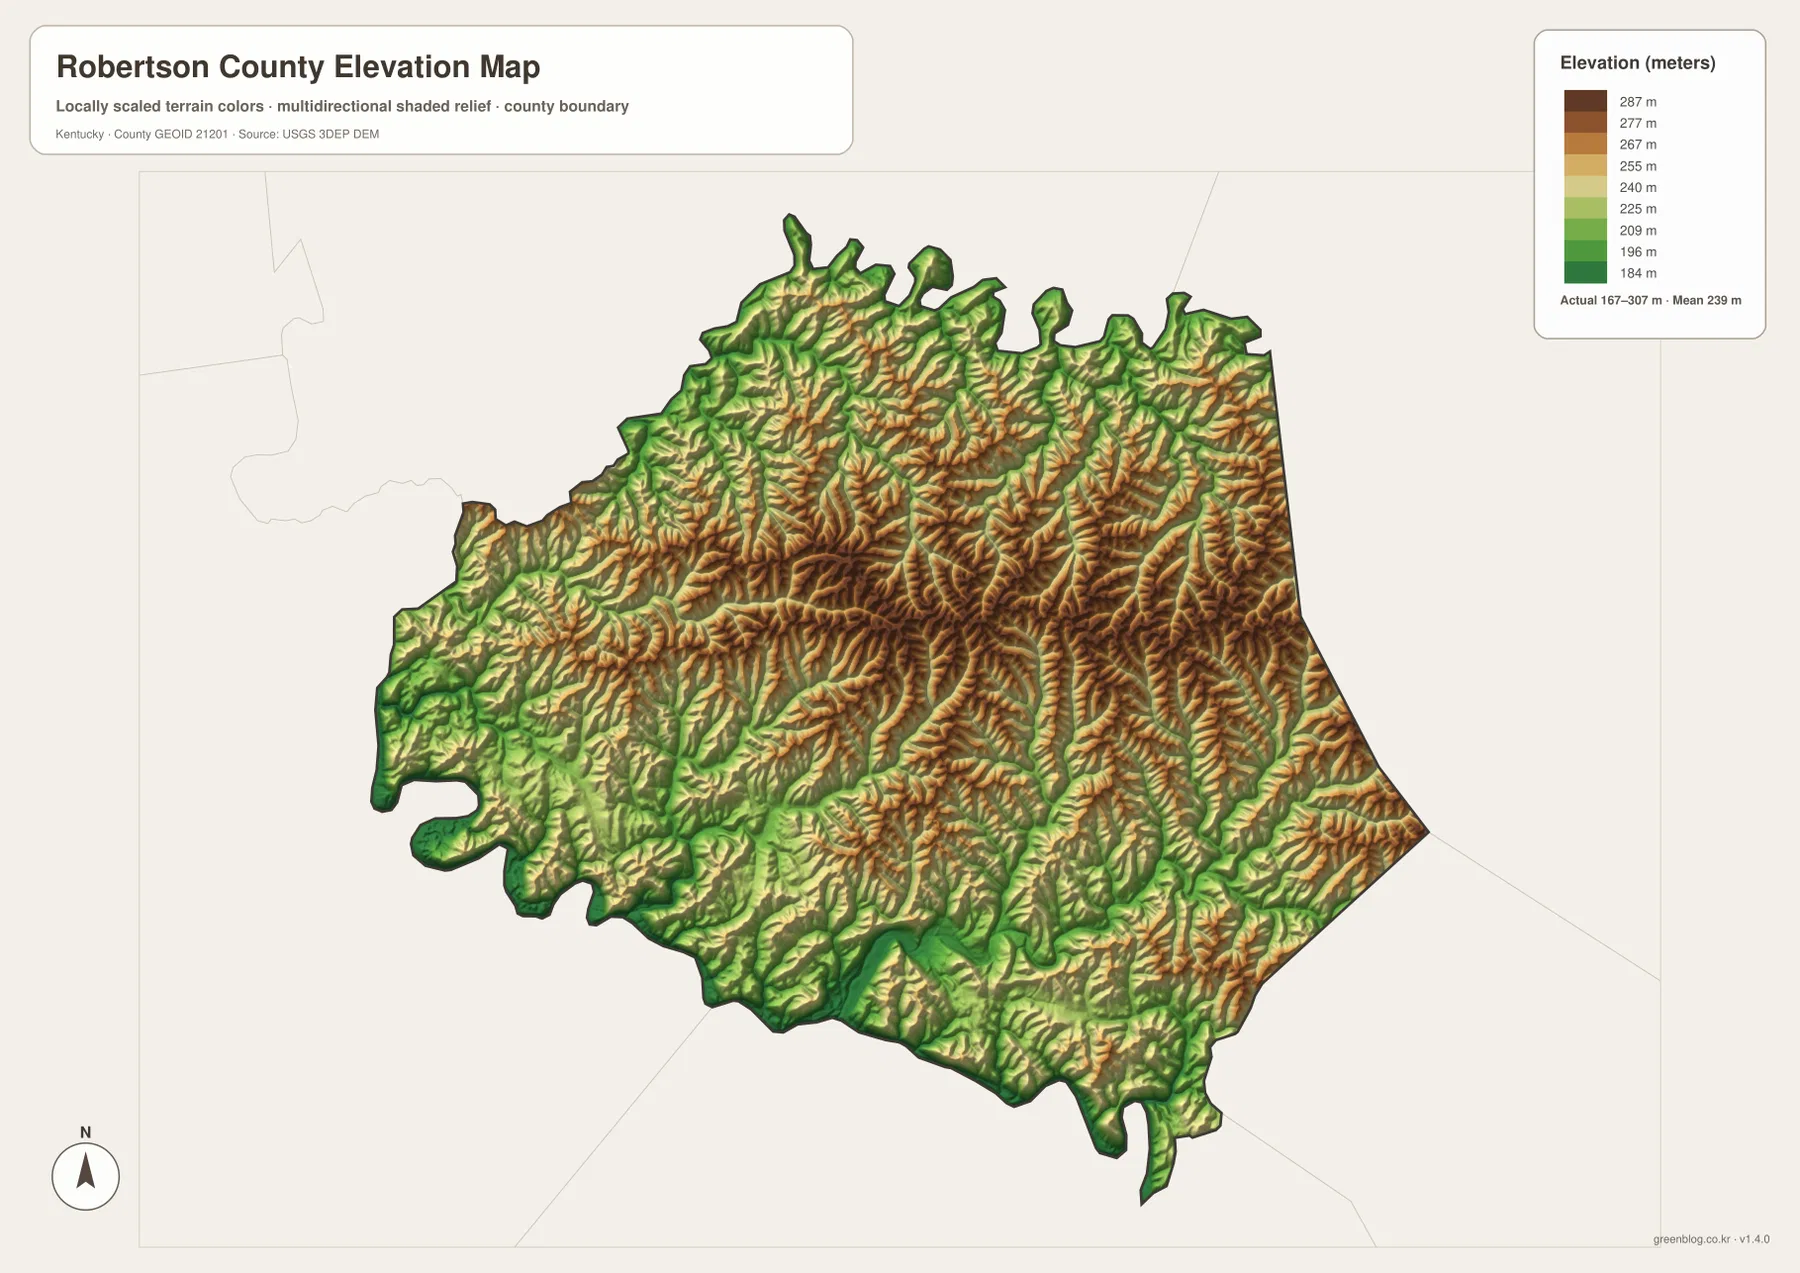
The elevation map reports an actual mapped range of roughly 167 to 307 meters and a mean elevation of about 239 meters. Those numbers are modest compared with mountainous parts of eastern Kentucky, yet the map still looks strongly dissected because the county contains many closely spaced ridges and creek valleys. Browns and tans mark higher ground, while greens are more common in lower valleys and along some outer margins. The central and eastern portions show many narrow elevated ridges, and lower colors appear repeatedly where drainage lines cut through them.
Comparing the elevation surface with the water map makes the pattern easier to understand. Licking River and the named creeks occupy lower corridors, while elongated ridges fill the spaces between them. This is a more useful way to describe Robertson County than treating elevation as a single countywide number. Two places can be relatively close on the road map yet sit on opposite sides of a ridge or in different creek valleys, which helps explain the winding character of many local roads.
The elevation surface is generalized for county-scale viewing. It should not be treated as survey-grade information for a building site, grading plan, engineering design, or exact slope measurement. For regional interpretation, it works well: readers can identify where terrain is generally higher, where valleys are lower, and how relief changes across the county. The legend is also useful when preparing a presentation because it provides a clear minimum, maximum, and mean value without requiring the reader to infer elevations from hillshade alone.
Choosing the most useful Robertson County file
Each file answers a different practical question, so the best choice depends on what the map needs to communicate. The boundary and road map is the strongest all-purpose reference because it combines Mount Olivet, numbered highways, nearby communities, streams, and the county outline. The city map removes much of that detail and is better when Mount Olivet and neighboring counties are the main focus. The terrain and water map is the best choice for rivers, creeks, and valley structure, while the elevation map makes ridge height and lower drainage corridors visually obvious.
- Use the county map when you need Mount Olivet, U.S. 62, KY 165, other numbered routes, community labels, and the full county boundary in one view.
- Use the city map for a cleaner locator showing Mount Olivet as the single indexed major city and Robertson County’s position among neighboring counties.
- Use the terrain and water map when the Licking River, North Fork Licking River, West Creek, Cedar Creek, Johnson Creek, and related valleys are the main subject.
- Use the elevation map when you want to compare higher ridges with lower creek corridors across the county without the extra road labels.
The downloadable JPGs are larger than the web previews at 3638 × 2572 pixels each, which makes small route numbers and stream labels easier to read in print. A useful presentation sequence is to begin with the general county map, use the city map only when a simple locator is needed, and then add either the water or elevation layer to explain the landscape. The maps can also be printed separately when a less crowded page is more important than showing every category of information at once.
Frequently Asked Questions
Which map is best for following roads through Mount Olivet?
Start with the general county map. It shows Mount Olivet at the junction area of U.S. 62 and KY 165 and also includes routes such as KY 539, KY 875, KY 616, KY 617, KY 19, and KY 68 where they appear in the county. The city map is cleaner but does not provide the same level of road detail, so it is better for simple orientation than for tracing numbered routes.
Which file shows the Licking River and the smaller creek valleys most clearly?
Use the terrain and water map. It labels the Licking River and North Fork Licking River along with streams such as West Creek, Cedar Creek, Johnson Creek, Panther Creek, Little Panther Creek, and Greasy Creek. Shaded relief behind the waterways makes the creek valleys easier to distinguish from the ridges between them. It is a reference map rather than a flood or navigation map.
Can the elevation map be used for engineering or property-level measurements?
No. The map is designed for county-scale geographic comparison, not survey or engineering work. It shows a generalized elevation range of about 167 to 307 meters with a mean near 239 meters, which is useful for understanding the county’s ridges and valleys. Exact site elevations, grades, or construction decisions require higher-resolution source data and professional measurement.
Sources and reference information
The article uses the supplied Robertson County map assets for visual observations and cross-checks county background with public information from local, state, and federal sources.
- Robertson County official website — County location, formation history, area, and Mount Olivet county-seat information.
- Robertson County Tourism — Local reference information including Mount Olivet and the U.S. 62 / KY 165 junction.
- U.S. Census Bureau TIGER/Line Shapefiles — Official geographic boundary and transportation data resources.
- USGS National Hydrography — Official hydrography information for rivers, streams, and water features.
- USGS 3D Elevation Program — Official U.S. elevation data and terrain-model information.
Map File Information
The ZIP contains the original high-resolution JPG versions of the Robertson County boundary and road map, city map, terrain and water map, and elevation map. Review the maps on the page first, then choose the file that best fits printing, teaching, local orientation, or general reference.
- File Type: ZIP containing 4 JPG files
Related Maps
Green Map creates custom-edited map images using open geographic data sources such as geoBoundaries, Natural Earth, OpenStreetMap, and government open data. These maps are edited visual materials, not raw data files, and are provided for education, documents, presentations, and graphic reference.