Female unemployment rates differed sharply across reporting economies in 2024. This indicator is not the share of all women who are unemployed. It measures unemployed women as a percentage of the female labor force: women who are in the labor market, are available for work and are seeking work, but do not have a job. That distinction matters because women outside the labor force are not counted in the denominator.
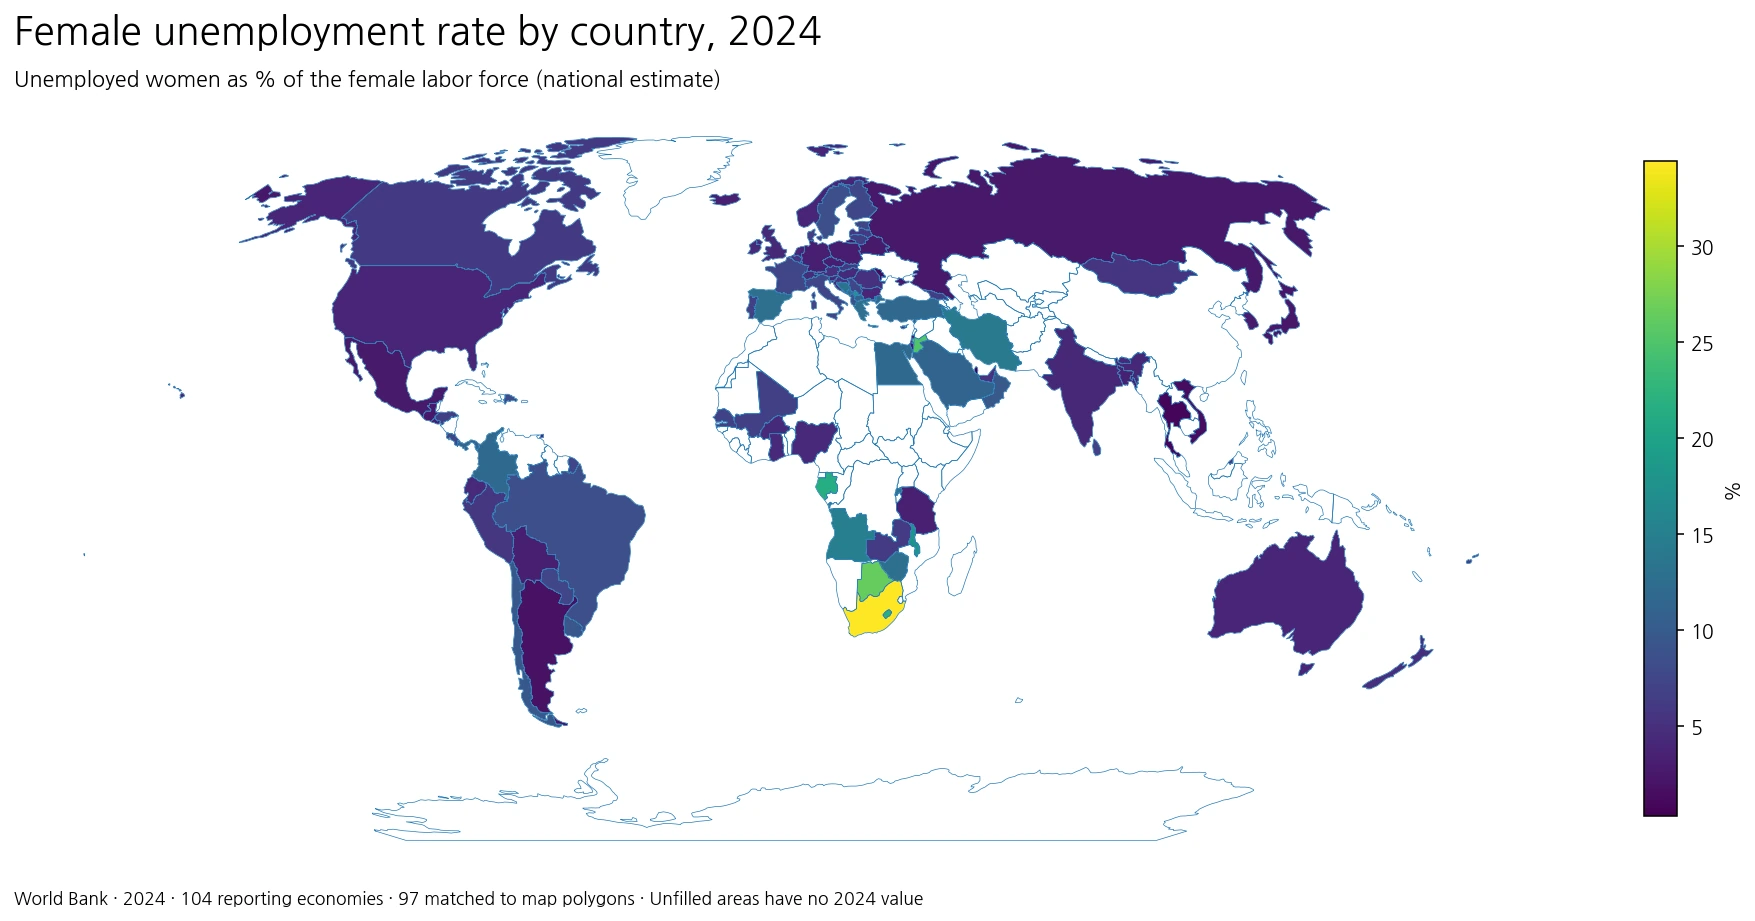
Table of Contents
The 2024 snapshot covers 104 reporting economies
The comparison uses the World Bank indicator SL.UEM.TOTL.FE.NE.ZS for 2024. The country-and-economy master contains 217 entries; 104 have a 2024 observation and 113 are missing for this year. Missing observations are preserved as missing rather than replaced with zero. An unfilled country on the map therefore means that the 2024 national-estimate value is unavailable in this dataset, not that female unemployment was zero.
Across the 104 reported values, the simple median is 5.77% and the mean is 7.54%. The first quartile is 3.83% and the third quartile is 9.17%, so half of the observations lie roughly between those two values. The mean sits above the median because a smaller group of high-unemployment economies pulls the average upward. Twenty-three observations are at least 10%, eight are at least 15%, six exceed 20%, and two exceed 30%.
South Africa and the West Bank and Gaza recorded the highest values
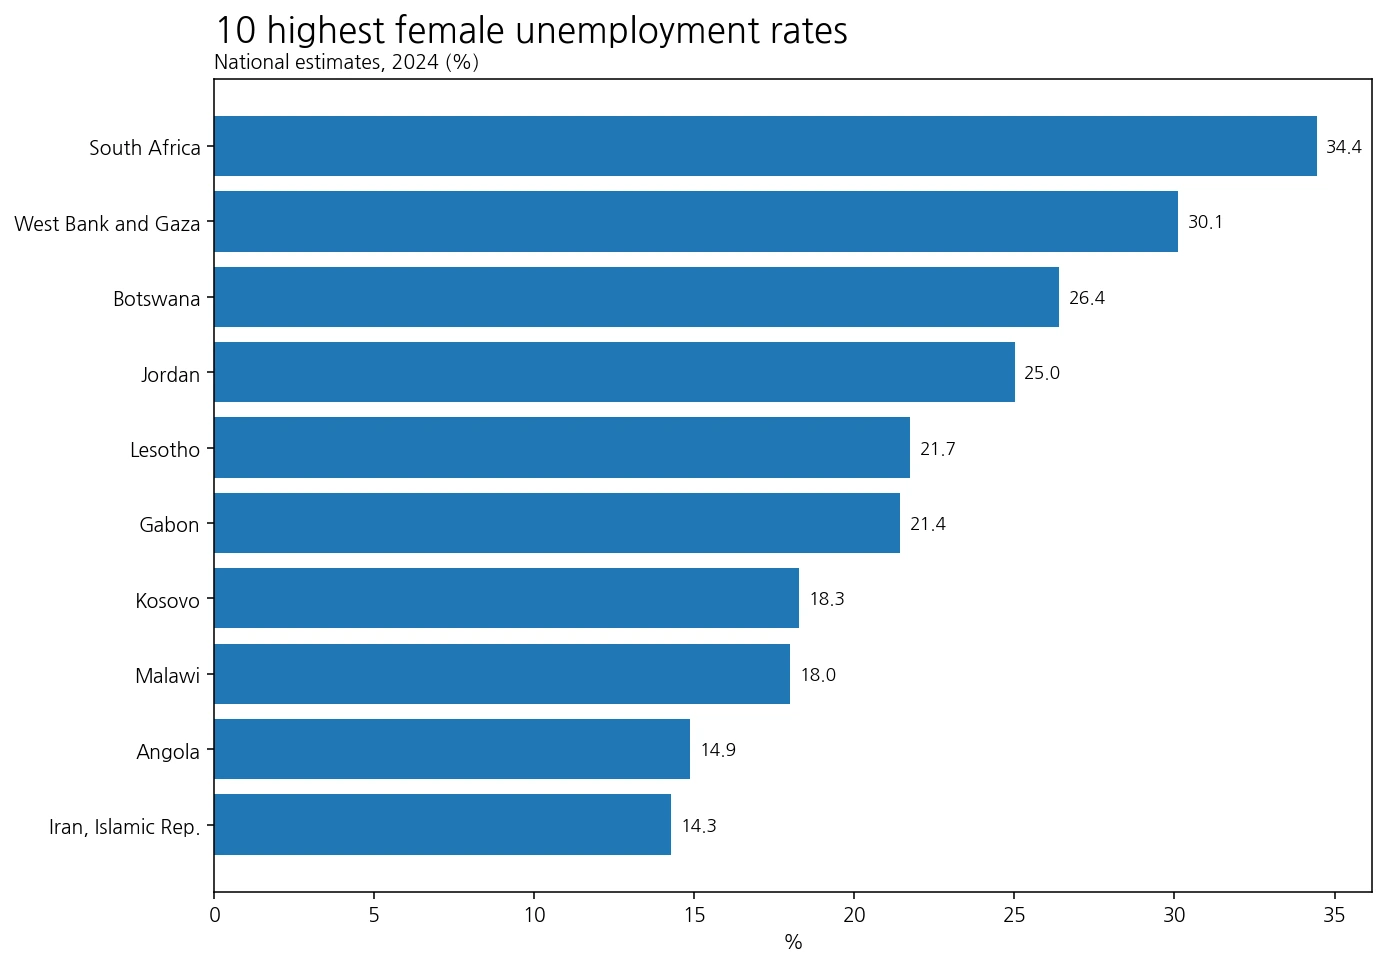
South Africa has the highest reported 2024 value at 34.448%, followed by the West Bank and Gaza at 30.112%. Botswana is at 26.399% and Jordan at 25.010%. Lesotho and Gabon also exceed 20%, at 21.739% and 21.435% respectively. Kosovo is 18.254% and Malawi is 18.000%. These figures describe the economies with a reported 2024 national estimate; they should not be treated as a complete ranking of every country in the world because many economies have no value for this particular year.
| Economy | Female unemployment rate, 2024 |
|---|---|
| South Africa | 34.4% |
| West Bank and Gaza | 30.1% |
| Botswana | 26.4% |
| Jordan | 25.0% |
| Lesotho | 21.7% |
| Gabon | 21.4% |
| Kosovo | 18.3% |
| Malawi | 18.0% |
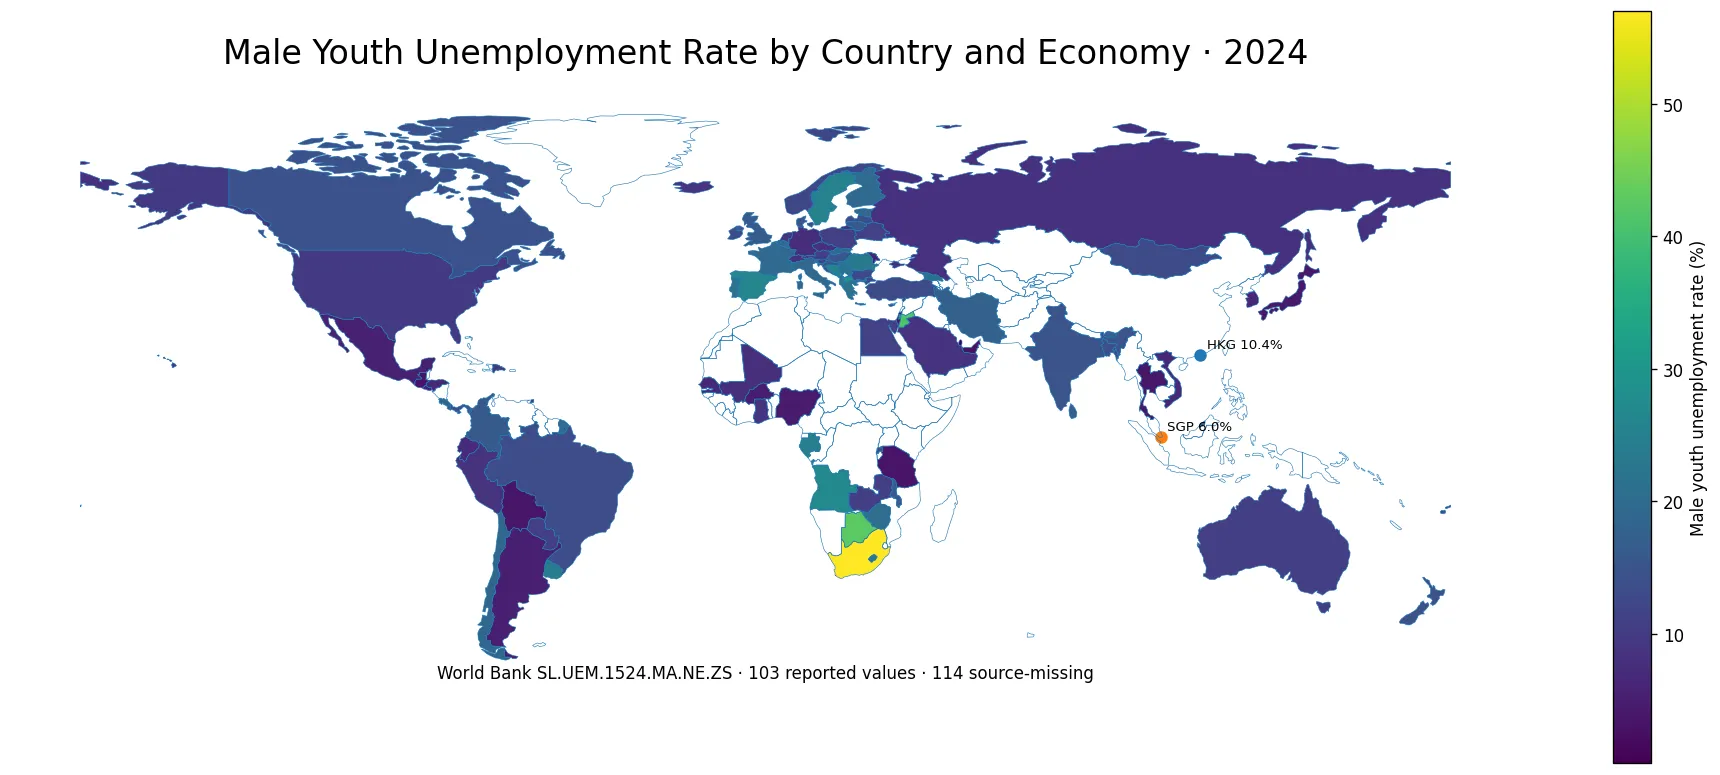
The map adds a spatial dimension that a ranking alone cannot show. Several high values appear close together in southern Africa: South Africa, Botswana and Lesotho are all above 20%, while Malawi and Zimbabwe are also relatively high. In the Middle East, the West Bank and Gaza and Jordan stand out above 25%, while Iran is above 14%. In southern Europe, Spain and Greece are both around 12.7%, and Bosnia and Herzegovina is above 13%. These clusters identify places where further labor-market analysis may be useful, but spatial proximity by itself does not establish a common cause.
Very low rates require just as much care in interpretation
At the low end, Qatar reports 0.318%, Thailand 0.826%, Moldova 1.229%, Viet Nam 1.424% and Argentina 1.849%. Hong Kong SAR, China is at 2.366%, Japan at 2.400% and the Russian Federation at 2.522%. A low unemployment rate can be consistent with a tight labor market, but the indicator alone cannot show how many women participate in the labor force, how many are employed, or what the quality and stability of those jobs are.
| Economy | Female unemployment rate, 2024 |
|---|---|
| Qatar | 0.3% |
| Thailand | 0.8% |
| Moldova | 1.2% |
| Viet Nam | 1.4% |
| Argentina | 1.8% |
| Hong Kong SAR, China | 2.4% |
| Japan | 2.4% |
| Russian Federation | 2.5% |
This matters because people who are not working and are not actively seeking work are generally outside the labor force rather than unemployed. An economy can therefore have a low measured unemployment rate while also having a low female labor-force participation rate. Conversely, if more women enter the labor market and begin searching for work, unemployment can rise temporarily even if employment opportunities are also expanding. Female unemployment is best read together with participation, employment-to-population, youth unemployment, hours and job-quality indicators.
The map highlights where differences occur, not why they occur
A country map is useful because it reveals neighboring contrasts and regional groupings. In this 2024 snapshot, multiple southern African reporting economies fall in high ranges, while several reported economies in East and Southeast Asia fall in low ranges. Much of Europe is in low-to-middle ranges, but parts of the Balkans and southern Europe have double-digit rates. The Middle East shows wide variation, with two of the highest reported values in the West Bank and Gaza and Jordan. These are descriptive patterns. The dataset does not by itself identify the economic, institutional or social mechanisms behind them.
The map also has cartographic limits. Small islands and territories can be difficult to see or may not appear as separate polygons in a low-resolution world boundary layer. The statistical comparison still uses all 104 reported observations, while 97 of those observations could be joined directly to the polygons used for the world map. For an exact value, the table or source data should take precedence over the visual appearance of a small geographic feature.
Why the phrase “national estimate” matters
The World Bank labels this series as a national estimate and identifies the ILOSTAT Labour Force Statistics database as the underlying source. National estimates rely on statistics reported through national systems, which can differ in survey design, age coverage, treatment of job search, reference periods and revision schedules. Those differences do not make the data unusable, but they mean that small decimal-point differences between countries should not be interpreted as precise performance rankings.
The national-estimate series is also distinct from the modeled ILO estimate series. Modeled estimates apply a separate methodology intended to improve comparability and fill gaps, whereas the national-estimate series reflects reported national observations. Mixing the two series in one ranking can create an apparent comparison between values produced through different methods. This article keeps the metric fixed to the national-estimate series and the comparison year fixed to 2024.
What female unemployment can and cannot tell us
Female unemployment is a useful measure of difficulty finding work among women who are already in the labor force. A high rate can signal that a large share of active job seekers are unable to secure employment. It does not measure wages, hours, informality, job security, occupational segregation, underemployment or unpaid care work. It also does not directly measure the share of all working-age women who have jobs.
For that reason, the rate should be treated as one component of a broader labor-market picture rather than a complete scorecard. Participation changes can alter the denominator. A recovery can initially bring more job seekers back into the labor market, increasing unemployment before enough jobs are created. The opposite can also happen: discouraged workers can stop searching and leave the labor force, lowering the unemployment rate without a comparable improvement in employment. Context is essential.
A practical way to read the 2024 distribution
- Use the 5.77% median as a reference point for where an economy sits within the reported distribution.
- Treat the six observations above 20% as clear high-end outliers that deserve separate attention.
- Read unfilled areas as missing 2024 observations, never as zero unemployment.
- Compare national estimates with national estimates rather than mixing them with modeled estimates.
- Pair unemployment with female participation and employment measures before drawing broader conclusions about labor-market conditions.
These checks turn the map from a simple ranking graphic into a more reliable comparison tool. High values identify economies where job-search difficulties among women in the labor force are especially visible in the 2024 national estimates. Low values identify a different set of economies where participation and employment indicators become especially important for interpretation. Missing areas remain an explicit data limitation rather than being silently converted into a value.
Source and calculation
The figures use the World Bank female unemployment, national estimate indicator, code SL.UEM.TOTL.FE.NE.ZS, for 2024. The World Bank identifies ILOSTAT Labour Force Statistics as the source for the series. Aggregate groups were excluded from the country-and-economy comparison. The analysis uses the 104 non-missing observations directly; the mean, median, quartiles, thresholds and rankings were calculated from those values, while the 113 missing entries were left missing.
A one-year map is a cross-section rather than a trend analysis. It cannot show whether a country has been improving or worsening, whether a value is temporary, or whether a statistical break occurred. Answering those questions requires a multi-year series and country-specific metadata. The purpose here is narrower: to compare the reported national estimates for the same reference year and make the coverage limits visible.
Frequently Asked Questions
Is the female unemployment rate the share of all women who are unemployed?
No. It is the share of the female labor force that is unemployed. Women who are not participating in the labor force are not part of the denominator.
Do unfilled countries on the map have a 0% unemployment rate?
No. Unfilled areas indicate that a 2024 national-estimate value is missing in this comparison. Missing observations were not replaced with zero.
Is a national estimate the same as the modeled ILO estimate?
No. They are separate series. National estimates reflect reported national statistics, while modeled ILO estimates use a separate modeling framework intended to improve comparability and fill gaps.
Related Articles
Green Map creates custom-edited map images using open geographic data sources such as geoBoundaries, Natural Earth, OpenStreetMap, and government open data. These maps are edited visual materials, not raw data files, and are provided for education, documents, presentations, and graphic reference.