HepB3 immunization coverage varied widely across the 188 countries and economies with a reported 2024 value. The median was 91%, 60 observations reached at least 95%, and 45 were below 80%. Sudan had the lowest reported value at 39%, while Central African Republic, Papua New Guinea, and Yemen each reported 42%. This article compares the same-year observations from World Bank indicator SH.IMM.HEPB. Twenty-nine entries without a 2024 value remain missing rather than being treated as zero, and the differences are interpreted as vaccination-coverage outcomes rather than as an overall ranking of national health systems.
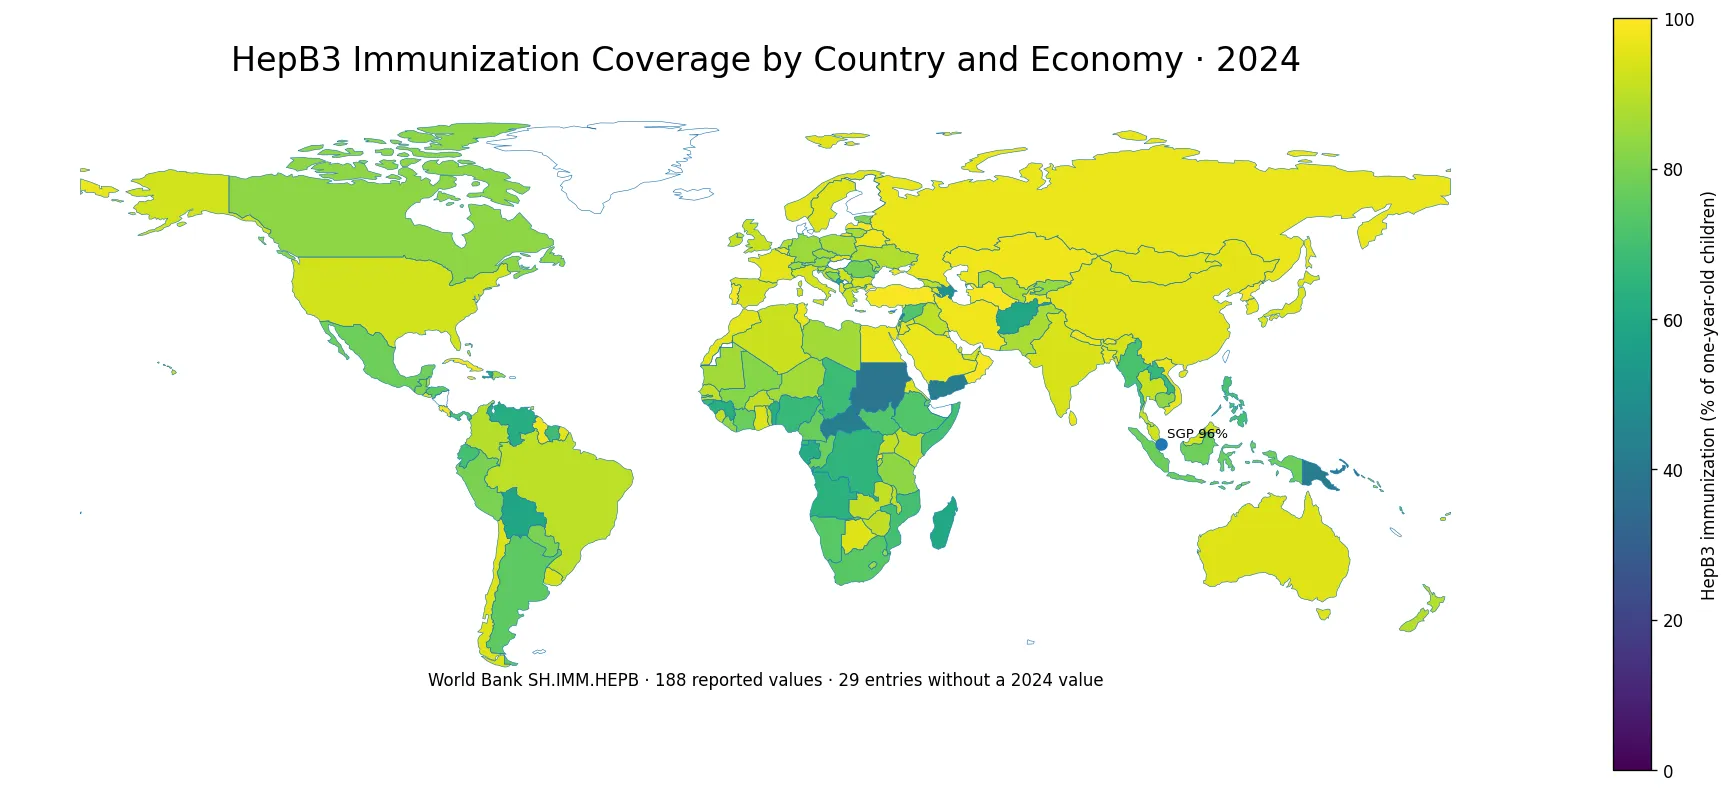
Table of Contents
What the HepB3 indicator measures
World Bank indicator SH.IMM.HEPB reports the percentage of children around one year of age who have received three doses of hepatitis B vaccine. The indicator description refers to children ages 12–23 months and treats a child as adequately immunized after the three-dose series has been received before age 12 months or by the time of the survey. It is therefore a coverage measure for a specific childhood vaccine schedule. It is not a measure of adult hepatitis B immunity, infection prevalence, vaccine effectiveness, or the overall performance of every part of a health system. For 2024, 188 countries and separately reported economies had a value, while 29 entries had no reported value for the year. Those missing observations remain missing rather than being converted to zero.
The middle of the 2024 distribution was above 90 percent
Across the 188 reported observations, the median HepB3 immunization rate was 91 percent and the mean was 86.05 percent. The first quartile was 80 percent and the third quartile was 96 percent, placing the middle half of reported economies within a relatively broad 16-point band. A total of 102 observations were at least 90 percent, including 60 at or above 95 percent. Eighteen entries reported 99 percent. At the other end, 45 were below 80 percent and 23 were below 70 percent. The mean being lower than the median is consistent with a lower tail created by a smaller group of countries with substantially weaker reported coverage. That lower tail is important because a global median alone can hide the depth of the gaps.
The lowest reported values reveal the largest gaps
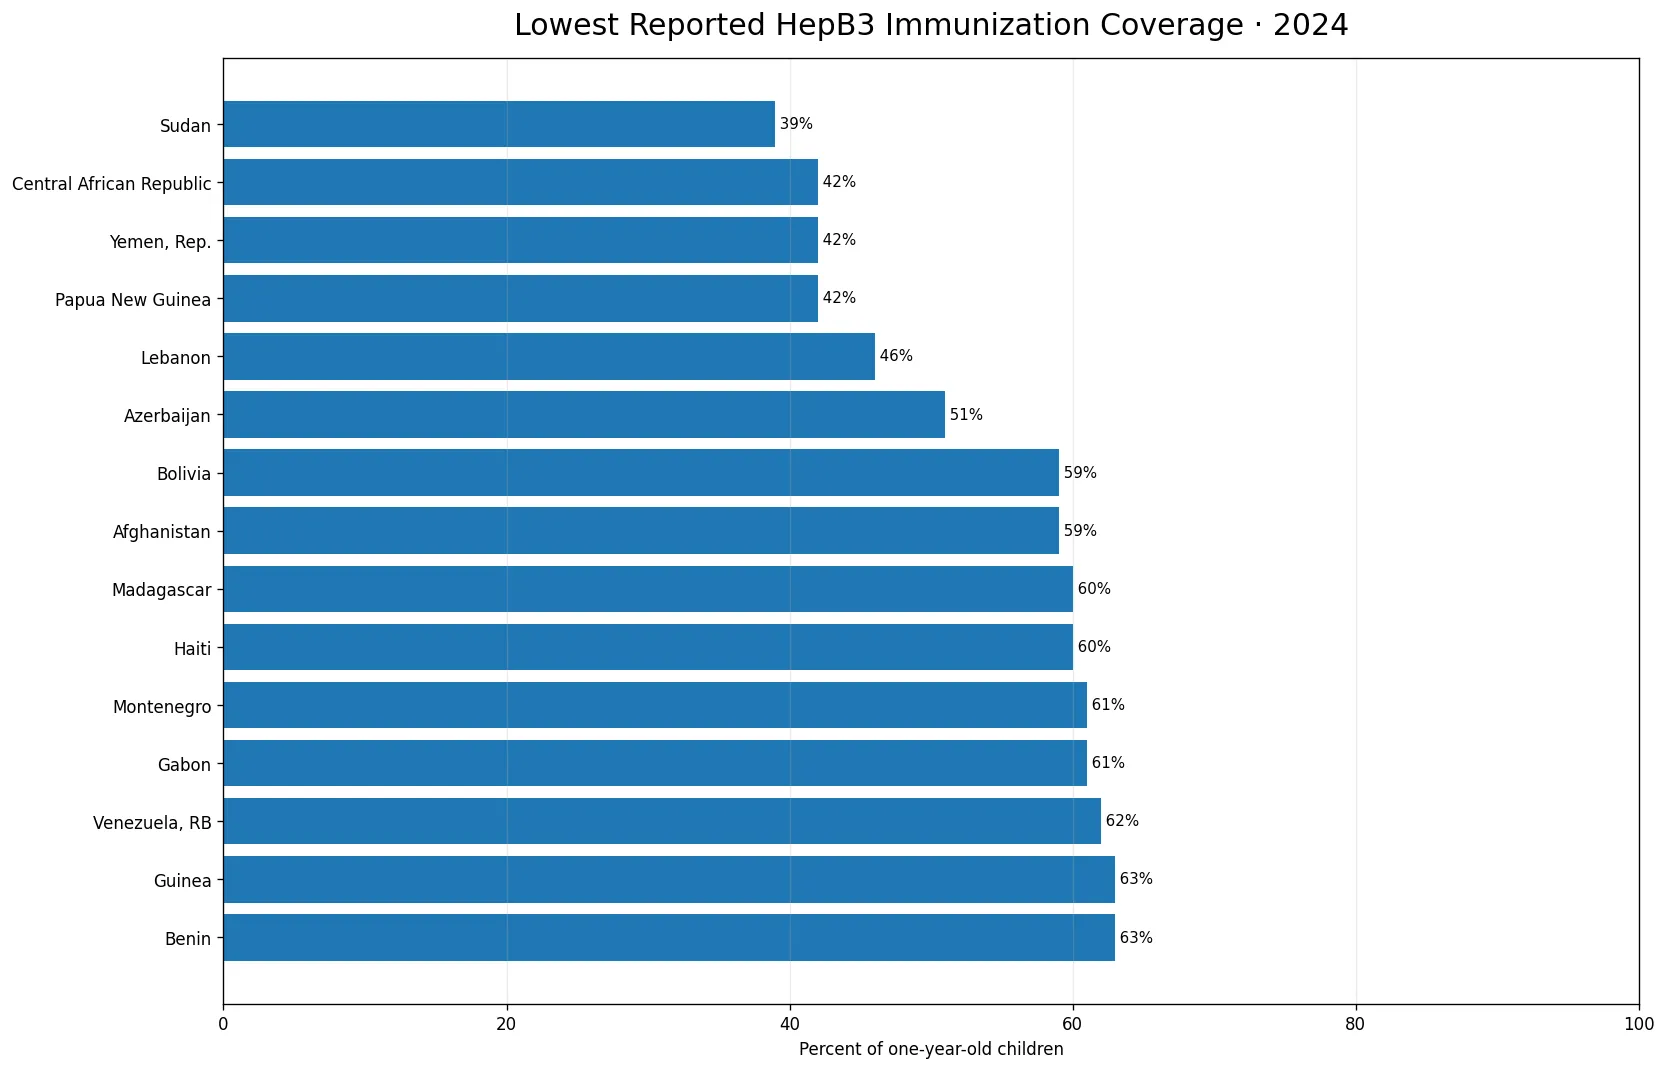
Sudan had the lowest 2024 observation at 39 percent. Central African Republic, Papua New Guinea, and Yemen each reported 42 percent, followed by Lebanon at 46 percent. Azerbaijan was at 51 percent, Afghanistan and Bolivia at 59 percent, and Haiti and Madagascar at 60 percent. The distance between the highest reported level of 99 percent and Sudan’s 39 percent is 60 percentage points. That gap is large enough to make the lower end of the distribution visually distinct on the map. The indicator itself, however, does not identify why a country has a low value. Supply constraints, service access, conflict, mobility, administrative reporting, population estimates, and survey conditions can all matter, but those explanations require additional evidence beyond this series.
The map shows high coverage alongside persistent low-coverage pockets
Placing the 2024 values on a world map makes two features visible at the same time. High coverage is widespread: 60 countries and economies reached at least 95 percent, and 102 reached 90 percent or more. Yet 45 reported less than 80 percent, so lower coverage is not confined to a handful of isolated cases. The most extreme low values are uncommon—only five observations were below 50 percent—but they create a marked contrast with the large group clustered in the 90s. Small islands and separately reported territories may be hard to see on a low-resolution global boundary layer, so the map should be read together with the numeric distribution rather than as a complete visual inventory of every reporting economy.
A 99 percent value is a high-coverage signal, not a fine ranking
Eighteen countries and economies reported 99 percent in 2024, including Antigua and Barbuda, Brunei Darussalam, Costa Rica, Cuba, Jamaica, Kuwait, Latvia, Maldives, Oman, Portugal, Tonga, and Türkiye. When many observations are tied at the upper boundary, treating them as a strict league table adds little information. The more useful interpretation is that they belong to a very high-coverage group. Small differences near the top can also reflect administrative practices, denominator estimation, rounding, and differences in how national systems compile vaccination records. For that reason, the analysis focuses on broad coverage bands and on the contrast between the upper cluster and the lower tail rather than claiming that one 99-percent economy has a meaningfully better program than another.
The 45 observations below 80 percent form a substantial lower group
Nearly one quarter of the 188 reporting countries and economies had a HepB3 rate below 80 percent. Narrowing the threshold to below 70 percent still leaves 23 observations. These counts help put the global median in perspective. A median of 91 percent describes the center of the distribution, but it does not mean that almost every country is close to 91 percent. The lower tail remains broad enough to matter. Grouping values into practical bands—95 percent or higher, 90–94 percent, 80–89 percent, and below 80 percent—also avoids overinterpreting one-point differences that may not be substantively meaningful. The map is most informative when those broad bands are combined with the exact reported values for the lowest-coverage countries.
Twenty-nine missing observations must remain separate from zero
The dataset contains 29 country or economy entries without a 2024 value. A missing observation is not evidence of zero vaccination. Replacing missing values with zero would incorrectly mix non-reporting with genuinely low coverage and would pull the global mean downward. All summary statistics in this article therefore use only the 188 observations with reported values. The World Bank country list can include separately reported territories and economies in addition to sovereign states, so the count of 188 should also be understood as reporting country-and-economy entries rather than a count of sovereign countries. Keeping both the missing-value rule and the geographic scope explicit is essential for reading the map correctly.
A single year cannot summarize the whole immunization system
HepB3 coverage is a useful measure of routine immunization reach, but one year should not be treated as a complete score for a national health system. Vaccination schedules, the balance between administrative data and household surveys, population denominators, delayed reporting, and the completeness of health records can affect reported coverage. A national average also says little about subnational inequality. A country reporting 95 percent overall may still have districts or population groups with much lower access, while a country with a low national figure may be improving quickly from previous years. Trend data, subnational coverage, vaccine supply information, and other routine-immunization indicators are needed for a fuller assessment. This comparison is intentionally limited to the verified 2024 HepB3 observation.
HepB3 should not be confused with measles or other vaccine indicators
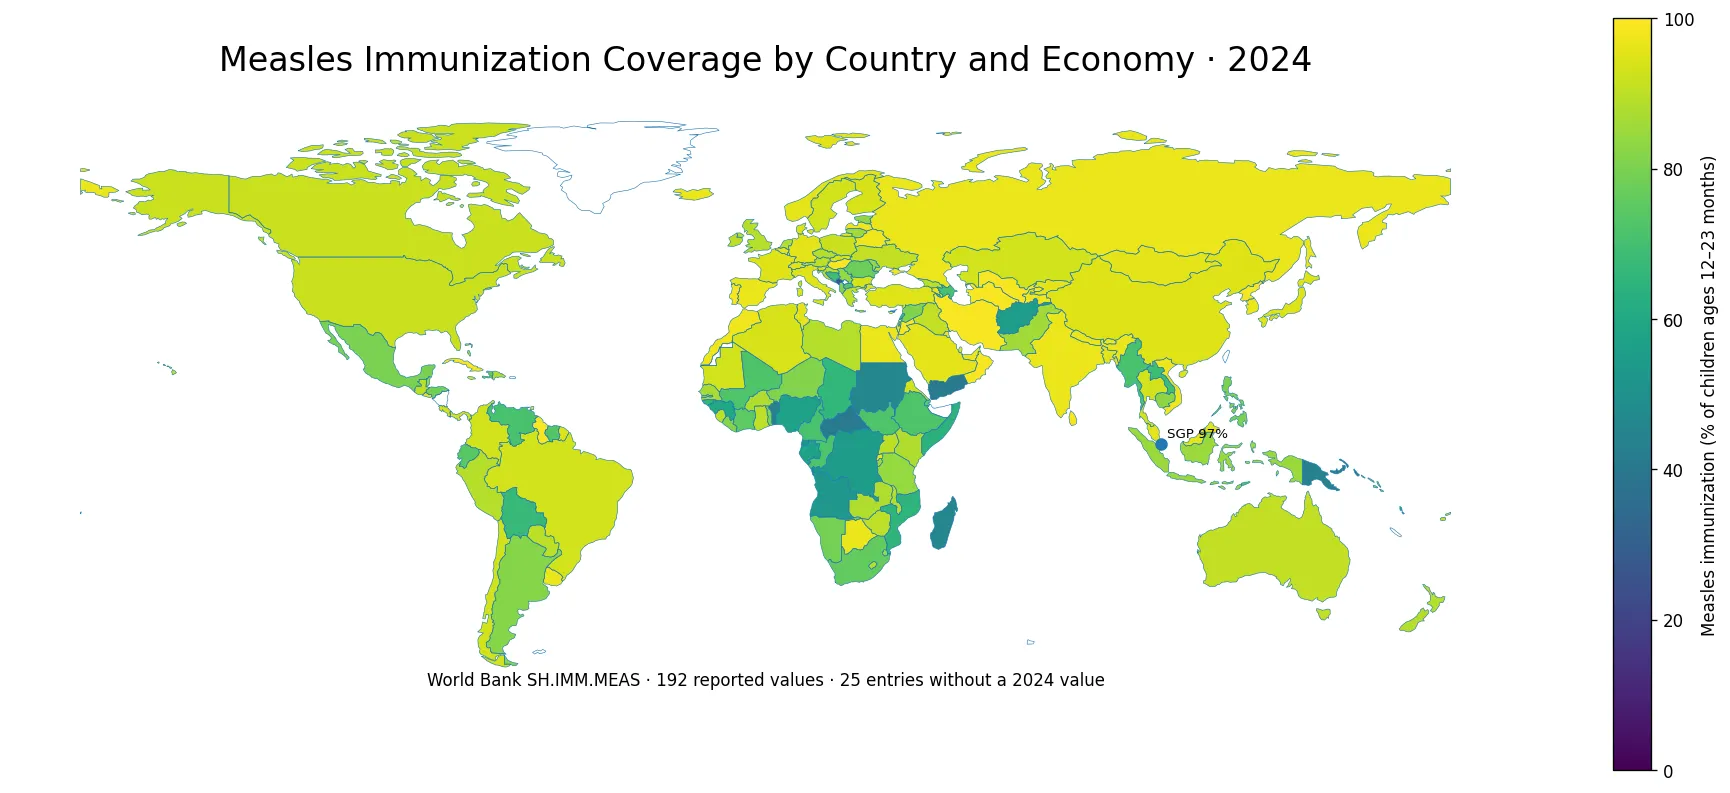
The HepB3 series concerns completion of the three-dose hepatitis B schedule. Measles immunization, DTP3, polio, and other childhood vaccination indicators have different antigens, schedules, and reporting definitions. Similar percentages do not make them interchangeable. Looking at several indicators side by side can reveal whether routine immunization coverage is broad across vaccines, but the figures should be compared rather than added. This article does not infer values for any other vaccine from HepB3, nor does it use another vaccine series to fill missing observations. That separation matters because a country can have different coverage levels for different vaccines depending on delivery timing and program design.
Three rules make country comparisons more reliable
First, remember that the indicator is a percentage, not a count of vaccinated children. Two countries with the same 90 percent rate can represent very different numbers of children. Second, preserve missing values: the 29 entries without 2024 observations should not be ranked with countries that reported low coverage. Third, interpret small differences near the top cautiously. A gap between 99 and 97 percent is much less informative than the difference between 95 and 60 percent. Using broad bands and the overall distribution reduces the temptation to turn a public-health coverage measure into an overly precise ranking. The map and the low-coverage chart are designed around that principle.
Frequently Asked Questions
What does the HepB3 immunization indicator measure?
It reports the percentage of children around one year of age who have received the three-dose hepatitis B vaccination series.
What was the median HepB3 coverage in 2024?
Among the 188 countries and economies with a reported 2024 value, the median was 91%, and 60 observations were at least 95%.
Were the 29 missing observations treated as zero?
No. Entries without an official 2024 value remain missing and are excluded from the mean, median, and rankings.
Related Articles
Green Map creates custom-edited map images using open geographic data sources such as geoBoundaries, Natural Earth, OpenStreetMap, and government open data. These maps are edited visual materials, not raw data files, and are provided for education, documents, presentations, and graphic reference.