Petroleum-fired net generation in the U.S. Electric Power Sector Non-CHP was highly concentrated by state in 2024. Hawaii recorded 5,498.463 thousand MWh, equal to 47.51% of the 50-state total of 11,573.780 thousand MWh. Michigan followed with 1,344.301 thousand MWh, Alaska with 866.329, and Florida with 809.375. The comparison uses annual U.S. Energy Information Administration observations with fueltypeid PET, sectorid 90, and the generation field fixed to 2024.
The measure is electricity output, not fuel consumption. Its unit is thousand megawatthours, so the values describe net electricity generation attributed to petroleum in the specified non-CHP electric power sector. EIA publishes several neighboring measures for the same broad topic, including physical fuel consumption, energy-input measures in Btu, total consumption, and average heat content. Those measures answer different questions and should not be substituted for the generation series simply because the fuel and geography look similar.
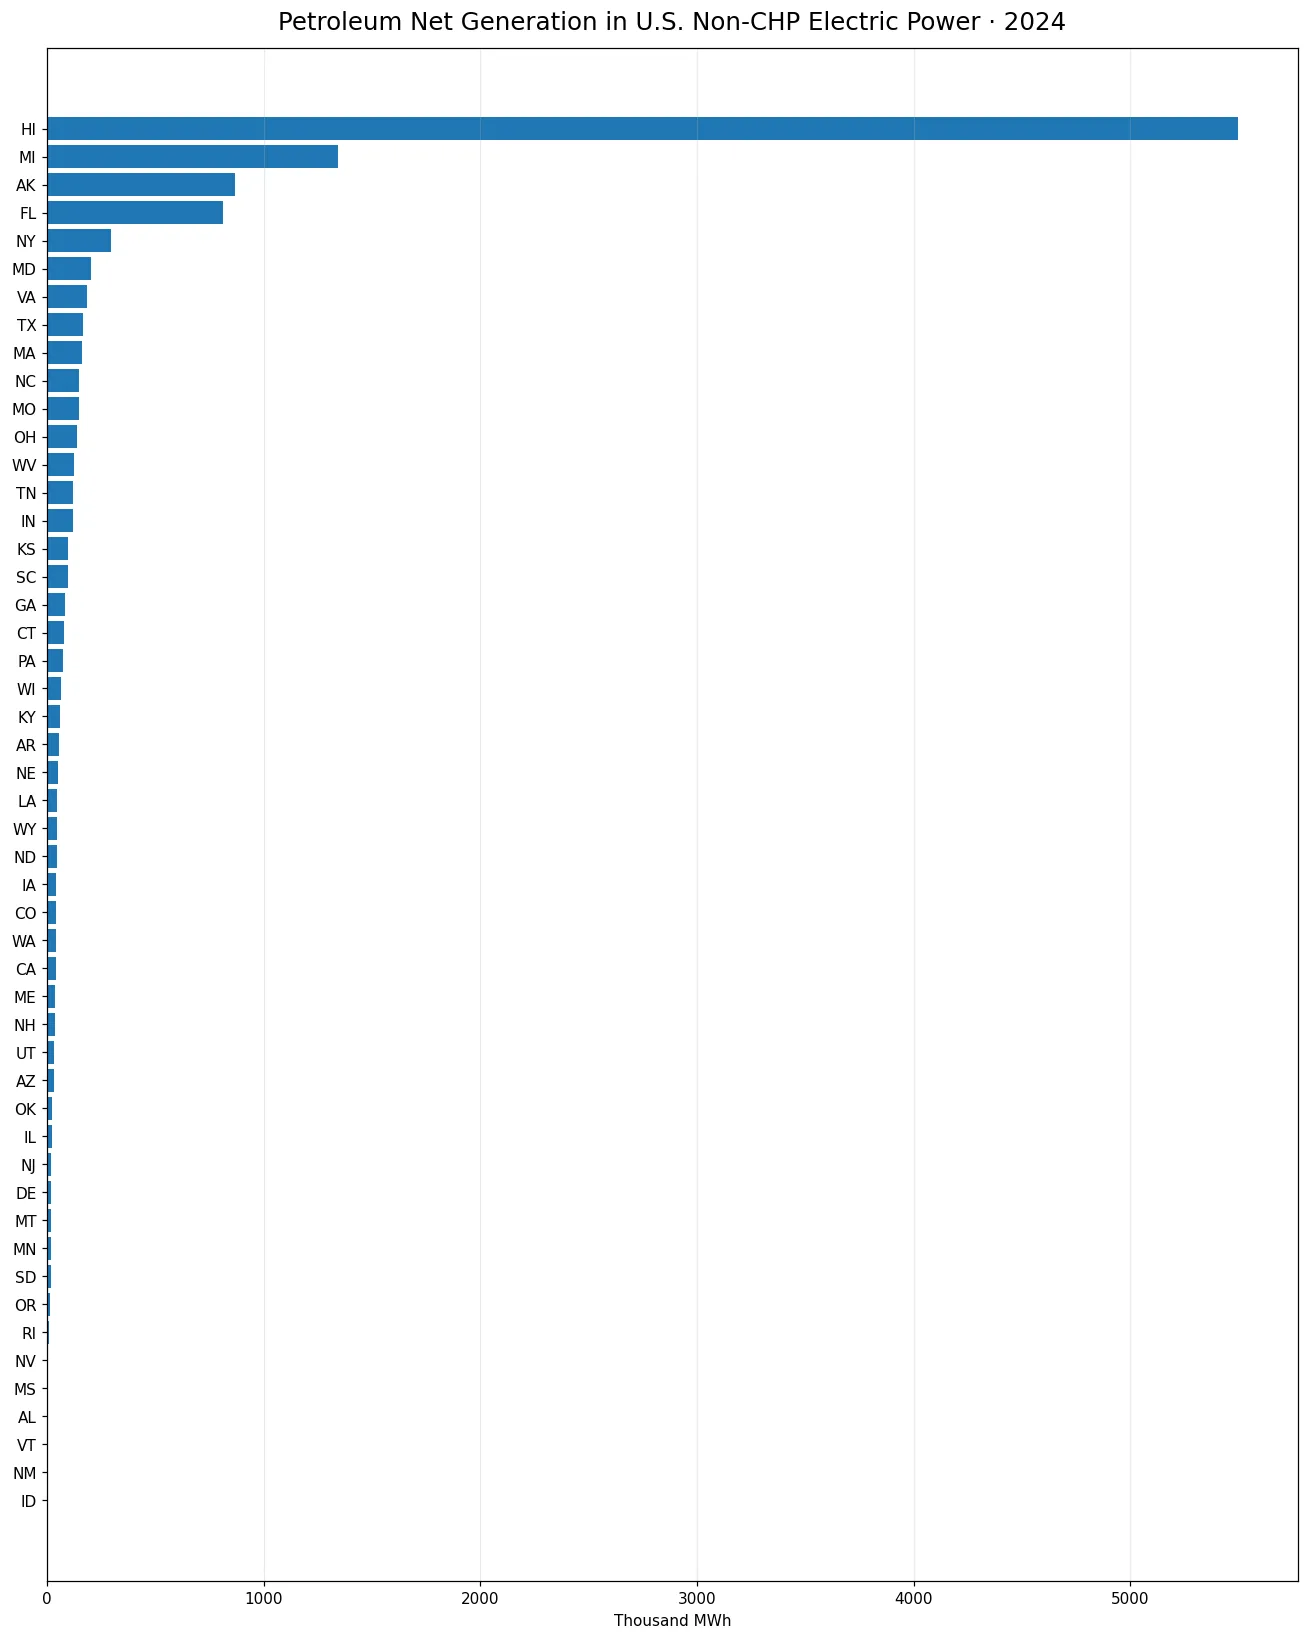
Table of Contents
Hawaii alone accounted for nearly half of the 50-state total
Hawaii stands far above every other state in this 2024 slice. Its 5,498.463 thousand MWh represents 47.51% of the total. Michigan accounts for 11.62%, Alaska for 7.49%, and Florida for 6.99%. The top three states together contribute 66.61% of all reported generation in the 50-state comparison. That concentration means a national average can be misleading if it is read as though generation were evenly distributed across the country.
The top ten states produced 9,671.414 thousand MWh, or 83.56% of the total. The other forty states therefore account for only about 16.44%. This imbalance also appears in the summary statistics: the mean is 231.476 thousand MWh, while the median is only 46.186. A handful of large observations pulls the mean upward, so the median, rankings, and cumulative shares provide a clearer description of the typical state and the degree of concentration.
| State | Code | Net generation (thousand MWh) | Share of 50-state total |
|---|---|---|---|
| Hawaii | HI | 5,498.463 | 47.51% |
| Michigan | MI | 1,344.301 | 11.62% |
| Alaska | AK | 866.329 | 7.49% |
| Florida | FL | 809.375 | 6.99% |
| New York | NY | 295.266 | 2.55% |
| Maryland | MD | 200.317 | 1.73% |
| Virginia | VA | 183.065 | 1.58% |
| Texas | TX | 167.519 | 1.45% |
| Massachusetts | MA | 158.877 | 1.37% |
| North Carolina | NC | 147.901 | 1.28% |
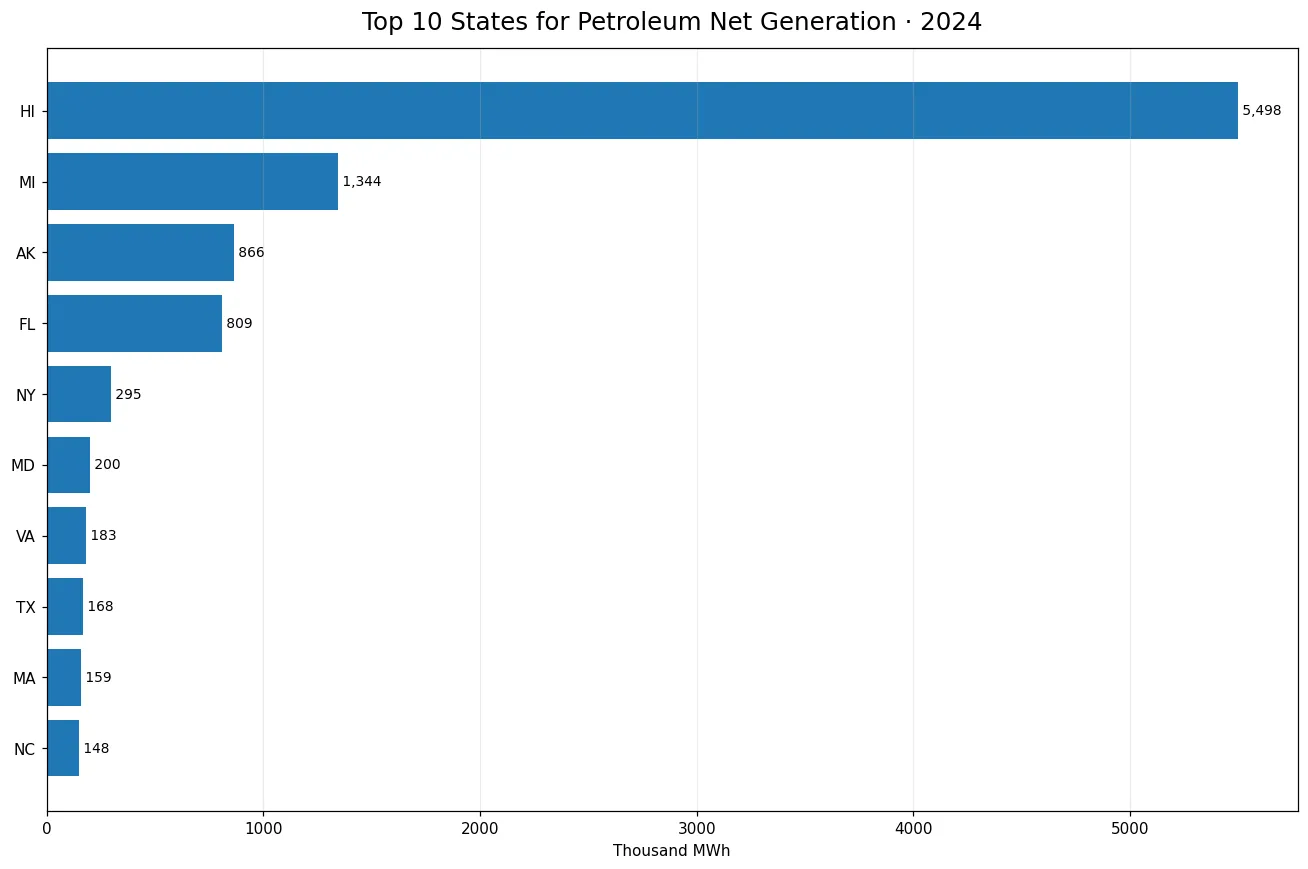
Michigan, Alaska, and Florida form the next tier
After Hawaii, Michigan recorded 1,344.301 thousand MWh and Alaska 866.329. Florida followed at 809.375. The gap between Hawaii and Michigan is 4,154.162 thousand MWh, much larger than the gap between Michigan and Alaska. This separation is important because it shows that the distribution is not merely top-heavy; it has one exceptionally large observation followed by a much smaller second group.
New York, Maryland, Virginia, Texas, Massachusetts, and North Carolina complete the top ten. Their values matter to the national total, but each remains far below Hawaii. An all-state chart preserves the full distribution, whereas the top-ten chart reveals the spacing among the leading states without the longest bar compressing every other value. Using both views helps distinguish two questions: how unusual the leading observation is, and how the remaining high-value states compare with one another.
The median was 46.2 thousand MWh, far below the mean
The median across the 50 states is 46.186 thousand MWh. The first quartile is 19.732 and the third quartile is 123.791 thousand MWh, placing the middle half of states within a relatively narrow range compared with the largest observations. The mean of 231.476 thousand MWh is roughly five times the median because the upper tail is so long. For readers trying to understand what a typical state looks like, the median is therefore more informative than the arithmetic average by itself.
At the low end, Idaho reported 0.045 thousand MWh, followed by Vermont at 0.752 and Alabama at 3.084. All 50 states have reported numeric values in this comparison, and none is exactly zero. A very small value should therefore remain a small reported value rather than being treated as missing. The span from 0.045 to 5,498.463 thousand MWh is another indication that the petroleum generation profile varies dramatically by state.
Generation is not the same thing as petroleum consumption
The generation field measures electric output. Fuel-consumption fields measure an input. EIA may express those inputs in physical units or in energy units such as million MMBtu, while generation remains in megawatthours. A state can rank differently on input and output measures because conversion efficiency, unit operation, fuel characteristics, and the set of plants included in a sector can differ. This is why a petroleum consumption article and a petroleum generation article are related but not duplicates.
The distinction also prevents incorrect ratios. Dividing a generation value by a consumption value can be meaningful only when the fuel code, sector, year, coverage, and unit definitions are aligned. PET should not automatically be combined with PEL or another petroleum-related code, and sector 90 should not be mixed with sector 98 or 99 without understanding the scope change. The safest reading of this chart is therefore direct: it ranks 2024 net generation from petroleum under one exact EIA facet combination.
Sector 90 limits the comparison to Electric Power Sector Non-CHP
Sectorid 90 is Electric Power Sector Non-CHP. It does not represent every petroleum-fired generator in every sector of the economy, and it does not include CHP in the same way a broader sector definition might. Other EIA sector codes can include electric utilities, independent power producers, broader electric power activity, or all sectors. A change in sector code can change both the facilities included and the resulting state totals even when the fuel and year are unchanged.
That scope also matters when interpreting the percentages. Hawaii’s 47.51% share is calculated from the sum of the 50 sector-90 state observations shown here. It is not a share of every petroleum use in the United States, every petroleum-fired megawatthour across all possible sectors, or total U.S. electricity generation. Keeping the denominator tied to the exact 50-state series prevents a striking concentration figure from being stretched beyond what the data actually measure.
The 2024 values are a cross-section, not a long-term trend
Every observation in this comparison refers to 2024. A single annual snapshot can reveal geographic concentration, but it does not show whether a state is increasing or decreasing its petroleum generation over time. Annual operating conditions can vary, and the current data do not by themselves identify why one state generated more petroleum-fired electricity than another. Explaining a cause would require additional evidence on plant fleets, operating schedules, fuel use, demand, or other system conditions.
A proper trend comparison would keep PET, sector 90, the generation field, and thousand-MWh units fixed while adding other years. Mixing a 2024 generation series with a 2025 consumption series would create an apparent difference that partly reflects a change in measurement rather than a change through time. The present article therefore focuses on the spatial pattern in 2024 and avoids assigning a long-run direction where no consistent time series has been evaluated.
Concentration statistics summarize where output occurred, not why
The top-three share of 66.61% and top-ten share of 83.56% are simple concentration summaries. They show that most of the reported non-CHP petroleum generation came from a relatively small number of states. They do not measure efficiency, reliability, cost, emissions, or policy quality. Net generation is an output quantity. Each of those other questions requires a different set of evidence and often a different denominator.
This separation between description and explanation is especially important when one state dominates the chart. A large bar is evidence of a large reported generation value under the stated scope, not evidence of a particular motive or performance outcome. The state ranking can guide further investigation, but the ranking itself should remain descriptive. Readers can confidently say where petroleum net generation was concentrated in 2024 while remaining cautious about claims concerning the reasons behind that pattern.
Related EIA measures can add context when their definitions match
Petroleum heat content, petroleum consumption for electricity generation, and total petroleum consumption can help describe the input side of the same broad energy system. They are most useful when compared with careful attention to fuel and sector codes. For example, heat content describes an energy conversion characteristic, consumption-for-eg describes fuel input used for electricity generation, and generation describes the resulting electric output. None of these is a substitute for another.
Combining related measures can support a deeper analysis of state power systems, but only after confirming that the observations cover the same facilities and period. If the scopes differ, apparent efficiency or intensity differences can be artifacts of mismatched definitions. For this reason, the generation series is presented here as its own baseline. It answers a direct question—how much petroleum net generation was reported by state in the non-CHP electric power sector in 2024—without importing assumptions from neighboring metrics.
A checklist for reading the state comparison correctly
Five details define the series: fueltypeid PET, sectorid 90, field generation, annual year 2024, and unit thousand megawatthours. A comparison that changes any one of these can legitimately produce a different ranking. Titles that mention only petroleum and electricity can therefore hide important differences. The fuel code identifies the energy category, the sector code defines the included activity, the field identifies output versus input, the year fixes the time period, and the unit determines what the number physically represents.
With those conditions fixed, the 2024 result is clear. Hawaii contributes 47.51% of the 50-state total, Michigan and Alaska follow at 11.62% and 7.49%, and the top ten together contribute 83.56%. The median is only 46.186 thousand MWh, while the maximum is 5,498.463. The unusually wide spread is the central feature of the data and the most useful conclusion for readers comparing state-level petroleum generation.
Frequently Asked Questions
Which state had the most non-CHP petroleum net generation in 2024?
Hawaii led with 5,498.463 thousand MWh, equal to 47.51% of the 50-state total.
Is this the same as petroleum fuel consumption?
No. This series uses the generation field and measures electric output in thousand MWh. Fuel consumption and heat-content measures use different fields and units.
What does EIA sector 90 mean?
Sector 90 is Electric Power Sector Non-CHP. It does not represent all petroleum use across the economy or every electric-power sector definition.
How concentrated was the state distribution?
The top three states accounted for 66.61% and the top ten for 83.56% of the 50-state total.
Related Articles
Green Map creates custom-edited map images using open geographic data sources such as geoBoundaries, Natural Earth, OpenStreetMap, and government open data. These maps are edited visual materials, not raw data files, and are provided for education, documents, presentations, and graphic reference.