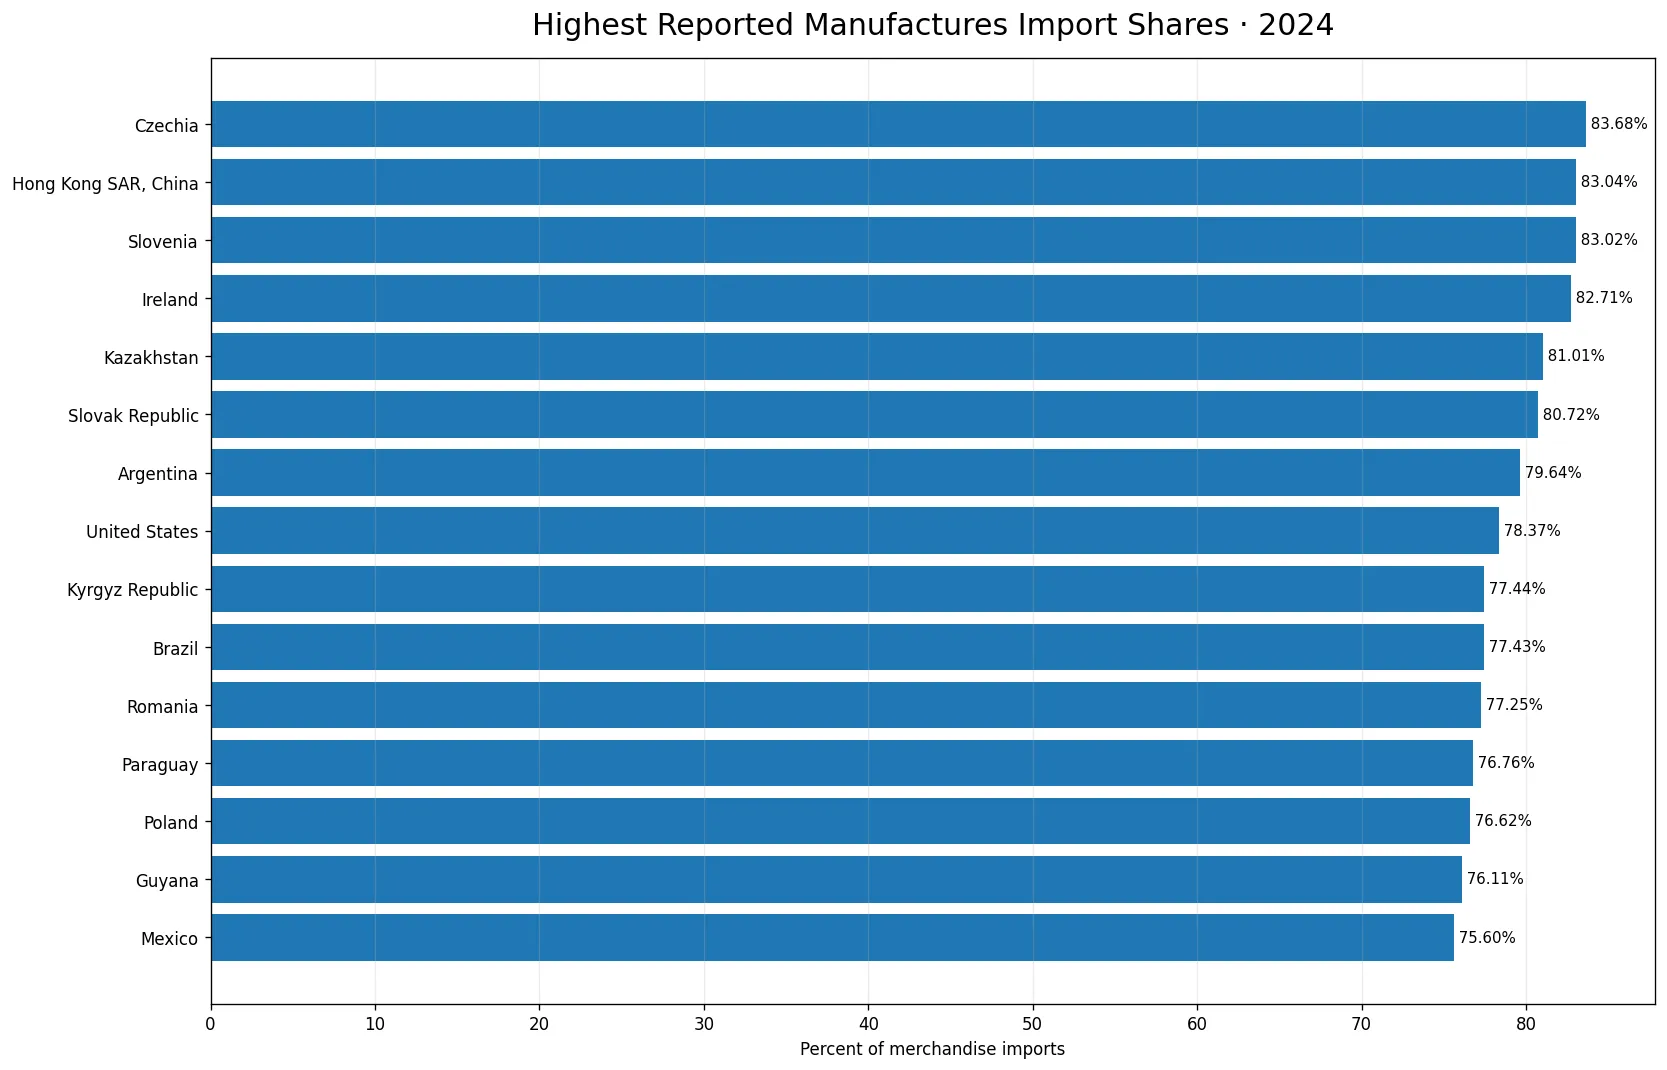
Manufactured goods accounted for very different shares of merchandise imports across reporting economies in 2024. Czechia had the highest reported value at 83.68%, followed by Hong Kong SAR, China at 83.04%, Slovenia at 83.02%, Ireland at 82.71%, and Kazakhstan at 81.01%. The World Bank country-and-economy master contains 217 rows for this comparison, with 131 reported 2024 values and 86 source-missing observations. The indicator is a composition measure: it shows the percentage of merchandise imports classified as manufactures. It does not show the absolute value of manufactured-goods imports, so a higher percentage does not necessarily mean a larger import market in dollar terms.
The World Bank indicator code is TM.VAL.MANF.ZS.UN and the unit is percent. Manufactures cover major SITC Revision 3 groups including chemicals, basic manufactures, machinery and transport equipment, and miscellaneous manufactured articles, with non-ferrous metals in division 68 excluded from this definition. The denominator is merchandise imports, not imports of services. The metric is therefore useful for describing the structure of goods imports, but it is not a direct measure of manufacturing output, domestic industrial capacity, productivity, consumer purchasing power, or trade competitiveness. Economies can reach similar percentages for very different reasons.
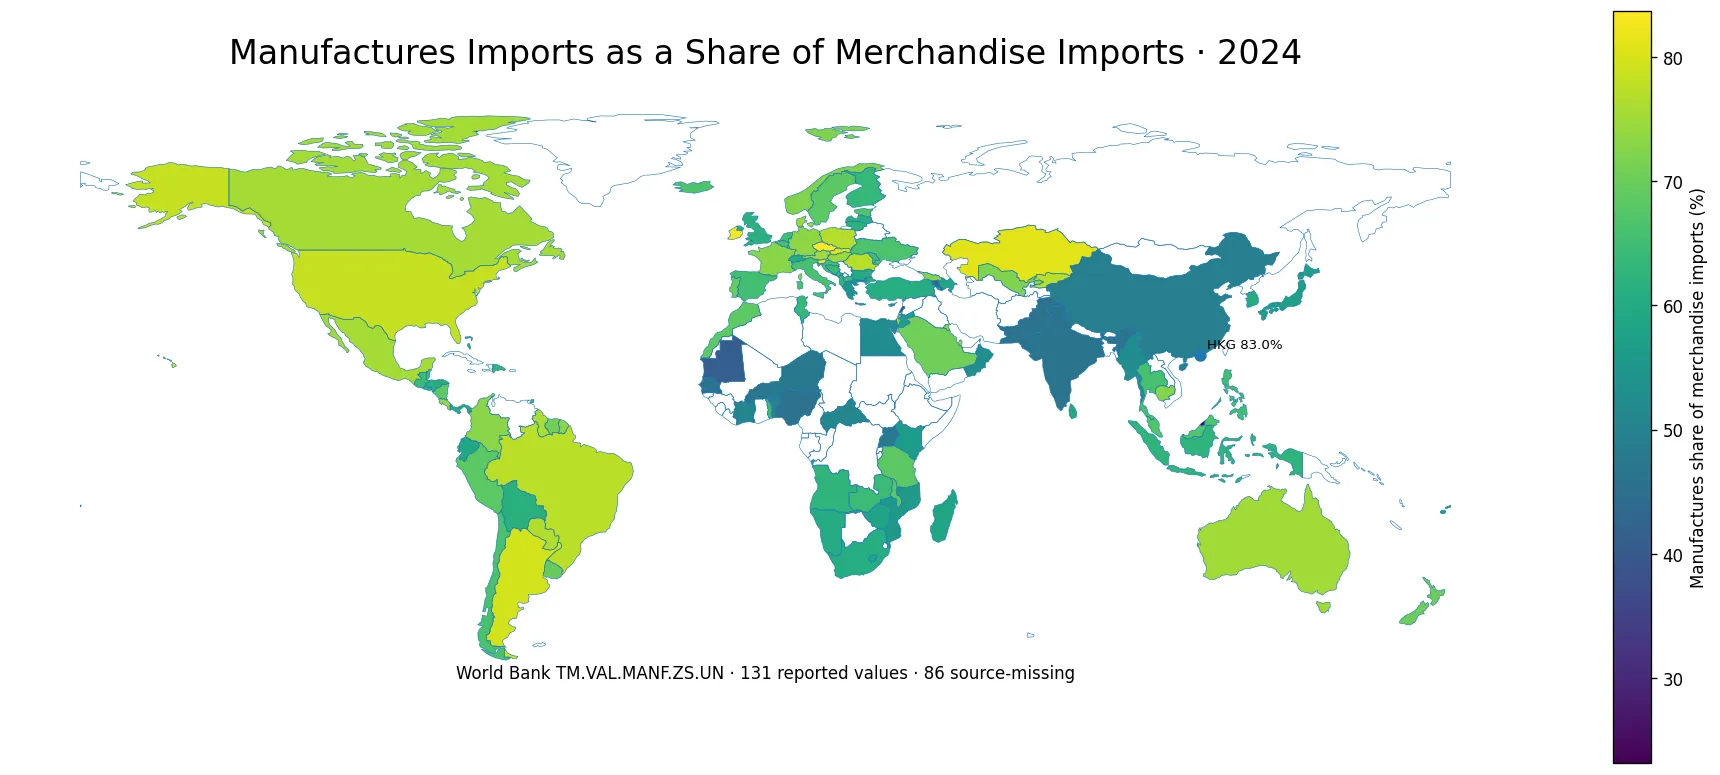
Table of Contents
Only six reporting economies were above 80%
Among the 131 reported values, 6 economies were at or above 80%. Czechia, Hong Kong SAR, Slovenia, Ireland, Kazakhstan, and the Slovak Republic make up that group. Expanding the threshold to 75% raises the count to 18, while 36 economies were at or above 70%. The upper group is geographically mixed: European, Asian, and American economies all appear near the top. Several Central and Eastern European economies are especially visible, but the indicator alone cannot establish why their shares are high. Machinery imports, transport equipment, chemicals, intermediate manufactured inputs, consumer goods, and the size of non-manufactured imports can all affect the ratio.
The center of the 2024 distribution was in the low-to-mid 60s
The mean across reported economies was 63.22% and the median was 64.33%. The first quartile was 56.99% and the third quartile was 70.76%, placing the middle half of observations in a relatively compact band from roughly 57% to 71%. The close relationship between the mean and median suggests that the overall center is not being dominated by only a few extreme observations. A total of 88 economies were at or above 60%, and 116 were at or above 50%. Only 15 reported economies were below the halfway mark, showing that manufactured products formed a majority of merchandise imports in most economies with available 2024 values.
A high share is not a ranking of manufacturing strength
The United States recorded 78.37%, placing it among the higher observations, but the percentage should not be used to rank economies by the size or strength of their manufacturing sectors. A very large trading economy can have a slightly lower share while still importing far more manufactured goods in absolute value. A smaller economy can have a high share because its import basket is concentrated in vehicles, machinery, chemicals, electronics, and other manufactured items. Domestic manufacturing capacity can also coexist with large imports of specialized components and capital goods. For these reasons, the ranking describes merchandise-import composition rather than industrial competitiveness or market size.
| Country/economy | Manufactures share |
|---|---|
| Czechia | 83.68% |
| Hong Kong SAR, China | 83.04% |
| Slovenia | 83.02% |
| Ireland | 82.71% |
| Kazakhstan | 81.01% |
| Slovak Republic | 80.72% |
| Argentina | 79.64% |
| United States | 78.37% |
| Kyrgyz Republic | 77.44% |
| Brazil | 77.43% |
| Romania | 77.25% |
| Paraguay | 76.76% |
| Poland | 76.62% |
| Guyana | 76.11% |
| Mexico | 75.60% |
Even the lower end often remained a substantial share of imports
Brunei Darussalam had the lowest reported value at 23.17%. French Polynesia was at 39.41%, Lebanon 39.99%, and Mauritania 40.77%. Only three reported observations were below 40%, and only 15 were below 50%. This means that even many economies near the lower end still obtained a large fraction of their merchandise imports from manufactured categories. A lower share does not imply that manufactured goods are unimportant. It can also mean that fuels, food, minerals, raw materials, or other non-manufactured goods occupy a larger portion of the import bill. The ratio reflects the mix of imports rather than an absolute shortage of manufactured products.
| Lower-share country/economy | Manufactures share |
|---|---|
| Brunei Darussalam | 23.17% |
| French Polynesia | 39.41% |
| Lebanon | 39.99% |
| Mauritania | 40.77% |
| Armenia | 43.39% |
| Gambia, The | 44.71% |
| Nigeria | 45.97% |
| Pakistan | 46.13% |
| Senegal | 46.36% |
| India | 46.45% |
| Burkina Faso | 46.87% |
| Uganda | 47.28% |
| Niger | 47.53% |
| Samoa | 47.95% |
| China | 49.29% |
Large trading economies illustrate why shares and values must be separated
China recorded 49.29% and India 46.45%, both below the 2024 median. Those percentages do not imply small manufactured-goods import markets. Because total merchandise imports differ enormously across economies, a lower share can still correspond to a very large dollar value. The composition can also shift when energy, minerals, agricultural commodities, or other imports rise or fall. If commodity import prices surge, the manufactures share may decline even when the value of manufactured imports remains stable or increases. To answer questions about market size, the percentage needs to be paired with total merchandise-import values or a direct manufactured-import series.
Machinery and transport equipment can strongly influence the ratio
The manufactures definition includes machinery and transport equipment, which can represent a large part of imports in economies that buy vehicles, industrial machinery, electrical equipment, computers, and components from abroad. Chemicals, basic manufactures, and miscellaneous manufactured articles are also included, so no single product category determines the outcome. Changes in capital investment, automotive demand, industrial supply chains, or intermediate-input sourcing can all move the numerator. At the same time, changes in fuel or raw-material imports move the denominator. A change in the percentage is therefore the combined result of several trade flows, and detailed product data are needed before assigning a specific cause.
Missing observations are not low-share observations
Of the 217 country-and-economy rows, 86 have no 2024 value. Those observations remain no data on the map. They are not treated as 0%, because missing information and an observed zero have very different meanings. In fact, none of the 131 reported values is exactly zero; the minimum is 23.17%. Converting the missing group to zero would create a false cluster of extremely low shares and distort the global distribution. The rankings and summary statistics therefore describe the 131 economies with published values, not every row in the master geography list.
What the 2024 map can answer well
The map is well suited to identifying economies where manufactured products dominate the merchandise-import basket, finding regional concentrations, and comparing neighboring economies with different import structures. It can also help locate outliers at both ends of the distribution. The indicator cannot by itself tell us whether an economy has a competitive manufacturing industry, whether its supply chains are resilient, how much consumers spend on imported manufactured products, or whether the trade balance is favorable. Those questions require additional information such as manufacturing value added, export composition, detailed SITC trade values, domestic production, and total import values.
Source and calculation method
The source is the World Bank indicator TM.VAL.MANF.ZS.UN for 2024, expressed as a percentage of merchandise imports. Aggregate regional groups are excluded from the country-and-economy master used here. There are 131 reported values and 86 source-missing observations. The mean (63.22%), median (64.33%), quartiles, and rankings are calculated directly from the reported values. Missing observations are not imputed or converted to zero. The definition follows the World Bank indicator description based on relevant SITC Revision 3 manufactured-goods sections. If the World Bank revises or adds 2024 observations later, coverage and individual values may change.
Frequently Asked Questions
Which economy had the highest manufactures share of merchandise imports in 2024?
Czechia had the highest reported share at 83.68%, followed by Hong Kong SAR at 83.04% and Slovenia at 83.02%.
Does a higher share mean a larger dollar value of manufactured imports?
No. The indicator is a percentage of merchandise imports. Economies with different total import values can have very different manufactured-import amounts.
Are economies with no 2024 value treated as 0%?
No. The 86 source-missing observations remain no data and are not converted to zero.
What goods are included in manufactures?
The World Bank definition covers major SITC Revision 3 manufactured-goods sections such as chemicals, basic manufactures, machinery and transport equipment, and miscellaneous manufactured articles, with non-ferrous metals in division 68 excluded.
Related Articles
Green Map creates custom-edited map images using open geographic data sources such as geoBoundaries, Natural Earth, OpenStreetMap, and government open data. These maps are edited visual materials, not raw data files, and are provided for education, documents, presentations, and graphic reference.