Ohio recorded the largest 2024 petroleum consumption for useful thermal output in the U.S. Energy Information Administration electricity operational series when the sector dimension is set to All Sectors. Ohio reported 1,152.430 thousand barrels, followed by Michigan at 927.066 and Georgia at 777.929 thousand barrels. The 50 states plus the District of Columbia sum to 5,276.805 thousand barrels, with Ohio accounting for 21.84% of that simple total. The exact series definition is fueltypeid=PET, sectorid=99, field=consumption-uto, annual frequency, and 2024. “All Sectors” refers to the sector dimension inside this EIA electricity operational series; it should not be expanded into a claim about all petroleum use across the entire U.S. economy.
The field consumption-uto measures the physical quantity of petroleum assigned to useful thermal output. It is separate from petroleum consumed for electricity generation, and it is not the amount of electricity or heat produced. The unit is thousand barrels, which also makes this series different from an energy-content measure expressed in million MMBtu. Physical volume is useful for understanding how much liquid fuel was consumed, while a Btu measure answers a different question about energy content. The values should also not be interpreted as statewide heating-oil use or transportation fuel demand. They belong to the specific EIA electricity operational framework represented by the selected facets.
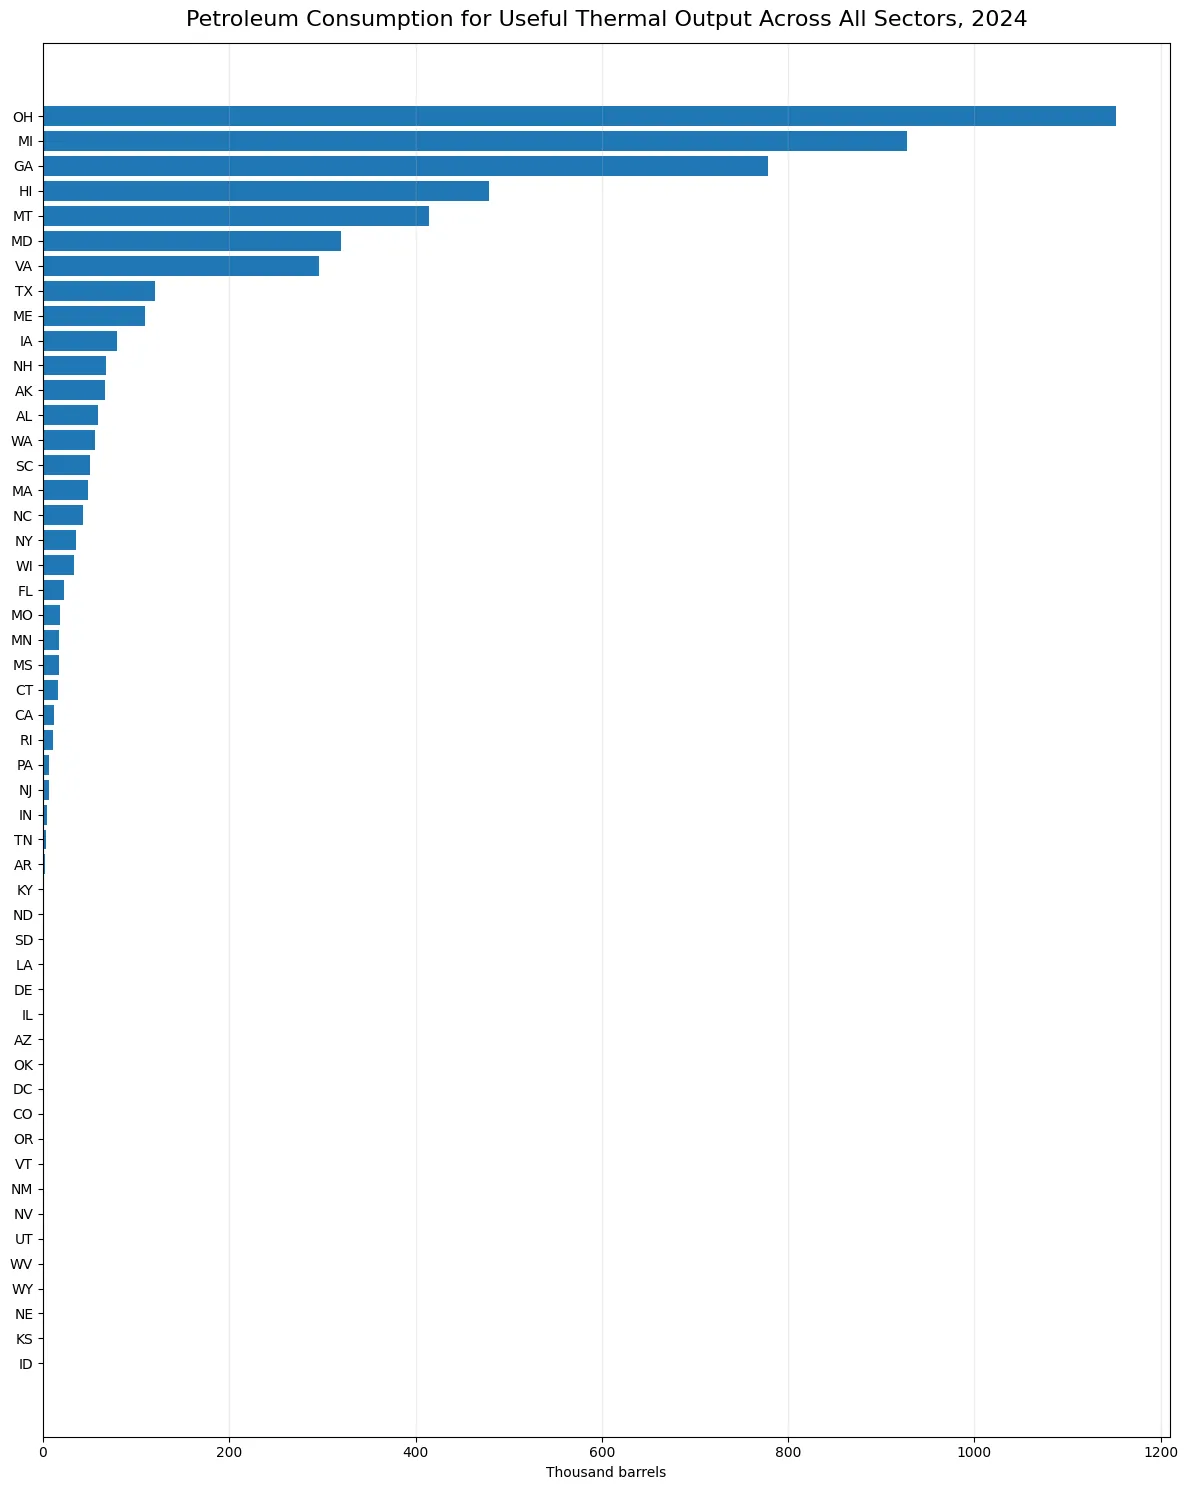
Table of Contents
Ohio, Michigan and Georgia account for 54.15% of the simple total
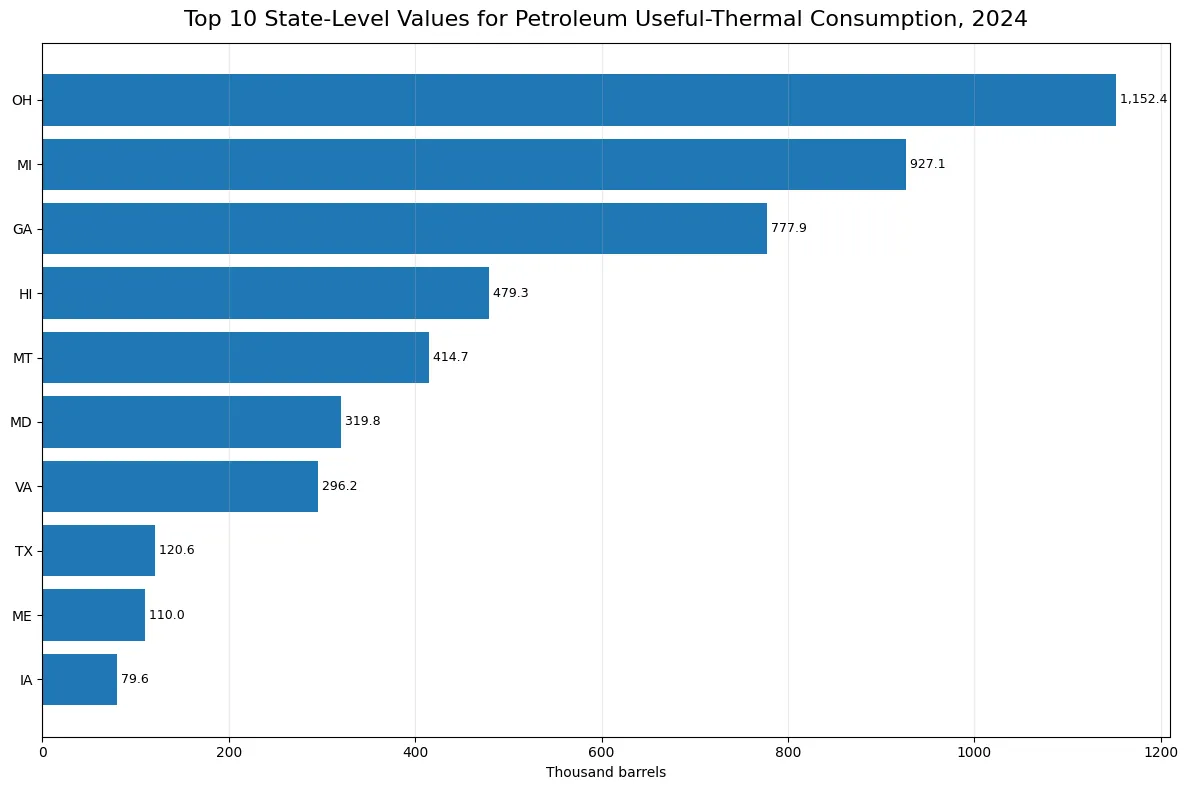
Ohio contributes 21.84% of the 51-observation sum, Michigan 17.57%, and Georgia 14.74%. Together, those three states represent 54.15% of the total. Adding Hawaii at 479.259 thousand barrels and Montana at 414.715 brings the top-five share to 71.09%. The top ten reach 88.65%. This is therefore a strongly concentrated distribution rather than one in which useful-thermal petroleum consumption is spread evenly across jurisdictions. Ohio alone is about 110.3 times the median observation, showing how far the leading states sit above the center of the distribution.
Hawaii and Montana complete a top five that reaches 71.09%
Hawaii ranks fourth at 479.259 thousand barrels and Montana fifth at 414.715. Maryland follows at 319.828, Virginia at 296.184, Texas at 120.584, Maine at 110.007, and Iowa at 79.647. The upper tail falls quickly after the first few states, especially once the ranking moves beyond the top seven. A full-state chart can make many middle and low observations look small because the leading states stretch the scale. The separate top-ten view therefore helps show differences within the upper group without removing the extreme values that define the overall distribution.
| State/jurisdiction | Consumption (thousand barrels) | Share of 51-observation sum |
|---|---|---|
| Ohio | 1,152.430 | 21.84% |
| Michigan | 927.066 | 17.57% |
| Georgia | 777.929 | 14.74% |
| Hawaii | 479.259 | 9.08% |
| Montana | 414.715 | 7.86% |
| Maryland | 319.828 | 6.06% |
| Virginia | 296.184 | 5.61% |
| Texas | 120.584 | 2.29% |
| Maine | 110.007 | 2.08% |
| Iowa | 79.647 | 1.51% |
The median is only 10.45 thousand barrels, far below the mean
The arithmetic mean across the 51 observations is 103.467 thousand barrels, but the median is only 10.445. The first quartile is 0.020 and the third quartile is 57.173 thousand barrels. The mean is almost 9.9 times the median because a small group of very large observations pulls the average upward. Half of the jurisdictions fall roughly between the first and third quartiles, a range far below Ohio, Michigan and Georgia. For a distribution this skewed, the median and quartiles describe the middle more faithfully than the mean by itself.
Eight jurisdictions report genuine zero values, not missing observations
There are 0 missing observations in the 2024 series and 8 exact zeros. The zero-value jurisdictions are Idaho, Kansas, Nebraska, New Mexico, Nevada, Utah, West Virginia, Wyoming. The remaining 43 jurisdictions have positive values. Zero and no data are therefore not interchangeable in this comparison. The District of Columbia, for example, is not zero; it reports 0.011 thousand barrels. Colorado at 0.008, Oregon at 0.007, and Vermont at 0.006 are also small but positive observations. Preserving those distinctions matters because rounding every tiny value to zero would erase information that is present in the published series.
| Low-value state/jurisdiction | Consumption (thousand barrels) |
|---|---|
| Idaho | 0.000 |
| Kansas | 0.000 |
| New Mexico | 0.000 |
| Nebraska | 0.000 |
| Nevada | 0.000 |
| Utah | 0.000 |
| Wyoming | 0.000 |
| West Virginia | 0.000 |
| Vermont | 0.006 |
| Oregon | 0.007 |
Sector 99 and sector 98 describe different scopes
This series is easy to confuse with a closely related petroleum useful-thermal series for sector 98, Electric Power. The fuel, year, field, and unit can be the same while the sector facet changes the scope. In the sector 98 comparison, Montana is the leading state; in the sector 99 All Sectors comparison shown here, Ohio and Michigan move to the top. That difference is not a contradiction. It reflects a different selection in the sector dimension. When two EIA pages have similar public wording, checking the facet combination is the safest way to determine whether they are duplicates or genuinely different measurements.
Physical barrels and Btu-based energy content answer different questions
The present series is measured in thousand barrels. A related EIA series can express petroleum consumption for useful thermal output in million MMBtu. Those measures should not be combined as if they were interchangeable. Barrels describe physical volume. Btu describes energy content. Different petroleum products can carry different heat content per physical unit, so a state’s position can change when the comparison moves from barrels to MMBtu. The physical series is more direct for answering how much liquid fuel volume was used, while the energy-content series is better for comparing the amount of energy embodied in the fuel. Neither one should be silently substituted for the other.
Useful-thermal consumption is only one component of total fuel consumption
The EIA operational data also distinguish fuel assigned to electricity generation from fuel assigned to useful thermal output. Total consumption combines those purposes. The selected consumption-uto field isolates the useful-thermal component, which is especially relevant when facilities produce usable heat in addition to electricity. That does not mean the state values represent every source of useful heat in the economy. The scope remains the EIA electricity operational system captured by these facets. Petroleum used in transportation, ordinary building heating outside that statistical scope, and other noncovered activity should not be added conceptually to these values.
A high absolute volume is not the same as high petroleum dependence
Ohio’s first-place position tells us that its reported physical petroleum volume for useful thermal output is the largest in this 2024 series. It does not establish that Ohio relies on petroleum for the largest share of its energy system. Dependence is a ratio question and requires a denominator such as total fuel use, total useful-thermal input, or another measure of system scale. A large system can consume more petroleum in absolute terms while petroleum still represents a small fraction of its overall activity. The reverse can happen in a smaller system. The current ranking should therefore be used to describe volume, not fuel-mix share or efficiency.
The 2024 cross-section describes concentration, not a long-term trend
The 2024 observations show a concentrated pattern: the top ten account for 88.65% of the simple 51-observation sum, eight jurisdictions are exactly zero, and the median is 10.445 thousand barrels. Those are direct properties of the 2024 cross-section. They do not tell us whether Ohio’s value has been rising, whether Michigan recently overtook another state, or whether a policy or facility change caused the distribution. A trend analysis would need multiple years collected with the same PET fuel facet, sector 99, consumption-uto field, annual frequency, and thousand-barrel unit. Changing one of those dimensions would turn the comparison into a different series rather than a clean year-over-year change.
Source and calculation method
The source is the U.S. Energy Information Administration electricity/electric-power-operational-data annual series. The 2024 comparison uses fueltypeid=PET, sectorid=99 (All Sectors), field=consumption-uto, and thousand barrels. The sum of 5,276.805, mean of 103.467, median of 10.445, quartiles, rankings, and state shares were calculated directly from the 51 published state and District of Columbia observations. No missing observation was imputed, no zero was converted into another value, and no other year was mixed into the calculations. If EIA later revises the 2024 observations, the same facet and field definition can be used to refresh the comparison.
Frequently Asked Questions
Which jurisdiction had the highest 2024 petroleum consumption for useful thermal output in the EIA All Sectors series?
Ohio ranked first at 1,152.430 thousand barrels, followed by Michigan at 927.066 and Georgia at 777.929.
Does All Sectors mean all petroleum use in the entire U.S. economy?
No. Sector 99 All Sectors is the sector dimension within the EIA electricity operational series. It should not be expanded to transportation, buildings, and all other petroleum use in the economy.
Why does this ranking differ from the sector 98 Electric Power ranking?
The sector facet changes the statistical scope. The fuel, year, field, and unit can match while sector 99 and sector 98 still describe different selections.
Are the eight zero values missing data?
No. They are genuine reported zeros. The 2024 series has no missing state-level observations.
Related Articles
Green Map creates custom-edited map images using open geographic data sources such as geoBoundaries, Natural Earth, OpenStreetMap, and government open data. These maps are edited visual materials, not raw data files, and are provided for education, documents, presentations, and graphic reference.