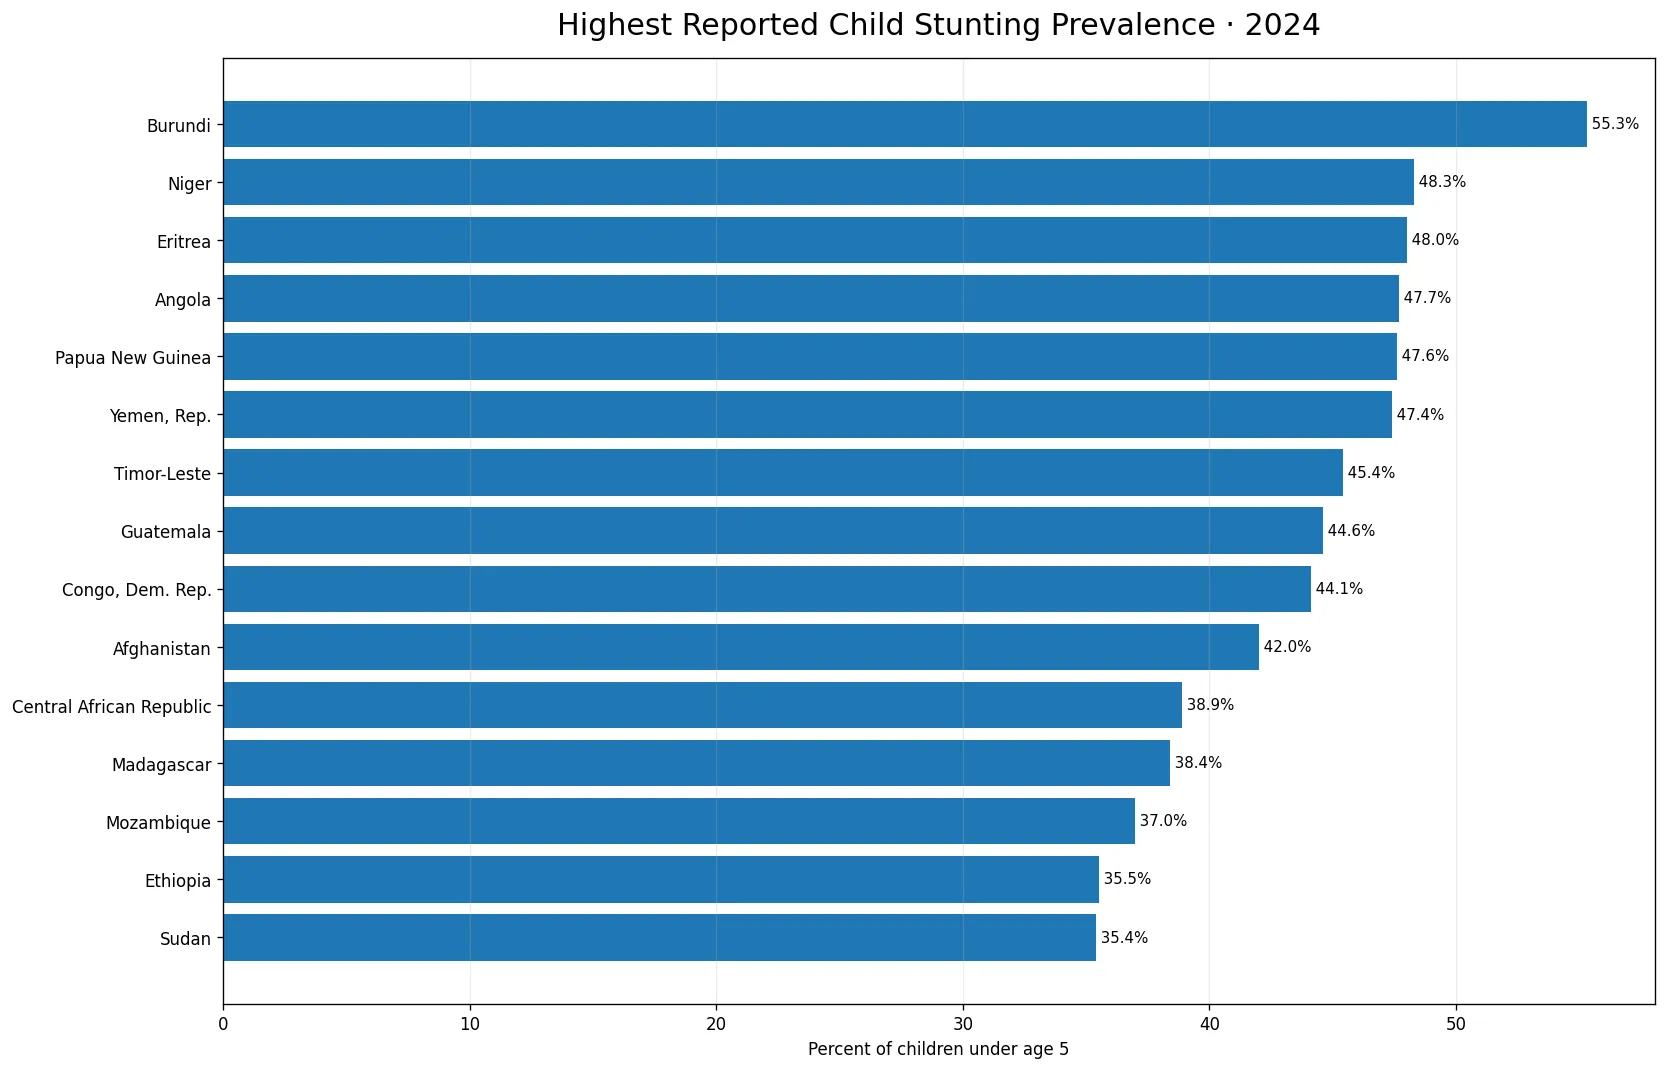
World Bank modeled estimates for 2024 show a very wide cross-country range in stunting among children under age 5. Burundi has the highest reported value at 55.3%, followed by Niger at 48.3%, Eritrea at 48.0%, Angola at 47.7%, and Papua New Guinea at 47.6%. Of the 217 countries and economies in the source master, 162 have a 2024 value and 55 are source-missing. Missing observations are not treated as zero. The indicator measures the share of children under 5 whose height-for-age is more than two standard deviations below the median of the WHO child growth standards. It is therefore a standardized prevalence measure of chronic growth shortfall, not a comparison of average national height.
The indicator code is SH.STA.STNT.ME.ZS and the unit is percent of children under age 5. Across the 162 reported observations, the mean is 16.15% and the median is 11.7%. The first quartile is 5.9% and the third quartile is 24.2%. The mean being above the median shows that the distribution has a long upper tail: a smaller group of countries with very high prevalence raises the arithmetic average. That makes the median and quartiles useful companions to the mean when comparing countries. A value near the average does not necessarily represent the typical reporting economy.
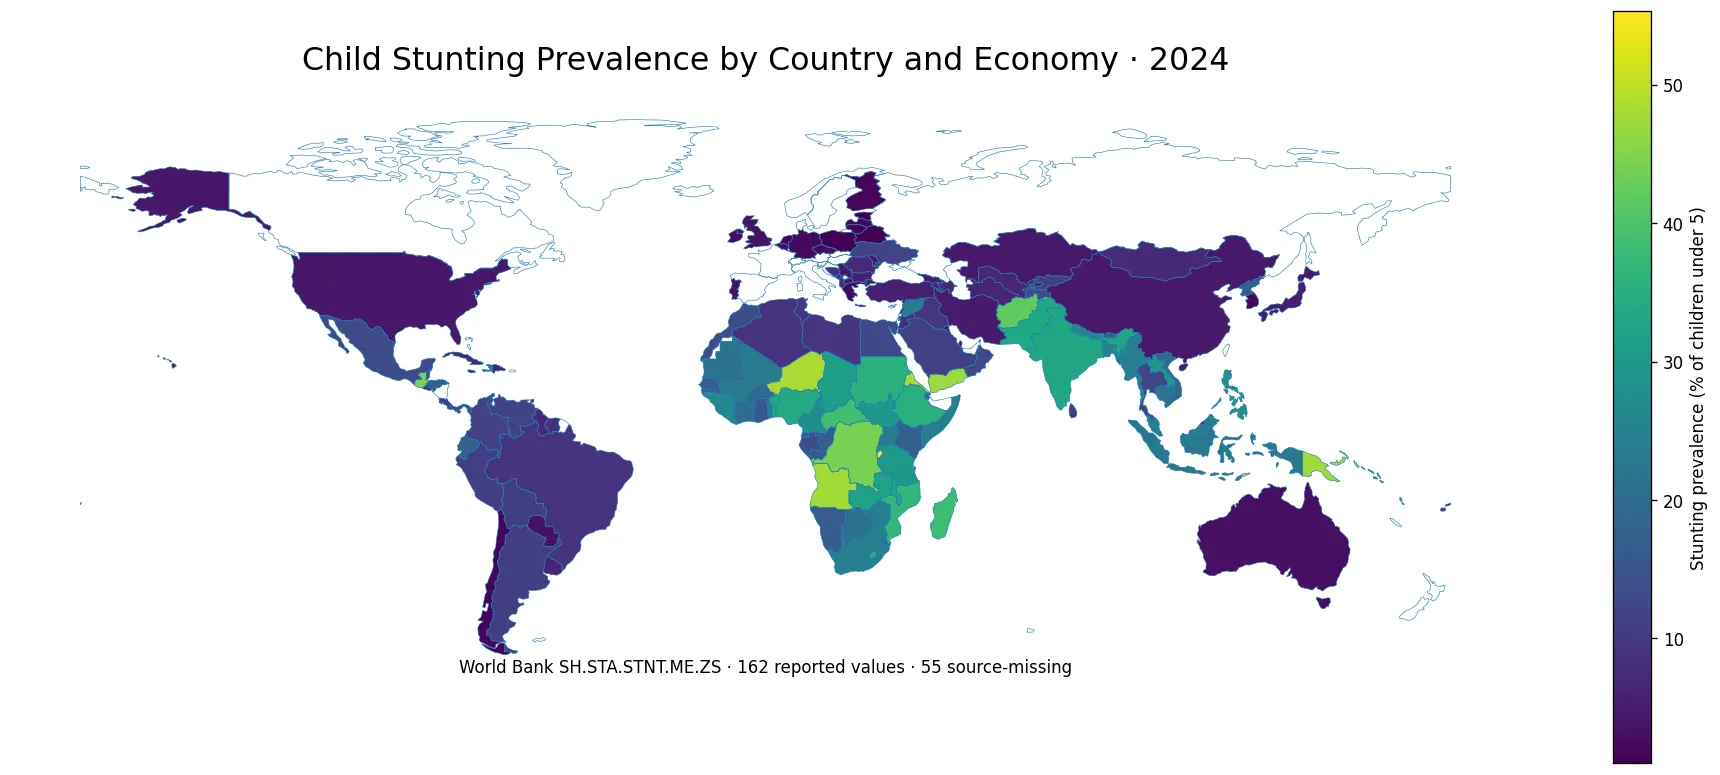
Table of Contents
A small group of countries remains above 40%
10 reporting countries and economies are at or above 40% in 2024, while 26 are at or above 30%. Burundi is the only reported value above 50%, and Niger, Eritrea, Angola, Papua New Guinea, Yemen, Timor-Leste, Guatemala, the Democratic Republic of Congo, and Afghanistan are also above 40%. These values indicate that stunting is common among children under 5 in those populations under the standardized definition. They do not, by themselves, identify the cause. Nutrition, infection, maternal health, sanitation, food access, poverty, and health services can all be relevant, but establishing the contribution of any one factor requires additional evidence beyond this indicator.
The 11.7% median is far below the highest reported values
The median across the reporting set is 11.7%. That means half of the 162 available observations are below this level and half are above it. By comparison, the highest values are four to five times the median. 54 reporting economies are at or above 20%, whereas 69 are below 10%. This broad spread is why a single global average is not enough to describe the dataset. Countries should be interpreted relative to the full distribution, including the median, quartiles, and the share of observations in high-prevalence ranges.
Low reported prevalence is not the same as missing data
The lowest reported value is Poland at 1.0%, followed by Belarus at 1.1%, Estonia at 1.3%, Lithuania at 1.6%, and the Netherlands and Tonga at 1.6%. In total, 33 reporting countries and economies are below 5%. Separately, 55 rows have no 2024 value. Those two states must not be merged. A low observation is a measurement in the statistical series; a missing observation provides no 2024 estimate to rank. The map therefore leaves missing places as no data, and the summary statistics use only the 162 non-missing observations.
| Highest reported country/economy | 2024 prevalence |
|---|---|
| Burundi | 55.3% |
| Niger | 48.3% |
| Eritrea | 48.0% |
| Angola | 47.7% |
| Papua New Guinea | 47.6% |
| Yemen, Rep. | 47.4% |
| Timor-Leste | 45.4% |
| Guatemala | 44.6% |
| Congo, Dem. Rep. | 44.1% |
| Afghanistan | 42.0% |
| Central African Republic | 38.9% |
| Madagascar | 38.4% |
| Mozambique | 37.0% |
| Ethiopia | 35.5% |
| Sudan | 35.4% |
Stunting is different from wasting and underweight
Stunting is defined by height-for-age, so it is generally used to describe longer-term growth restriction. Wasting uses weight-for-height and underweight uses weight-for-age. The measures can overlap in the same child, but they answer different questions and should not be treated as interchangeable. A country can perform differently across the three indicators. This article therefore keeps the interpretation tied to the exact height-for-age definition. The data do not directly measure dietary diversity, anemia, micronutrient deficiencies, obesity, food insecurity, or access to pediatric care.
Modeled estimates should not be over-read at very small decimal differences
The official indicator is explicitly a modeled estimate. This helps create a comparable cross-country series when national surveys occur at different intervals, but it does not mean every 2024 number comes from an identical survey conducted during the same month. Small differences such as 12.0% versus 12.2% should therefore not be treated as precise performance rankings without considering uncertainty and source methods. The map and ranking are strongest for identifying large differences and broad distributional patterns. Detailed policy evaluation requires country-specific survey information, confidence intervals where available, and historical context.
High-prevalence countries appear in several world regions
Many high values are found in Sub-Saharan Africa, but the upper part of the distribution also includes Yemen, Afghanistan, Pakistan, Timor-Leste, Papua New Guinea, and Guatemala. That makes stunting more than a single-region phenomenon. At the same time, countries within the same broad region can have very different prevalence levels. Regional labels are useful for orientation, but they should not substitute for country-level evidence. The world map is best read as a way to locate clusters and contrasts, while the exact country observations provide the basis for comparison.
A low stunting rate is not a complete score for child health
Countries with low stunting prevalence are doing well on this specific height-for-age outcome, but the indicator is not a composite measure of all child health or nutrition conditions. A population can have low stunting and still face other nutrition concerns, including micronutrient deficiencies, unhealthy diets, childhood overweight, or unequal access to care. Conversely, a high stunting estimate does not by itself reveal which intervention would be most effective. The metric should therefore remain a focused indicator rather than being turned into an overall ranking of child well-being or health-system quality.
| Lowest reported country/economy | 2024 prevalence |
|---|---|
| Poland | 1.0% |
| Belarus | 1.1% |
| Estonia | 1.3% |
| Lithuania | 1.6% |
| Netherlands | 1.6% |
| Tonga | 1.6% |
| Chile | 1.7% |
| Finland | 1.7% |
| Latvia | 1.7% |
| Greece | 2.0% |
A 2024 cross-section describes levels, not progress over time
The single-year comparison is useful for showing where prevalence is high or low and how wide the 2024 distribution is. It cannot show whether a country has improved rapidly, stagnated, or worsened. A country at 20% today could have fallen from a much higher level over the previous decade, or it could have remained near 20% for years. Trend analysis needs repeated observations under the same indicator definition. Any future time-series comparison should preserve the SH.STA.STNT.ME.ZS series identity so that changes are not mixed with a different nutrition measure.
Source and calculation method
The source is the World Bank indicator SH.STA.STNT.ME.ZS for 2024, expressed as percent of children under age 5. The source master contains 217 countries and economies; 162 have a non-missing value and 55 are source-missing. The mean (16.15%), median (11.7%), first quartile (5.9%), and third quartile (24.2%) are calculated from the reported observations only. Missing values are not imputed or changed to zero. The indicator uses the WHO 2006 Child Growth Standards and identifies children whose height-for-age is more than two standard deviations below the reference median.
Frequently Asked Questions
Which country had the highest modeled child stunting prevalence in 2024?
Burundi had the highest reported value at 55.3%, followed by Niger at 48.3% and Eritrea at 48.0%.
What does stunting mean in this indicator?
It is the share of children under age 5 whose height-for-age is more than two standard deviations below the WHO child growth standards median.
Are countries with no 2024 value treated as zero?
No. The 55 source-missing countries and economies remain no data and are not included as zero observations.
Is stunting the same as wasting or underweight?
No. Stunting uses height-for-age, wasting uses weight-for-height, and underweight uses weight-for-age.
Related Articles
Green Map creates custom-edited map images using open geographic data sources such as geoBoundaries, Natural Earth, OpenStreetMap, and government open data. These maps are edited visual materials, not raw data files, and are provided for education, documents, presentations, and graphic reference.