The World Bank’s 2023 merchandise-export residual indicator is close to zero for most reporting economies, but a small group stands well above the rest. Cuba has the highest reported value at 4.052%, followed by Aruba at 3.085%, the Democratic People’s Republic of Korea at 2.347%, and Colombia at 1.376%. The indicator code is TX.VAL.MRCH.RS.ZS. It measures total merchandise exports by the reporting economy minus the sum of exports to high-, low-, and middle-income economies under the World Bank classification, expressed as a percentage of total merchandise exports. The residual can include trade with unspecified partners or with economies not covered by the World Bank income classification.
That definition is important because residual does not mean an estimate of illegal trade, missing customs declarations, or a country’s trade balance. It is the portion left outside the specified income-group destination totals. In 2023, 205 of 217 countries and economies have reported values and 12 are source-missing. Among the reported observations, 88 are exactly 0.00% and 117 are greater than zero. Missing observations are kept separate from genuine zeros, because replacing missing values with zero would materially change the distribution and exaggerate the number of economies with no residual share.
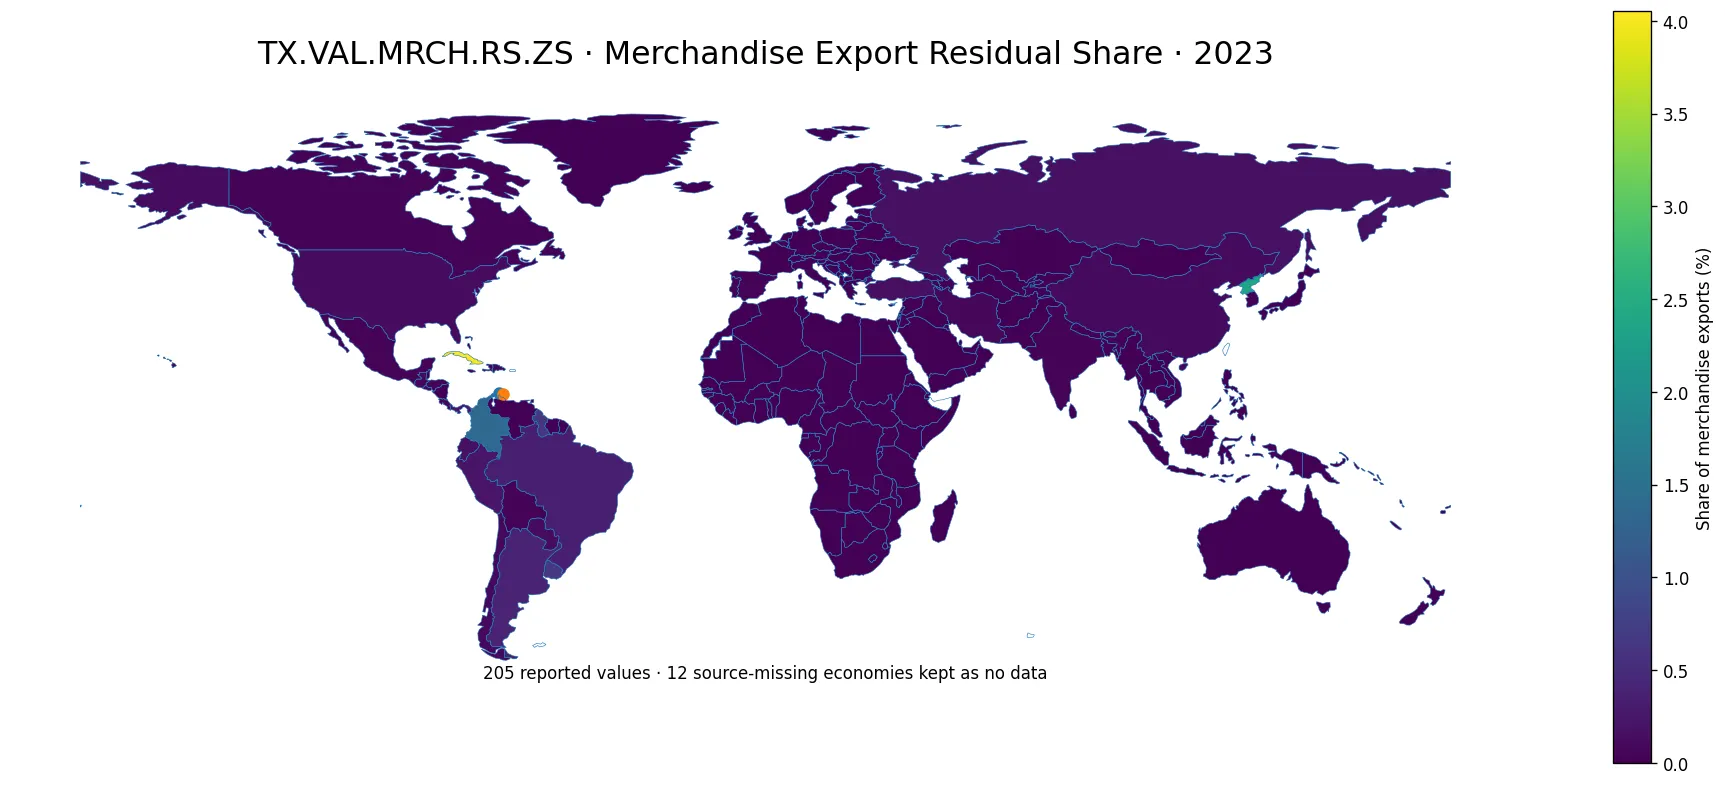
Table of Contents
Only three reporting economies exceed 2%
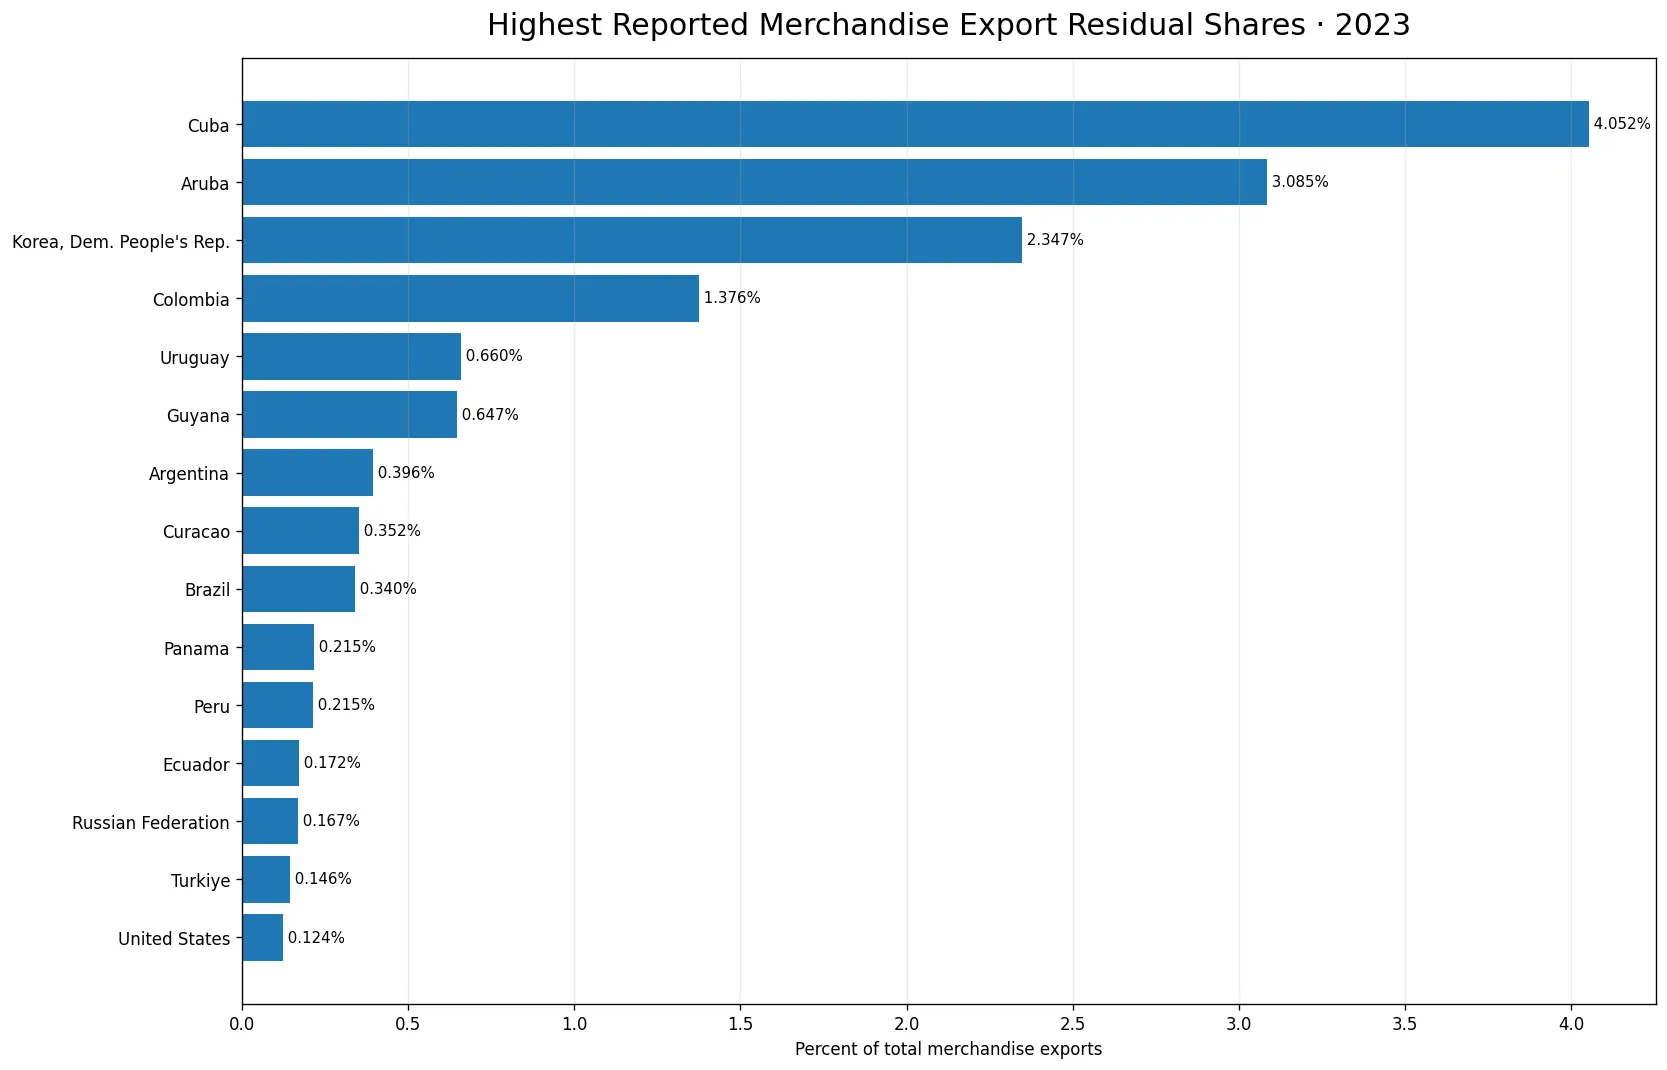
Cuba, Aruba, and the Democratic People’s Republic of Korea are the only observations above 2%. Colombia is fourth at 1.376%, and the values then fall below 1%: Uruguay records 0.660% and Guyana 0.647%. Only 4 reporting economies reach 1% or more, 6 reach at least 0.5%, and 19 reach 0.1%. This steep drop shows that the upper end is exceptional rather than typical. Even the largest value, Cuba’s 4.052%, means that more than 95% of merchandise exports are outside the residual category. A high rank therefore should not be described as most exports going to unspecified or unclassified partners.
The mean is far above the median because the distribution is strongly right-skewed
Across the 205 reported observations, the arithmetic mean is 0.077515% while the median is only 0.000485%. The first quartile is 0.000000% and the third quartile is 0.006850%. The mean is roughly 160 times the median, a clear sign that a handful of relatively large values pull the average upward. Because just 19 economies are at or above 0.1%, the middle of the distribution is concentrated at extremely small percentages. For this indicator, a simple average does not describe a typical reporting economy well. Median, quartiles, the number of exact zeros, and the size of the upper tail are all needed to understand the pattern.
Latin America and the Caribbean appear frequently in the upper group
Many of the highest values are in Latin America and the Caribbean. Cuba, Aruba, Colombia, Uruguay, Guyana, Argentina, Curacao, Brazil, Panama, Peru, and Ecuador all appear in the top fifteen. That does not mean the region as a whole has a high residual share; many other economies in the same broad region are close to zero. Nor does the pattern by itself identify a cause. The measure depends on how destination trade is allocated across World Bank income groups and on trade with unspecified or otherwise unclassified partners. Explaining why a particular economy has a higher residual would require partner-level trade records and classification detail beyond this single percentage.
| Country/economy | Residual share |
|---|---|
| Cuba | 4.052070% |
| Aruba | 3.085020% |
| Korea, Dem. People’s Rep. | 2.347321% |
| Colombia | 1.375665% |
| Uruguay | 0.660310% |
| Guyana | 0.647013% |
| Argentina | 0.395525% |
| Curacao | 0.351928% |
| Brazil | 0.339770% |
| Panama | 0.215416% |
| Peru | 0.214534% |
| Ecuador | 0.172063% |
| Russian Federation | 0.167345% |
| Turkiye | 0.145813% |
| United States | 0.124010% |
An exact zero is not the same thing as no 2023 observation
There are 88 exact zero values among the 205 reported observations. Those are valid 2023 measurements, not missing entries. By contrast, 12 countries and economies have no value for 2023. Keeping those states separate is especially important in a series where so many reported percentages are near zero. If missing observations were filled with 0%, the map and summary statistics would imply more confirmed zeros than the source actually reports. The visual therefore preserves no-data areas as missing while retaining actual zero observations in the measured distribution.
Tiny positive values should not be rounded into the zero group
Several economies have residual shares so small that they disappear when rounded to two decimal places. Angola records 0.000005%, Eswatini 0.000008%, the Democratic Republic of the Congo 0.000009%, and Chad 0.000016%. These values are economically tiny, but they are still different from exact zero in the source series. Preserving them matters for reproducible ranking, quantiles, and any later time-series comparison. The article therefore keeps the underlying precision in tables and calculations even when the narrative uses rounded figures for readability.
| Country/economy with a small positive value | Residual share |
|---|---|
| Angola | 0.000005% |
| Eswatini | 0.000008% |
| Congo, Dem. Rep. | 0.000009% |
| Chad | 0.000016% |
| Iraq | 0.000033% |
| Oman | 0.000051% |
| Congo, Rep. | 0.000145% |
| Iceland | 0.000227% |
| Nigeria | 0.000252% |
| Saudi Arabia | 0.000310% |
Residual does not measure a trade deficit or an error rate
The term residual can sound like an accounting discrepancy, but that is not the definition here. The starting point is total merchandise exports reported by an economy. The World Bank then compares that total with exports allocated to destination economies in its high-, low-, and middle-income classifications. The difference is the residual share. It can capture trade with unspecified partners or economies outside those classifications. It is unrelated to the trade balance, which compares exports with imports, and it is not a measure of customs noncompliance, smuggling, or statistical quality. A high value should therefore be described only in terms of the destination-classification residual unless additional evidence is available.
The percentage does not reveal the absolute value of residual exports
A percentage normalizes for each economy’s total merchandise exports, which is useful for structural comparison. But equal percentages can represent very different monetary amounts. A 0.2% residual in a very large exporting economy may correspond to more dollars than a 1% residual in a small exporter. The reverse can also occur. To estimate the monetary size of residual exports, this indicator would need to be combined with a compatible total merchandise-exports series for the same year. The present comparison answers a narrower question: what share of each reporting economy’s merchandise exports falls outside the specified World Bank income-group destination totals?
The 2023 snapshot should not be treated as a permanent trade characteristic
These rankings describe one year. Partner reporting, trade routes, destination coding, and the set of economies covered by an income classification can change over time. An economy that appears high in 2023 may not remain high in earlier or later years. A trend analysis should therefore follow the same TX.VAL.MRCH.RS.ZS indicator across years and check coverage separately for each period. Comparing a single-year residual share with a different trade indicator would not measure the same concept, even if both use merchandise exports as the denominator.
Source and calculation method
The source is World Bank indicator TX.VAL.MRCH.RS.ZS for 2023, expressed as a percentage of total merchandise exports. World Bank aggregate groups are excluded from the country-and-economy comparison. There are 217 country/economy rows, of which 205 contain reported 2023 values. The mean of 0.077515%, median of 0.000485%, quartiles, thresholds, and rankings are calculated from those reported observations. The 12 source-missing observations are not imputed, and the 88 genuine zero values remain part of the distribution. The map and top-fifteen chart use the same 2023 values.
Frequently Asked Questions
Which economy had the highest merchandise export residual share in 2023?
Cuba had the highest reported value at 4.052%, followed by Aruba at 3.085%.
What does the merchandise export residual share measure?
It is the share left after exports to World Bank high-, low-, and middle-income destination groups are subtracted from total merchandise exports. It can include unspecified partners or economies outside those classifications.
Does a high residual share mean unreported or illegal exports?
No. The indicator does not measure customs noncompliance, smuggling, or missing declarations. It is a destination-classification residual.
Were missing 2023 values treated as zero?
No. The 12 source-missing observations remain no data and are kept separate from the 88 genuine zero values.
Related Articles
Green Map creates custom-edited map images using open geographic data sources such as geoBoundaries, Natural Earth, OpenStreetMap, and government open data. These maps are edited visual materials, not raw data files, and are provided for education, documents, presentations, and graphic reference.