Hawaii overwhelmingly led U.S. state consumption of petroleum liquids in the Electric Power sector in 2024 when electricity generation and useful thermal output are combined. The EIA value for Hawaii was 11,870.815 thousand barrels, followed by Alaska at 1,654.718, Maryland at 802.501, New York at 554.722, and Missouri at 434.068 thousand barrels. The 50 state observations sum to 20,872.145 thousand barrels, and Hawaii alone represents 56.87% of that total. The series is defined by fueltypeid=PEL, sectorid=98, field=total-consumption, annual frequency, and 2024. PEL means Petroleum Liquids. The total-consumption field combines fuel assigned to electricity generation with fuel assigned to useful thermal output, so this is broader than an electricity-generation-only consumption measure.
Several distinctions are essential for reading the ranking correctly. Petroleum Liquids is a specific EIA fuel category and should not be treated as interchangeable with a broader Petroleum category. The values are physical quantities in thousand barrels, not megawatthours of electricity, fuel costs, emissions, efficiency measures, or percentages of each state’s generation mix. They are also absolute totals rather than per-capita or per-household values. A large state observation therefore answers a narrow question—how much petroleum-liquid fuel was consumed within this Electric Power definition—not whether the state’s power system was more dependent on petroleum than another state’s.
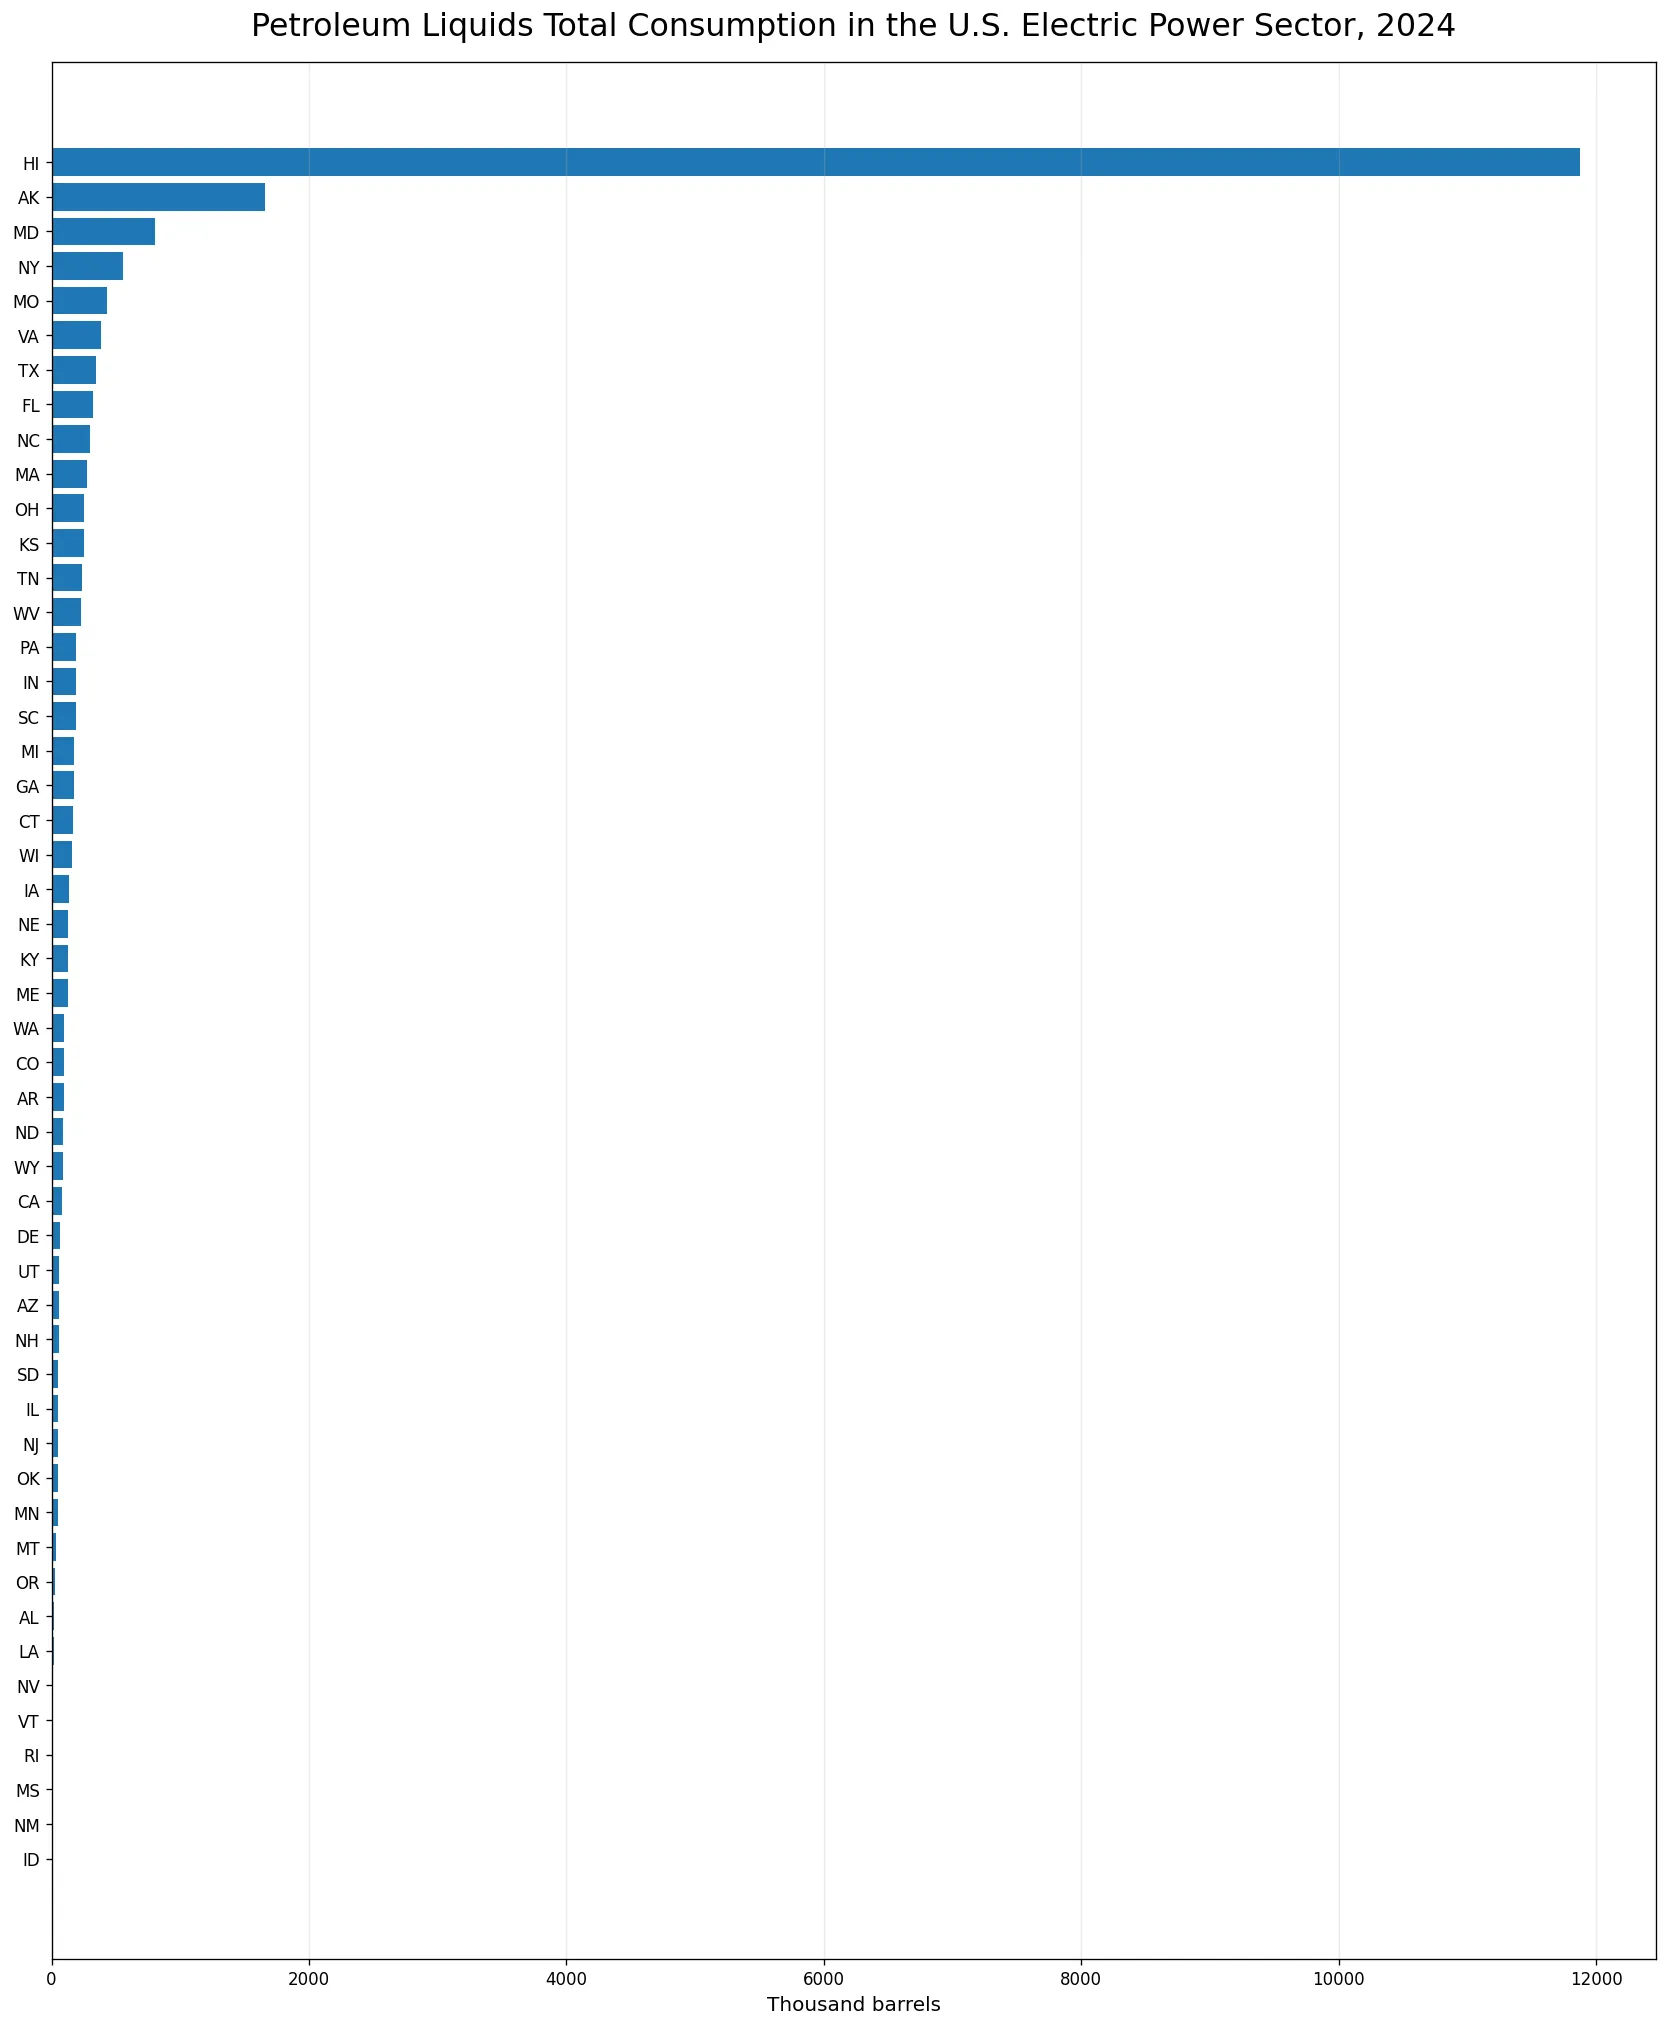
Table of Contents
Hawaii alone accounts for 56.87% of the 50-state total
Hawaii’s 11,870.815 thousand barrels equal 56.87% of the sum of all 50 state observations. Alaska contributes 7.93% and Maryland 3.84%. The first three states together account for 68.65% of the total, the first five for 73.38%, and the first ten for 81.18%. This degree of concentration is the defining feature of the distribution. Hawaii is more than seven times Alaska and more than one hundred times the median state. When one observation is this dominant, the arithmetic mean ceases to be a good description of a typical state because it is pulled upward by the extreme upper tail.
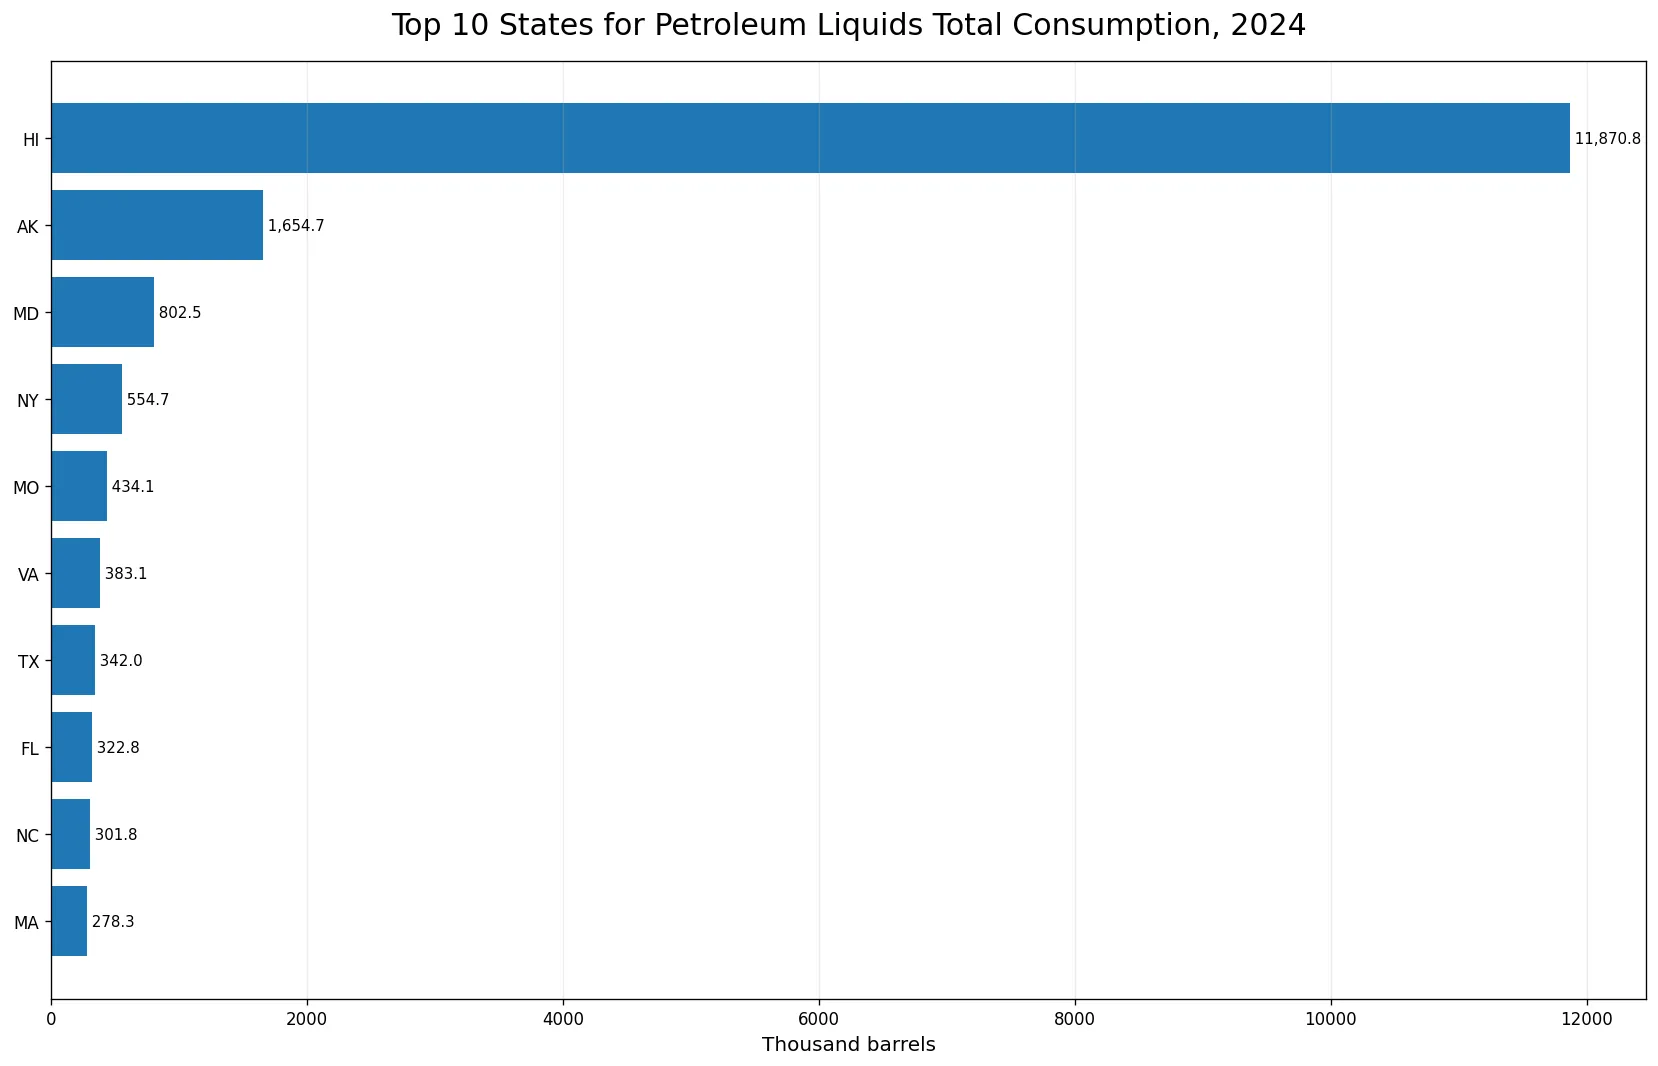
Alaska and Maryland form a distant second tier
Alaska ranks second at 1,654.718 thousand barrels and Maryland third at 802.501. New York follows at 554.722, with Missouri at 434.068. Virginia, Texas, Florida, North Carolina, and Massachusetts complete the top ten. The gap between Hawaii and Alaska is much larger than the gaps among most of the next several states. This creates a two-part visual pattern: one extreme leader and a much more compressed group below it. A top-ten view therefore adds useful context to the full 50-state chart. The full chart preserves the actual magnitude of Hawaii’s lead, while the focused chart makes the ordering and spacing among the next states easier to read.
| State | Total consumption (thousand barrels) | Share of 50-state sum |
|---|---|---|
| Hawaii | 11,870.815 | 56.87% |
| Alaska | 1,654.718 | 7.93% |
| Maryland | 802.501 | 3.84% |
| New York | 554.722 | 2.66% |
| Missouri | 434.068 | 2.08% |
| Virginia | 383.092 | 1.84% |
| Texas | 342.047 | 1.64% |
| Florida | 322.791 | 1.55% |
| North Carolina | 301.835 | 1.45% |
| Massachusetts | 278.270 | 1.33% |
The median is only about one-quarter of the mean
The arithmetic mean across the 50 states is 417.443 thousand barrels, while the median is 111.823. The first quartile is 52.167 and the third quartile is 236.931 thousand barrels. That difference between the mean and median shows how strongly the upper tail affects a simple average. Half of the states are at or below about 112 thousand barrels, and the middle half of the distribution lies roughly between 52 and 237 thousand barrels. Using the mean alone would make a typical state appear much larger than it actually is. Median and quartile values are more informative when the distribution contains a very large outlier such as Hawaii.
Every state has a positive observation
The 2024 series contains 0 missing values and 0 exact zeros. All 50 states therefore have positive published observations. Idaho is the smallest at 0.083 thousand barrels, followed by New Mexico at 2.011, Mississippi at 9.613, Rhode Island at 10.001, and Vermont at 11.542 thousand barrels. These very small numbers are still real observations. They should not be treated as missing or rounded to zero. The distinction matters because a source-missing state would need to remain separate from a state with a genuine low value. Here the state coverage is complete, so the ranking does not mix observed values with imputed ones.
| Lowest-value state | Total consumption (thousand barrels) |
|---|---|
| Idaho | 0.083 |
| New Mexico | 2.011 |
| Mississippi | 9.613 |
| Rhode Island | 10.001 |
| Vermont | 11.542 |
| Nevada | 12.557 |
| Louisiana | 18.310 |
| Alabama | 19.213 |
| Oregon | 23.643 |
| Montana | 37.690 |
Petroleum Liquids is not the same fuel category as broader Petroleum
Within EIA electricity statistics, Petroleum Liquids and Petroleum are separate fuel selections. Two articles can therefore use the same year, the same Electric Power sector, and the same physical unit while still describing different quantities. The 2024 PEL series shown here sums to about 20.87 million barrels across the 50 states, with Hawaii representing 56.87%. A broader Petroleum series can have a different total, a different set of leading states, and a different concentration pattern because the fuel selection is not identical. This is why the fuel facet should be checked before treating similarly titled petroleum-consumption comparisons as duplicates.
Total consumption combines electricity generation and useful thermal output
The selected field is total-consumption. It combines petroleum-liquid fuel assigned to electricity generation with petroleum-liquid fuel assigned to useful thermal output. This makes it broader than an electricity-generation-only consumption field. Useful thermal output matters for facilities that produce usable heat as part of their operation, including combined heat and power arrangements. However, the state values should not be read as total heating demand or total industrial heat use. The boundary remains the EIA Electric Power sector. Petroleum liquids used in transportation, building heating outside this scope, or other sectors of the state economy are not represented by this measure.
Absolute consumption and petroleum dependence are different questions
A state can rank high in absolute petroleum-liquid consumption without having the highest petroleum share of its power system. Dependence is a ratio question and needs a denominator, such as total fuel input or total electricity generation. A large power system can consume more petroleum liquids in absolute terms while still relying on them for only a small part of its overall activity. A smaller system can show the opposite pattern. The 2024 values therefore support statements about physical fuel volume, not about relative dependence, efficiency, or the share of electricity produced from petroleum.
Hawaii’s outlier value changes how the full chart should be read
Because Hawaii is so far above the rest, a single linear-axis chart compresses many middle and lower observations into a narrow visual range. Removing Hawaii would make those differences easier to see but would hide the most important feature of the distribution. The two-chart approach keeps the extreme value in the full state comparison and then provides a second view of the leading ten states. This avoids changing the scale or trimming the upper tail simply for visual convenience. It also makes the underlying conclusion transparent: the 2024 distribution is genuinely concentrated rather than an artifact of presentation.
What the 2024 distribution establishes
The direct findings are straightforward. Hawaii is the largest state by a wide margin, the first ten states account for 81.18% of the 50-state sum, the median is 111.823 thousand barrels, and every state has a positive observation. Those facts describe the cross-section for one year. They do not establish why Hawaii is so high, whether petroleum-liquid use is rising or falling, or whether one state’s power system is more efficient than another. Answering those questions would require consistent time series or additional generation, capacity, fuel-mix, cost, and operational variables. Any year-over-year comparison should keep the same PEL fuel facet, sector 98, total-consumption field, frequency, and unit.
Source and calculation method
The source is the U.S. Energy Information Administration electricity/electric-power-operational-data annual series. The comparison uses the 2024 observations for fueltypeid=PEL (Petroleum Liquids), sectorid=98 (Electric Power), field=total-consumption, measured in thousand barrels. The total of 20,872.145, mean of 417.443, median of 111.823 thousand barrels, quartiles, rankings, and state shares were calculated directly from the 50 published state observations. No observation was imputed, no missing value was replaced with zero, and no other year was mixed into the calculations. If EIA later revises the 2024 values, the same series definition can be used to refresh the comparison.
Frequently Asked Questions
Which state had the highest petroleum-liquids total consumption in 2024?
Hawaii ranked first at 11,870.815 thousand barrels, equal to 56.87% of the 50-state sum.
Does total-consumption mean electricity generation only?
No. It combines petroleum-liquid fuel assigned to electricity generation with fuel assigned to useful thermal output.
Are Petroleum Liquids and Petroleum the same EIA fuel category?
No. They are different fuel selections, so totals and state rankings can differ even for the same year and sector.
Are any state observations zero or missing?
No. All 50 states have positive 2024 observations in this series.
Related Articles
Green Map creates custom-edited map images using open geographic data sources such as geoBoundaries, Natural Earth, OpenStreetMap, and government open data. These maps are edited visual materials, not raw data files, and are provided for education, documents, presentations, and graphic reference.