Campbell County occupies Kentucky’s northern edge, where compact Ohio River communities give way to a longer belt of hills, creek valleys, and more widely spaced roads around Alexandria and farther south. Newport, Fort Thomas, Dayton, and Bellevue sit close together near the river, while Cold Spring and Alexandria become useful reference points as the county opens out inland. The maps on this page focus on that contrast rather than treating the county as one uniform landscape.
You can view the maps online or download the original high-resolution JPG files for printing and closer inspection. The general county map is best for roads and place names, the city map simplifies the main population centers, the water map highlights the Ohio and Licking rivers plus interior creeks, and the elevation map shows how quickly the land rises away from the river corridors. Together they provide a practical way to understand Campbell County without relying on a single crowded image.
Table of Contents
From Newport’s riverfront to Alexandria’s wider hill country
The strongest visual concentration in Campbell County is at the northern end. Newport lies near the Ohio River and the mouth area of the Licking River, with Fort Thomas immediately to the east on higher ground. Bellevue and Dayton are also close to the Ohio River, while Southgate and Wilder sit just south of the tightest urban cluster. On the map, these names and roads occupy a small area and create a much denser pattern than anything seen in the southern half of the county.
Moving south changes the map quickly. Highland Heights and Cold Spring form a transition between the northern communities and Alexandria, after which towns are farther apart and state routes spread across a much larger area. Around Alexandria, the road network fans toward several directions instead of remaining packed into a riverfront street grid. Farther south, creeks, ridges, and route numbers become more useful location clues than a continuous sequence of city names.
The county’s shape reinforces that difference. Campbell County is long from north to south, and its eastern edge follows broad bends of the Ohio River. Looking only at Newport and Fort Thomas can make the county seem much smaller than it is. Once Alexandria and the southern hills are included, the full north-south reach becomes clear. The winding river boundary also explains why routes near the eastern side do not form a simple straight corridor.
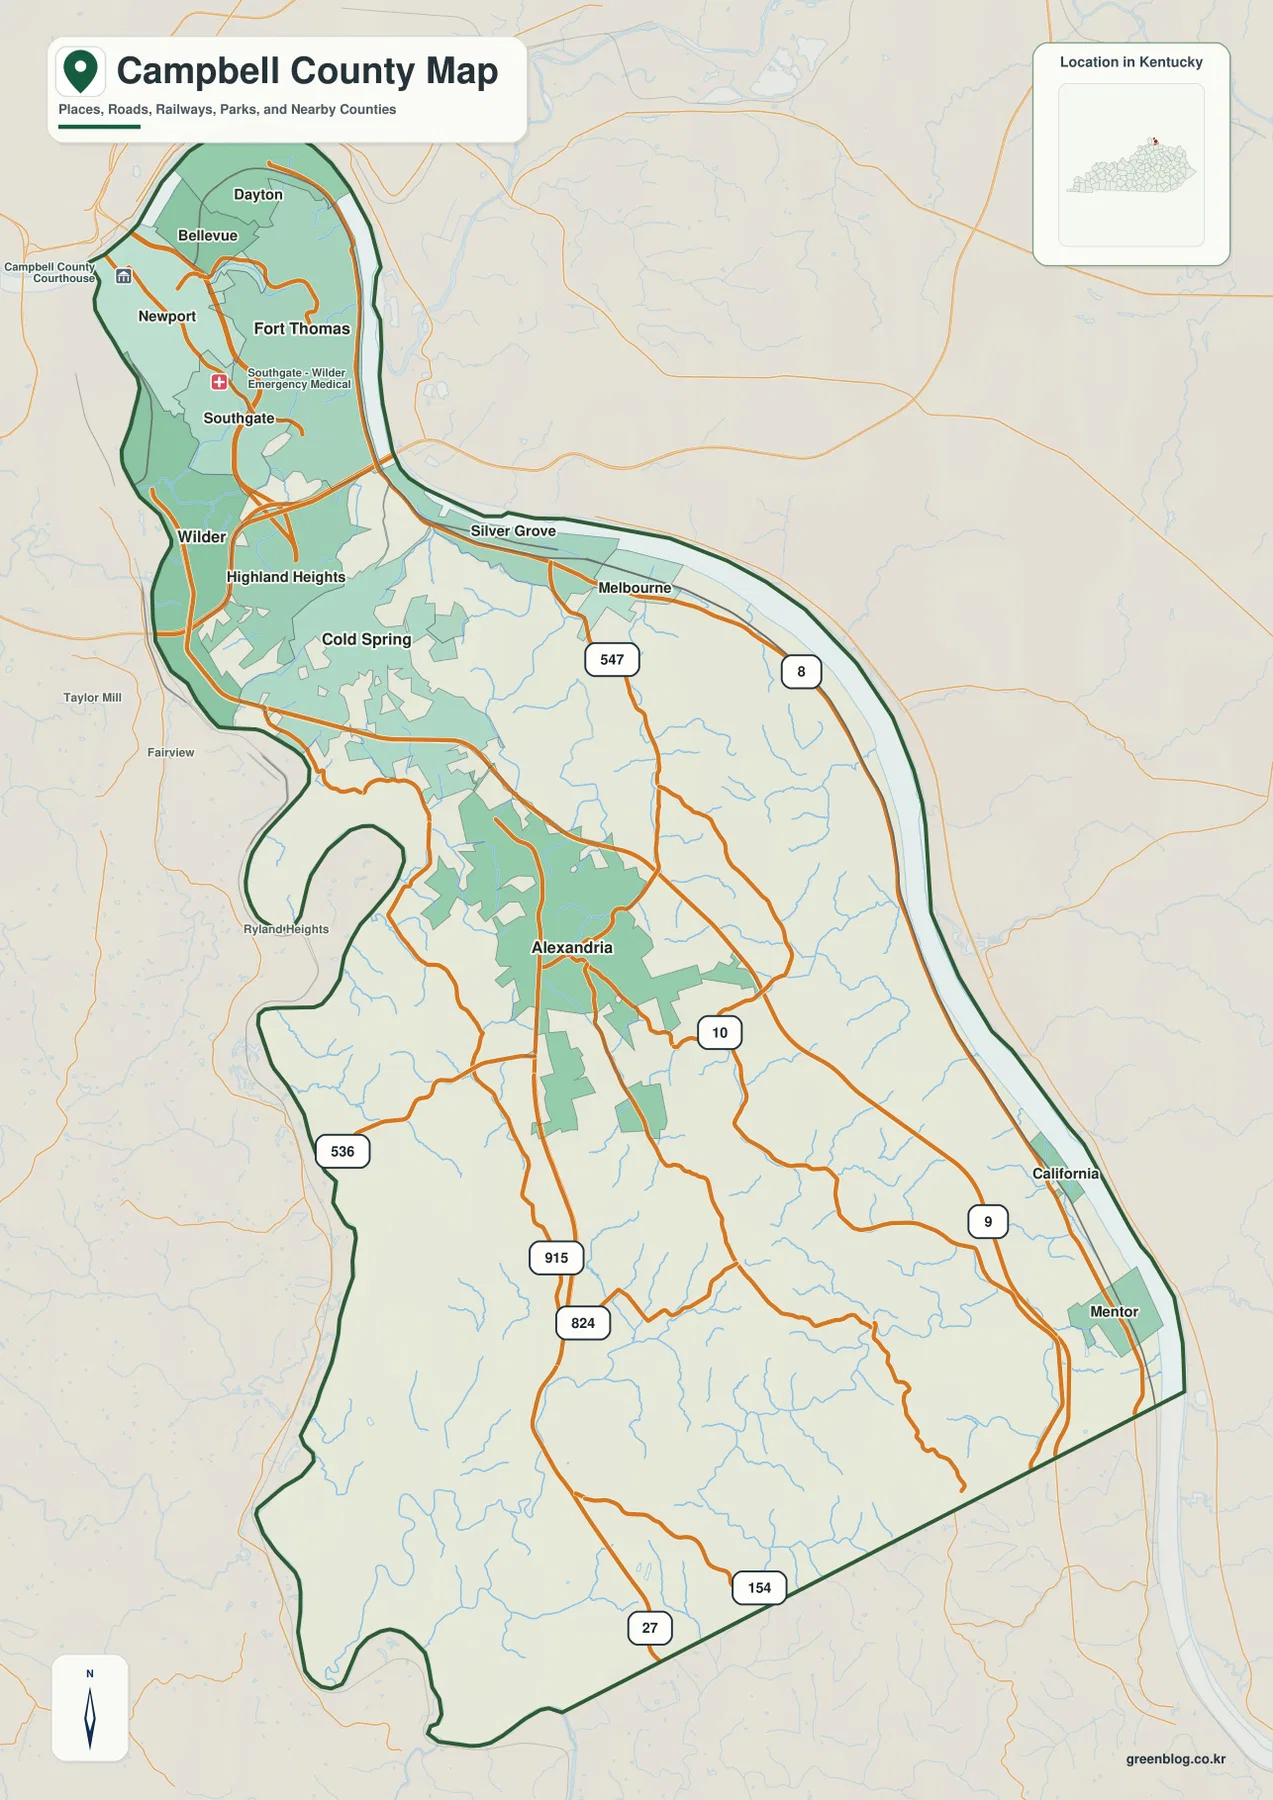
The general map is especially useful for seeing how the Ohio River communities relate to the interior. Newport, Fort Thomas, Bellevue, Dayton, Highland Heights, and Cold Spring appear close together, while Alexandria stands apart in the central part of the county. Smaller places such as Silver Grove, Melbourne, California, and Mentor help trace the eastern river side. Their positions show that Campbell County is not simply a north-south strip centered on one road; the river creates a curving edge with communities tucked between the water and the hills.
Campbell County also has an unusual administrative detail that makes Newport and Alexandria both worth noticing. Kentucky state information lists both cities as county seats. Newport remains an obvious northern landmark within the urban riverfront, while Alexandria is the key central reference for the more open southern portion of the county. Seeing both on the same map helps explain why public services and local identity are not concentrated in only one part of the county.
US 27 links the northern city cluster with Cold Spring and Alexandria
US 27 is the easiest route to use as a north-south guide through Campbell County. It runs from the northern urban area toward Highland Heights, Cold Spring, and Alexandria, continuing toward the southern county line. Not every community sits directly on the highway, but it provides a simple backbone for understanding where the major places lie. When a reader first encounters a county with many short state routes, starting with US 27 keeps the geography manageable.
KY 8 and KY 9 add another layer along the river side. KY 8 follows portions of the Ohio River corridor near several northern communities, while KY 9 provides an important connection on the eastern side of the urban area. Around Alexandria, routes such as KY 10, KY 547, KY 915, and KY 824 branch into surrounding hill country. The road pattern there is less about a dense urban grid and more about reaching communities and valleys separated by rolling terrain.
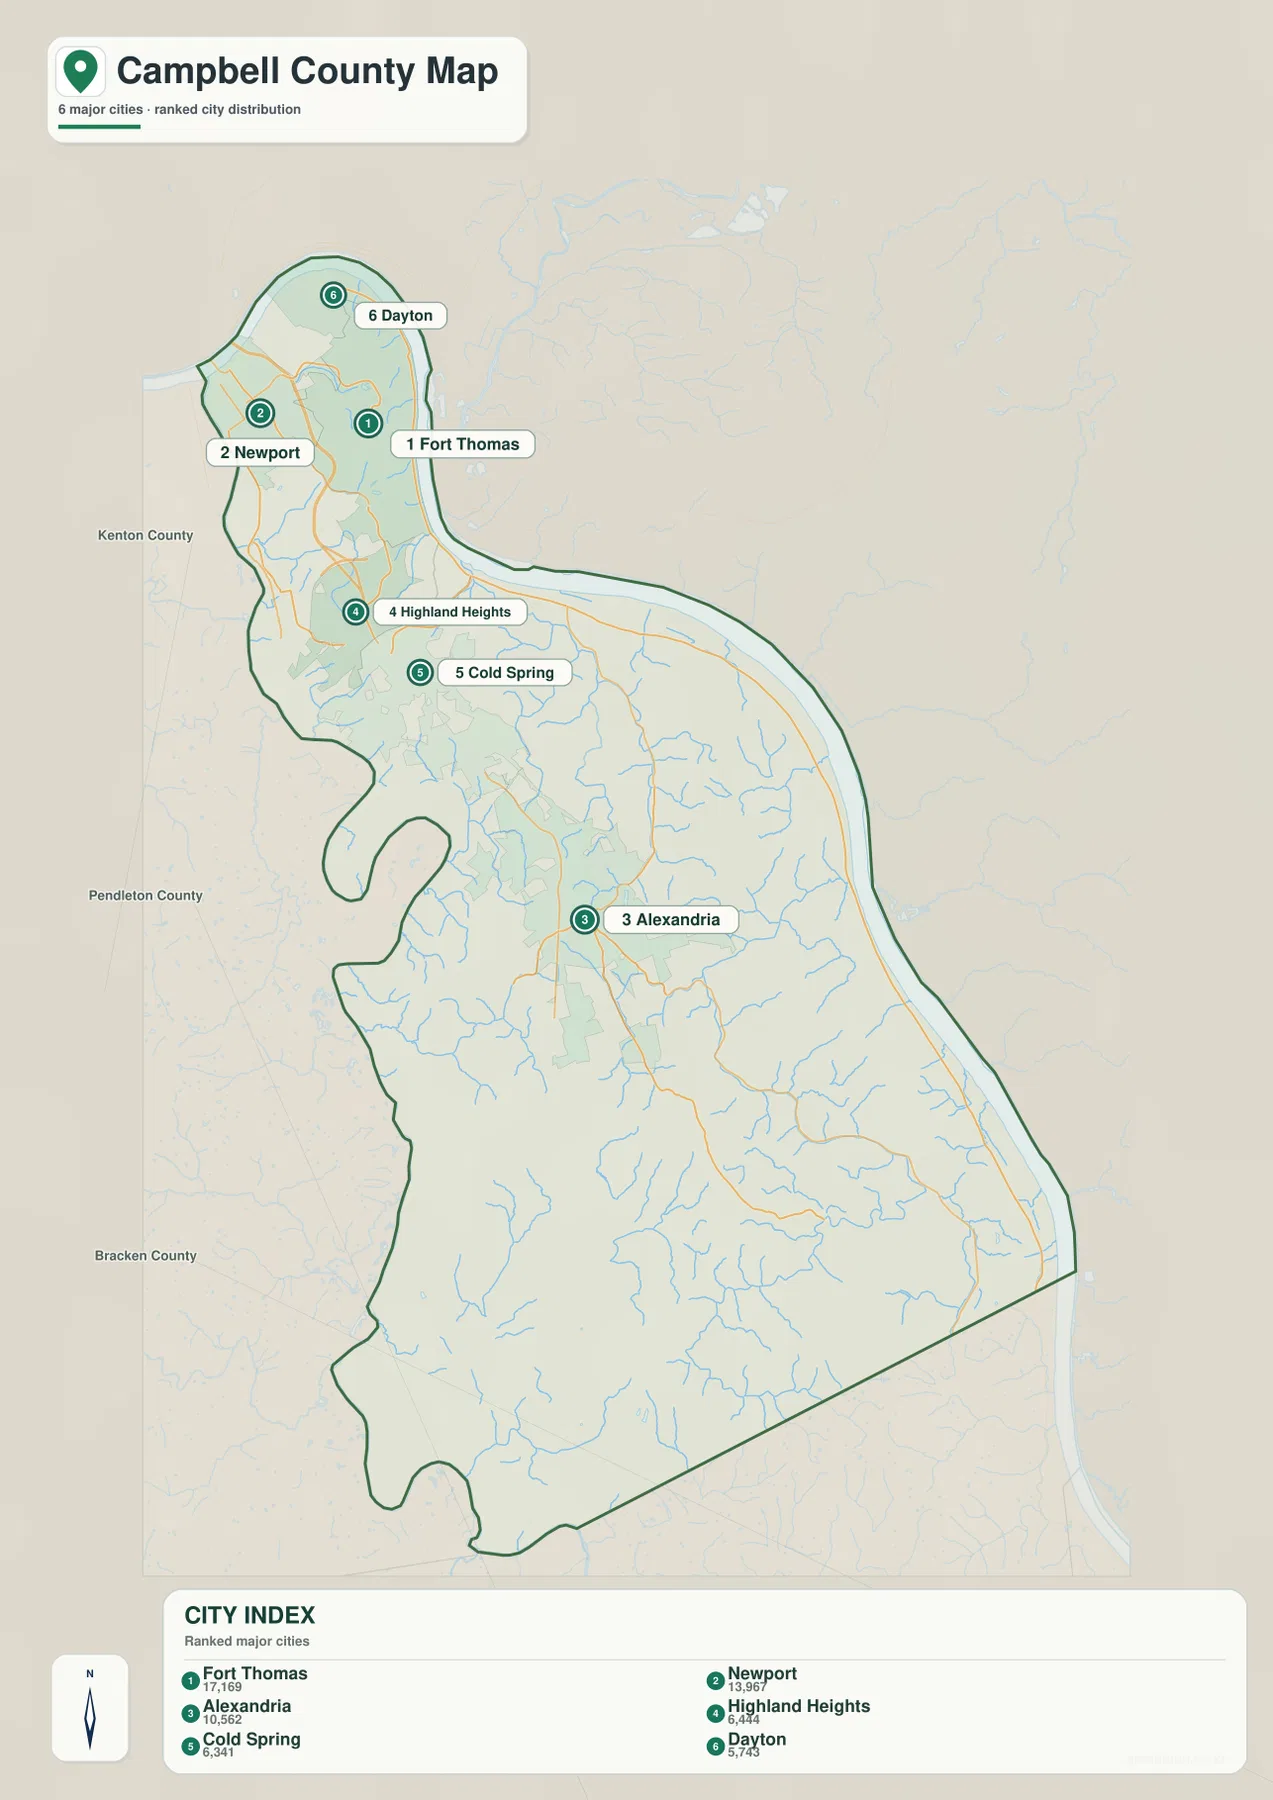
The city map makes the settlement pattern even clearer because it reduces visual clutter. Fort Thomas, Newport, and Dayton are grouped near the top of the county, with Highland Heights and Cold Spring just to the south. Alexandria is noticeably farther away in the central section. That spacing matters when explaining the county to someone unfamiliar with northern Kentucky: the urbanized northern end and the more open interior are not just different neighborhoods of the same city, but distinct parts of a long county.
This simplified map works well for presentations, school work, or a quick location check. If the question is simply where Newport sits in relation to Alexandria, the city map answers it faster than a road-heavy map. If the question changes to which route connects them or how to reach a smaller place along the river, return to the general county map. Using the two together avoids forcing one map to carry every type of information.
The northern cluster also reflects the county’s position opposite Cincinnati and along two major rivers, but the map should not be read as a current commuting or traffic model. It does not show travel times, congestion, or public transportation schedules. Its value is more basic and more durable: it shows where the principal communities are, how close they are to the rivers, and which routes provide the main geographic connections inside the county.
The Ohio and Licking rivers frame a network of smaller creeks
The Ohio River is the dominant water feature around Campbell County. It follows the northern and eastern edge of the county in broad bends, creating a clear boundary that is easy to recognize on the water map. The Licking River appears at the northwest side near Newport and provides another major reference for the northern city cluster. These large rivers help orient the map before the many smaller interior streams are considered.
Inside the county, the water network becomes much finer. Fourmile Creek, Brush Creek, Pond Creek, Twelvemile Creek, Phillips Creek, and Plum Creek occupy valleys between the hills. The Alexandria Reservoirs stand out near the central part of the county, while Newport Reservoir and Joes Lake add smaller named water features in the north. These details are much easier to see on the water map than on the general road map.
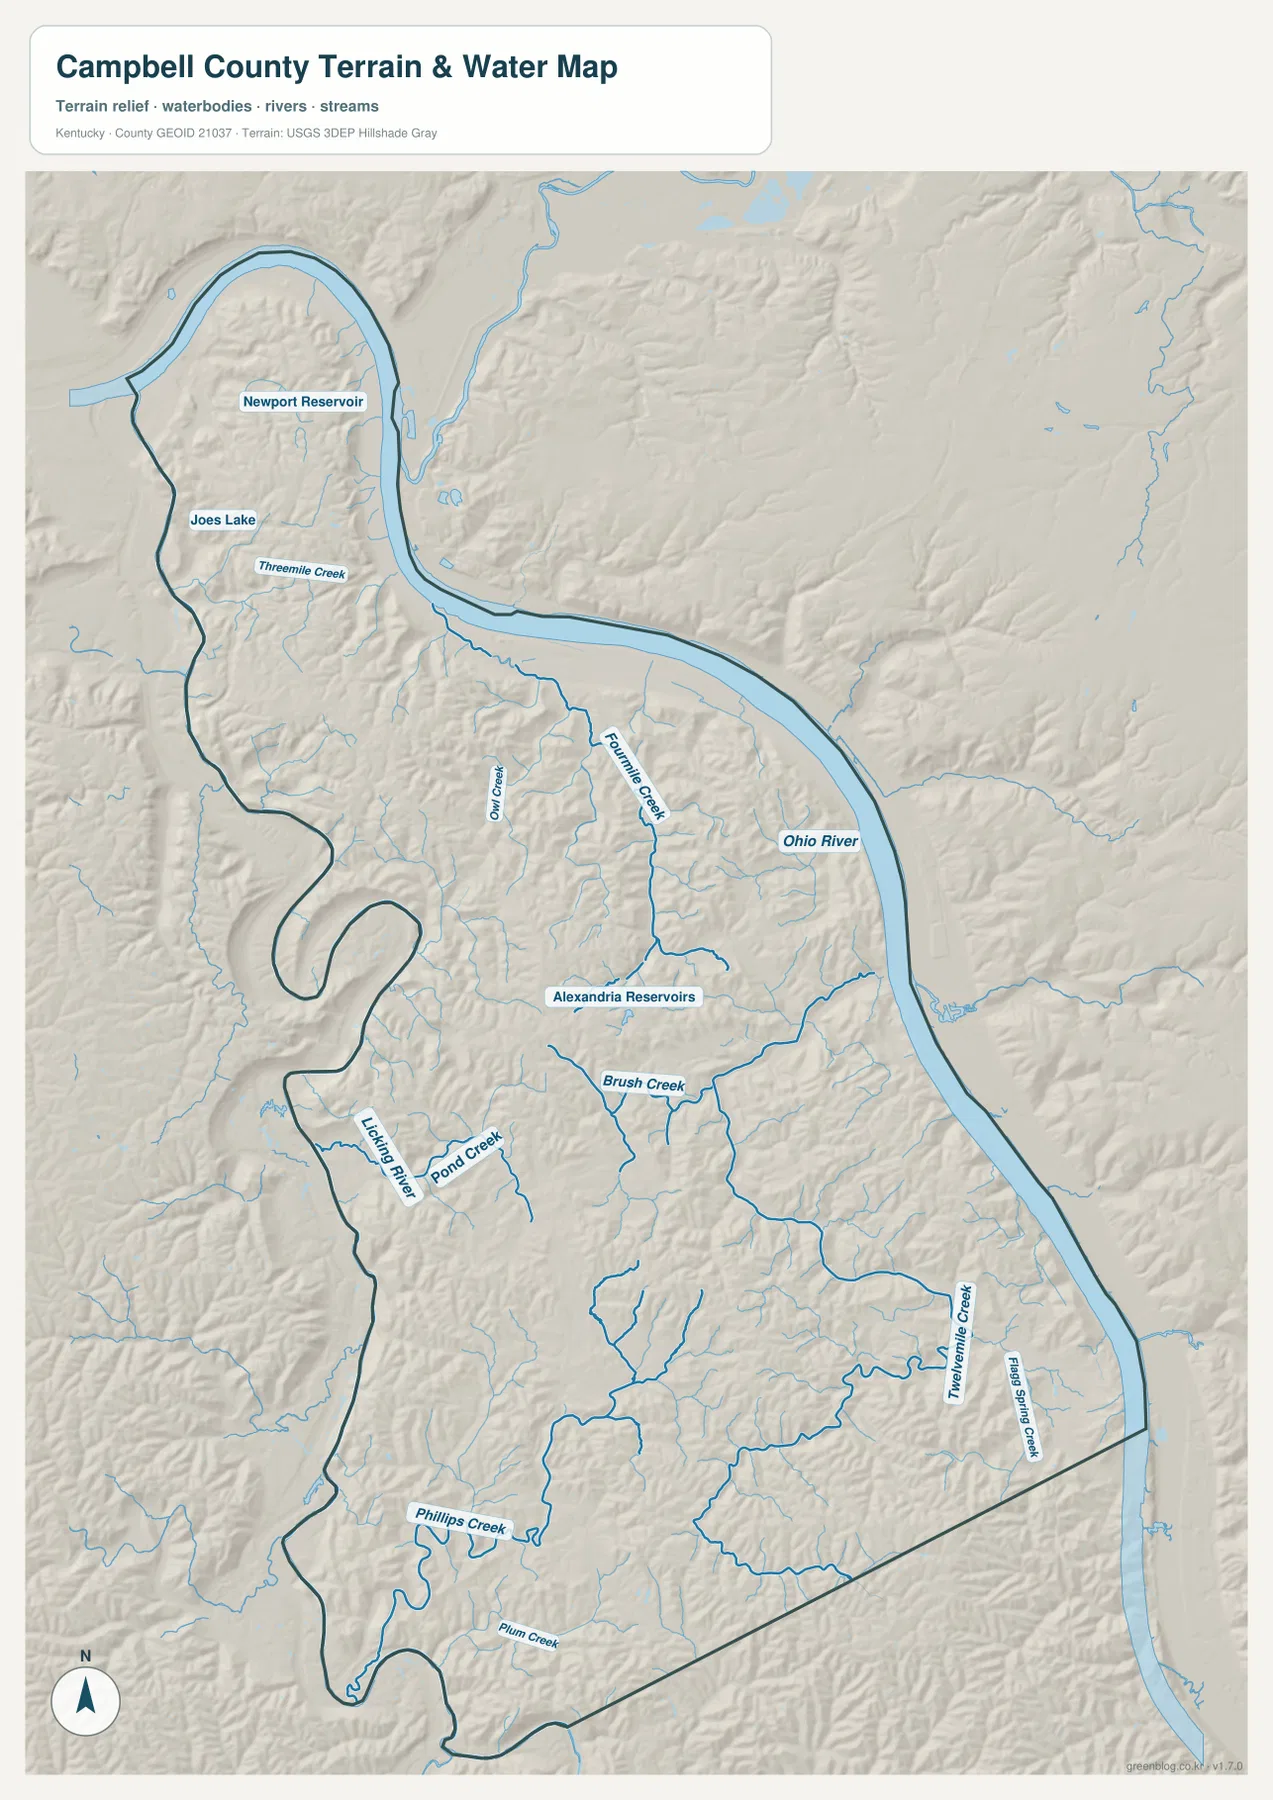
The shape of those creeks reflects the terrain. They rarely cross the county in straight lines. Instead, they curve through lower valleys between ridges, often changing direction as the land rises around them. Comparing Brush Creek or Pond Creek with the elevation map makes this relationship easy to see. The same pattern appears farther south, where Phillips Creek and Plum Creek follow elongated low areas through more sparsely settled hill country.
The Ohio River side also changes character from north to south. Newport and Dayton sit in a densely developed riverfront setting, but farther east and south the map shows smaller places such as Silver Grove, Melbourne, and California between the river and higher ground. Looking at the water map beside the general map helps show where roads approach the river, where they turn inland, and where creeks cut through the hills before reaching larger waterways.
This water map is a geographic reference, not a flood or navigation product. It does not show current river stage, flood insurance zones, water quality, boat restrictions, or fishing rules. Anyone making a safety, property, or recreational decision should consult the relevant current agency information. For this page, the map is best used to identify named waterways and understand how river and creek valleys fit into the county’s larger layout.
A 141–282 meter range separates low river corridors from interior ridges
The elevation map shows Campbell County ranging from about 141 meters to 282 meters, with an average near 210 meters. Those numbers do not suggest a mountain landscape, but the map still shows a great deal of local relief. Low green areas follow the Ohio River and many creek valleys, while yellow-brown and brown areas mark higher ridges only a short distance inland. The frequent change between low and high ground is one of the county’s most important physical characteristics.
Newport and Fort Thomas illustrate the contrast well. Riverfront land near Newport is relatively low, yet higher ground rises quickly toward Fort Thomas and other nearby neighborhoods. Two places can appear close together in plan view while the road between them climbs, descends, or curves around a ridge. That is one reason the northern urban area can feel more topographically varied than a simple city map suggests.
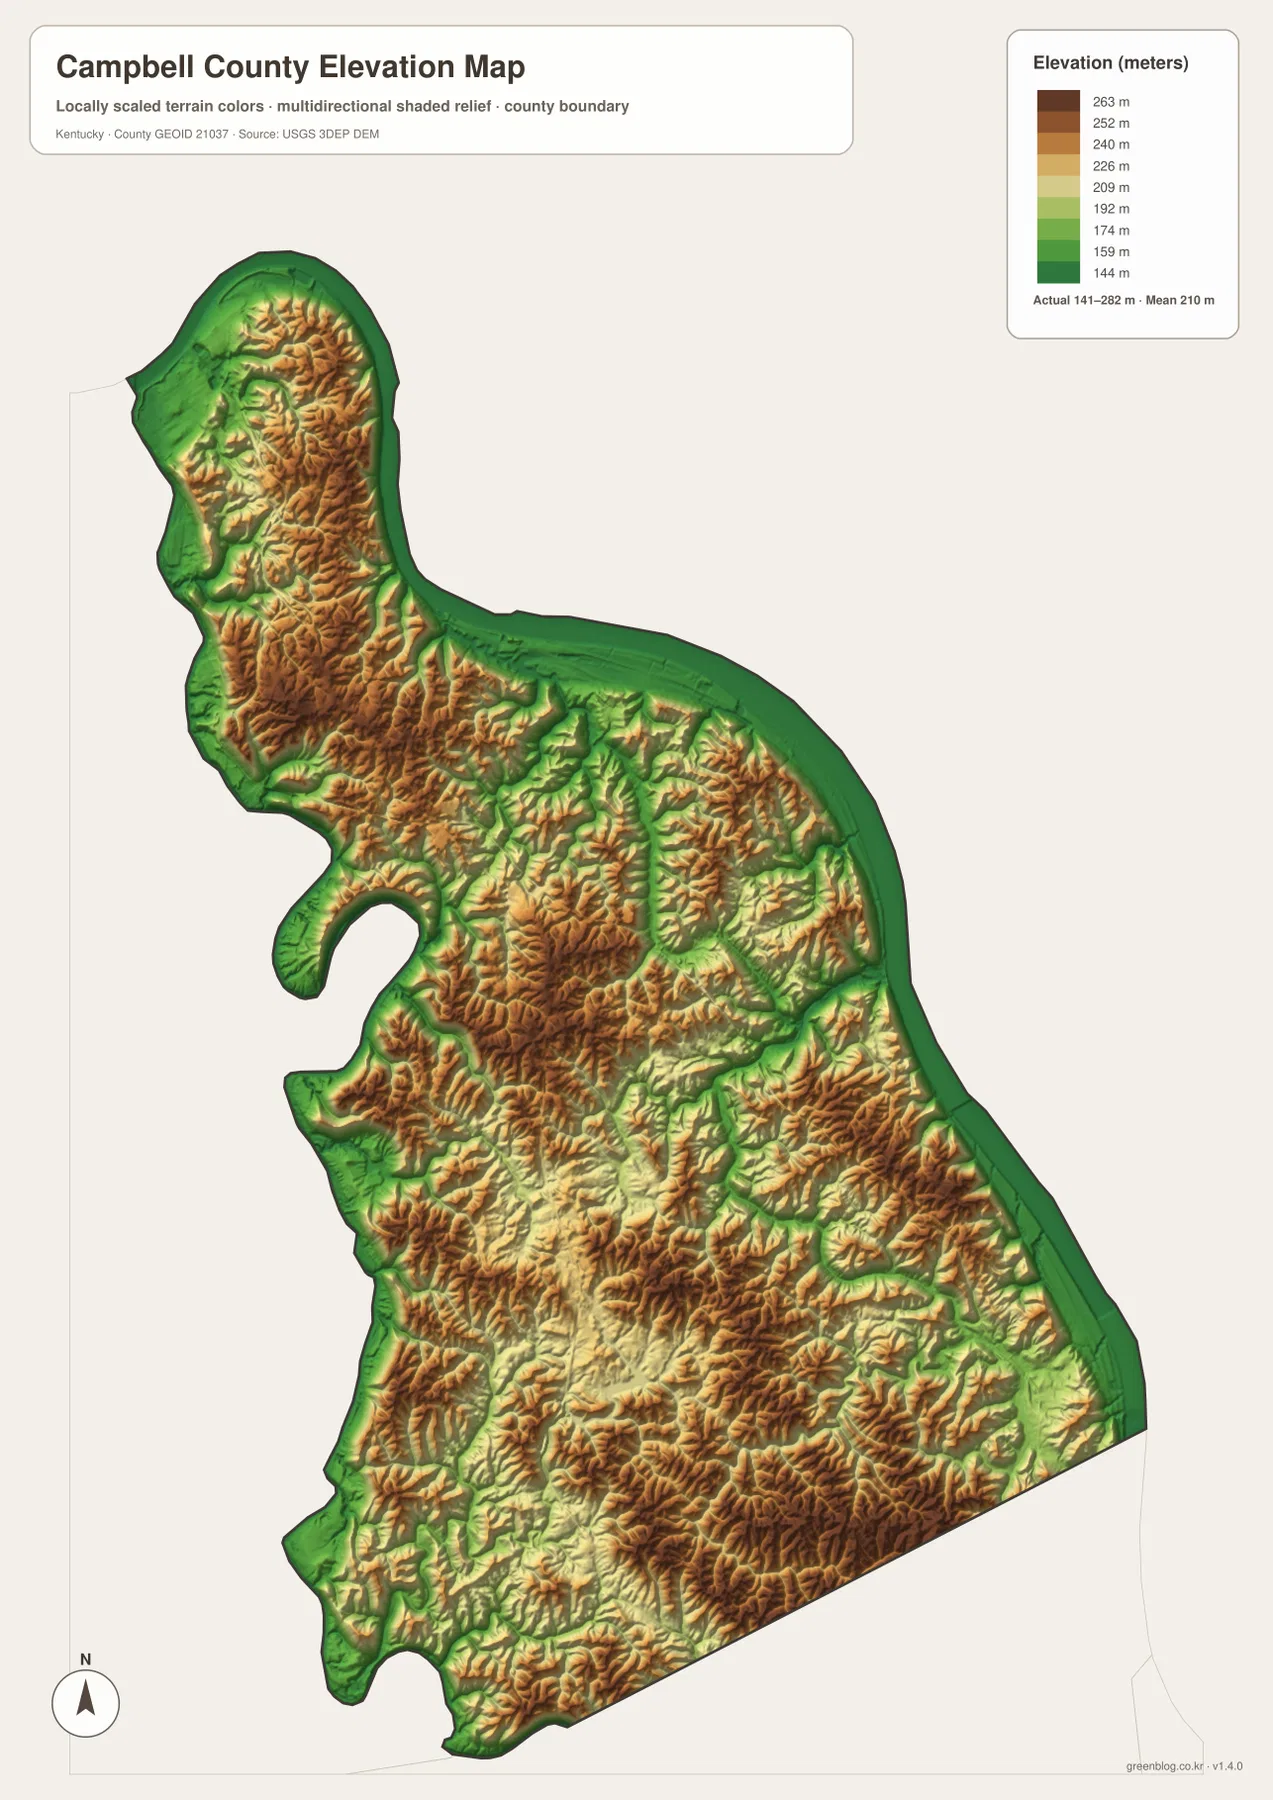
Around Alexandria and farther south, the same hill-and-valley pattern spreads across a larger area. Green corridors mark lower ground along streams, and branching ridges occupy the land between them. Fourmile Creek, Brush Creek, and Pond Creek make more sense when viewed against this terrain because their winding courses follow the easier low routes through the hills. Along the eastern edge, elevation drops again toward the Ohio River, producing a lower strip beside the water.
The elevation map is especially helpful where the city map becomes sparse. Southern Campbell County has fewer large place names, so ridges, creek valleys, and state routes become the main geographic clues. Reading the terrain with the general map can explain why local roads bend and why some direct-looking connections are not straight on the ground. The county’s relief is modest by mountain standards, but it is strong enough to shape both drainage and road alignment.
These colors are intended for county-scale comparison, not site-level measurement. They should not be used to determine the exact elevation of a house lot, a construction grade, drainage design, or a property survey. Detailed work requires source elevation data or professional measurements. Here, the map is most useful for comparing the low Ohio and Licking river corridors with the higher interior ridges and the creek valleys cut between them.
Choose the map that matches the question you need to answer
Start with the general county map when you need a broad orientation. It combines Newport, Fort Thomas, Cold Spring, Alexandria, smaller communities, and the principal numbered routes in one view. That makes it the best choice for explaining how the county fits together or for locating a place before turning to a more specialized map. It is also the most practical version when road names and community labels matter at the same time.
Use the city map when the main question is settlement rather than transportation. It quickly shows the northern cluster and Alexandria’s more separate central position without surrounding every label with route information. For a classroom slide or a simple regional comparison, that cleaner layout can be easier to read. When a smaller community or a specific road becomes important, the general map can then provide the missing detail.
The water map is the clearest choice for the Ohio River, Licking River, interior creeks, and reservoirs. The elevation map adds the reason those streams and roads often curve: lower valleys thread between higher ridges. Pairing those two maps is useful for physical geography, while pairing the general and water maps is better for seeing where roads cross or follow creek corridors. Because all versions use the same county outline, switching between them is straightforward.
The downloadable originals are portrait-oriented JPG files at 2572 × 3638 pixels. Their larger size makes labels, smaller streams, and elevation colors easier to inspect than on a web preview. They work well for personal study, classroom material, printed reference sheets, and presentations about Campbell County. They are not replacements for legal boundary records, engineering drawings, flood determinations, or live navigation.
For a quick workflow, begin with the general map to establish Newport, Fort Thomas, Cold Spring, Alexandria, and US 27. Add the city map if you need a cleaner explanation of where people are concentrated, then use the water or elevation map only if the topic requires physical geography. This approach keeps the final presentation readable while still using the detailed information available in the full map set.
Frequently Asked Questions
Why do both Newport and Alexandria matter on a Campbell County map?
Newport is a major reference point in the dense northern riverfront, while Alexandria is the clearest central reference for routes leading into the southern half of the county. Kentucky state information lists both as county-seat cities. Looking at both together also makes Campbell County’s long shape and the contrast between its urban north and more open interior much easier to understand.
Which waterways are useful to identify besides the Ohio River?
The Licking River is the other major river reference near Newport. The water map also labels Fourmile Creek, Brush Creek, Pond Creek, Twelvemile Creek, Phillips Creek, Plum Creek, and the Alexandria Reservoirs. Comparing those features with the elevation map shows how many streams follow lower valleys between the county’s closely spaced ridges.
How should I read the 141–282 meter elevation range?
It indicates a meaningful difference between low river corridors and higher interior ridges even though Campbell County is not mountainous. The map is useful for county-scale terrain comparison, not for exact site elevations. Construction, drainage, surveying, and other precise work should use detailed source data or professional measurements rather than this generalized map.
Map File Information
The original Campbell County maps used on this page are bundled as high-resolution JPG files. The larger originals make road labels, water features, and elevation shading easier to inspect or print than the web previews.
- Included Files: county map, city map, water map, elevation map
- File Type: JPG
Related Maps
Sources and references
Local government information is available from the Campbell County Fiscal Court, while the Kentucky Secretary of State’s Kentucky Cities guidance provides statewide city and county-seat context. Historical background can be checked through the Kentucky Historical Society’s Campbell County material. Boundary and road data are based on U.S. Census Bureau TIGER/Line, hydrography on USGS National Hydrography, and terrain on the USGS 3D Elevation Program.
Green Map creates custom-edited map images using open geographic data sources such as geoBoundaries, Natural Earth, OpenStreetMap, and government open data. These maps are edited visual materials, not raw data files, and are provided for education, documents, presentations, and graphic reference.