Texas recorded the largest 2024 state value in the U.S. Energy Information Administration series for renewable fuel consumption in the Electric Power sector when electricity generation and useful thermal output are counted together. Texas reported 569.48453 million MMBtu, followed by California at 416.62595 and Washington at 245.08717 million MMBtu. The 50 states plus the District of Columbia provide 51 observations totaling 3,506.75726 million MMBtu. Texas alone represents 16.24% of that state-level sum. The important qualifier is that this is the EIA total-consumption-btu field for renewable energy, not electricity generation in MWh and not fuel consumption for electricity generation alone.
The exact identity of the series is fueltypeid=REN, sectorid=98 (Electric Power), field=total-consumption-btu, annual frequency, and year 2024. Those facets define what is being ranked. A result using the same year and geography can still be a different dataset if it switches to consumption-for-eg-btu, consumption-uto-btu, another fuel category, or a narrower sector. Keeping the complete identity visible is especially important for EIA operational data because several related fields use similar language while measuring different parts of the energy flow.
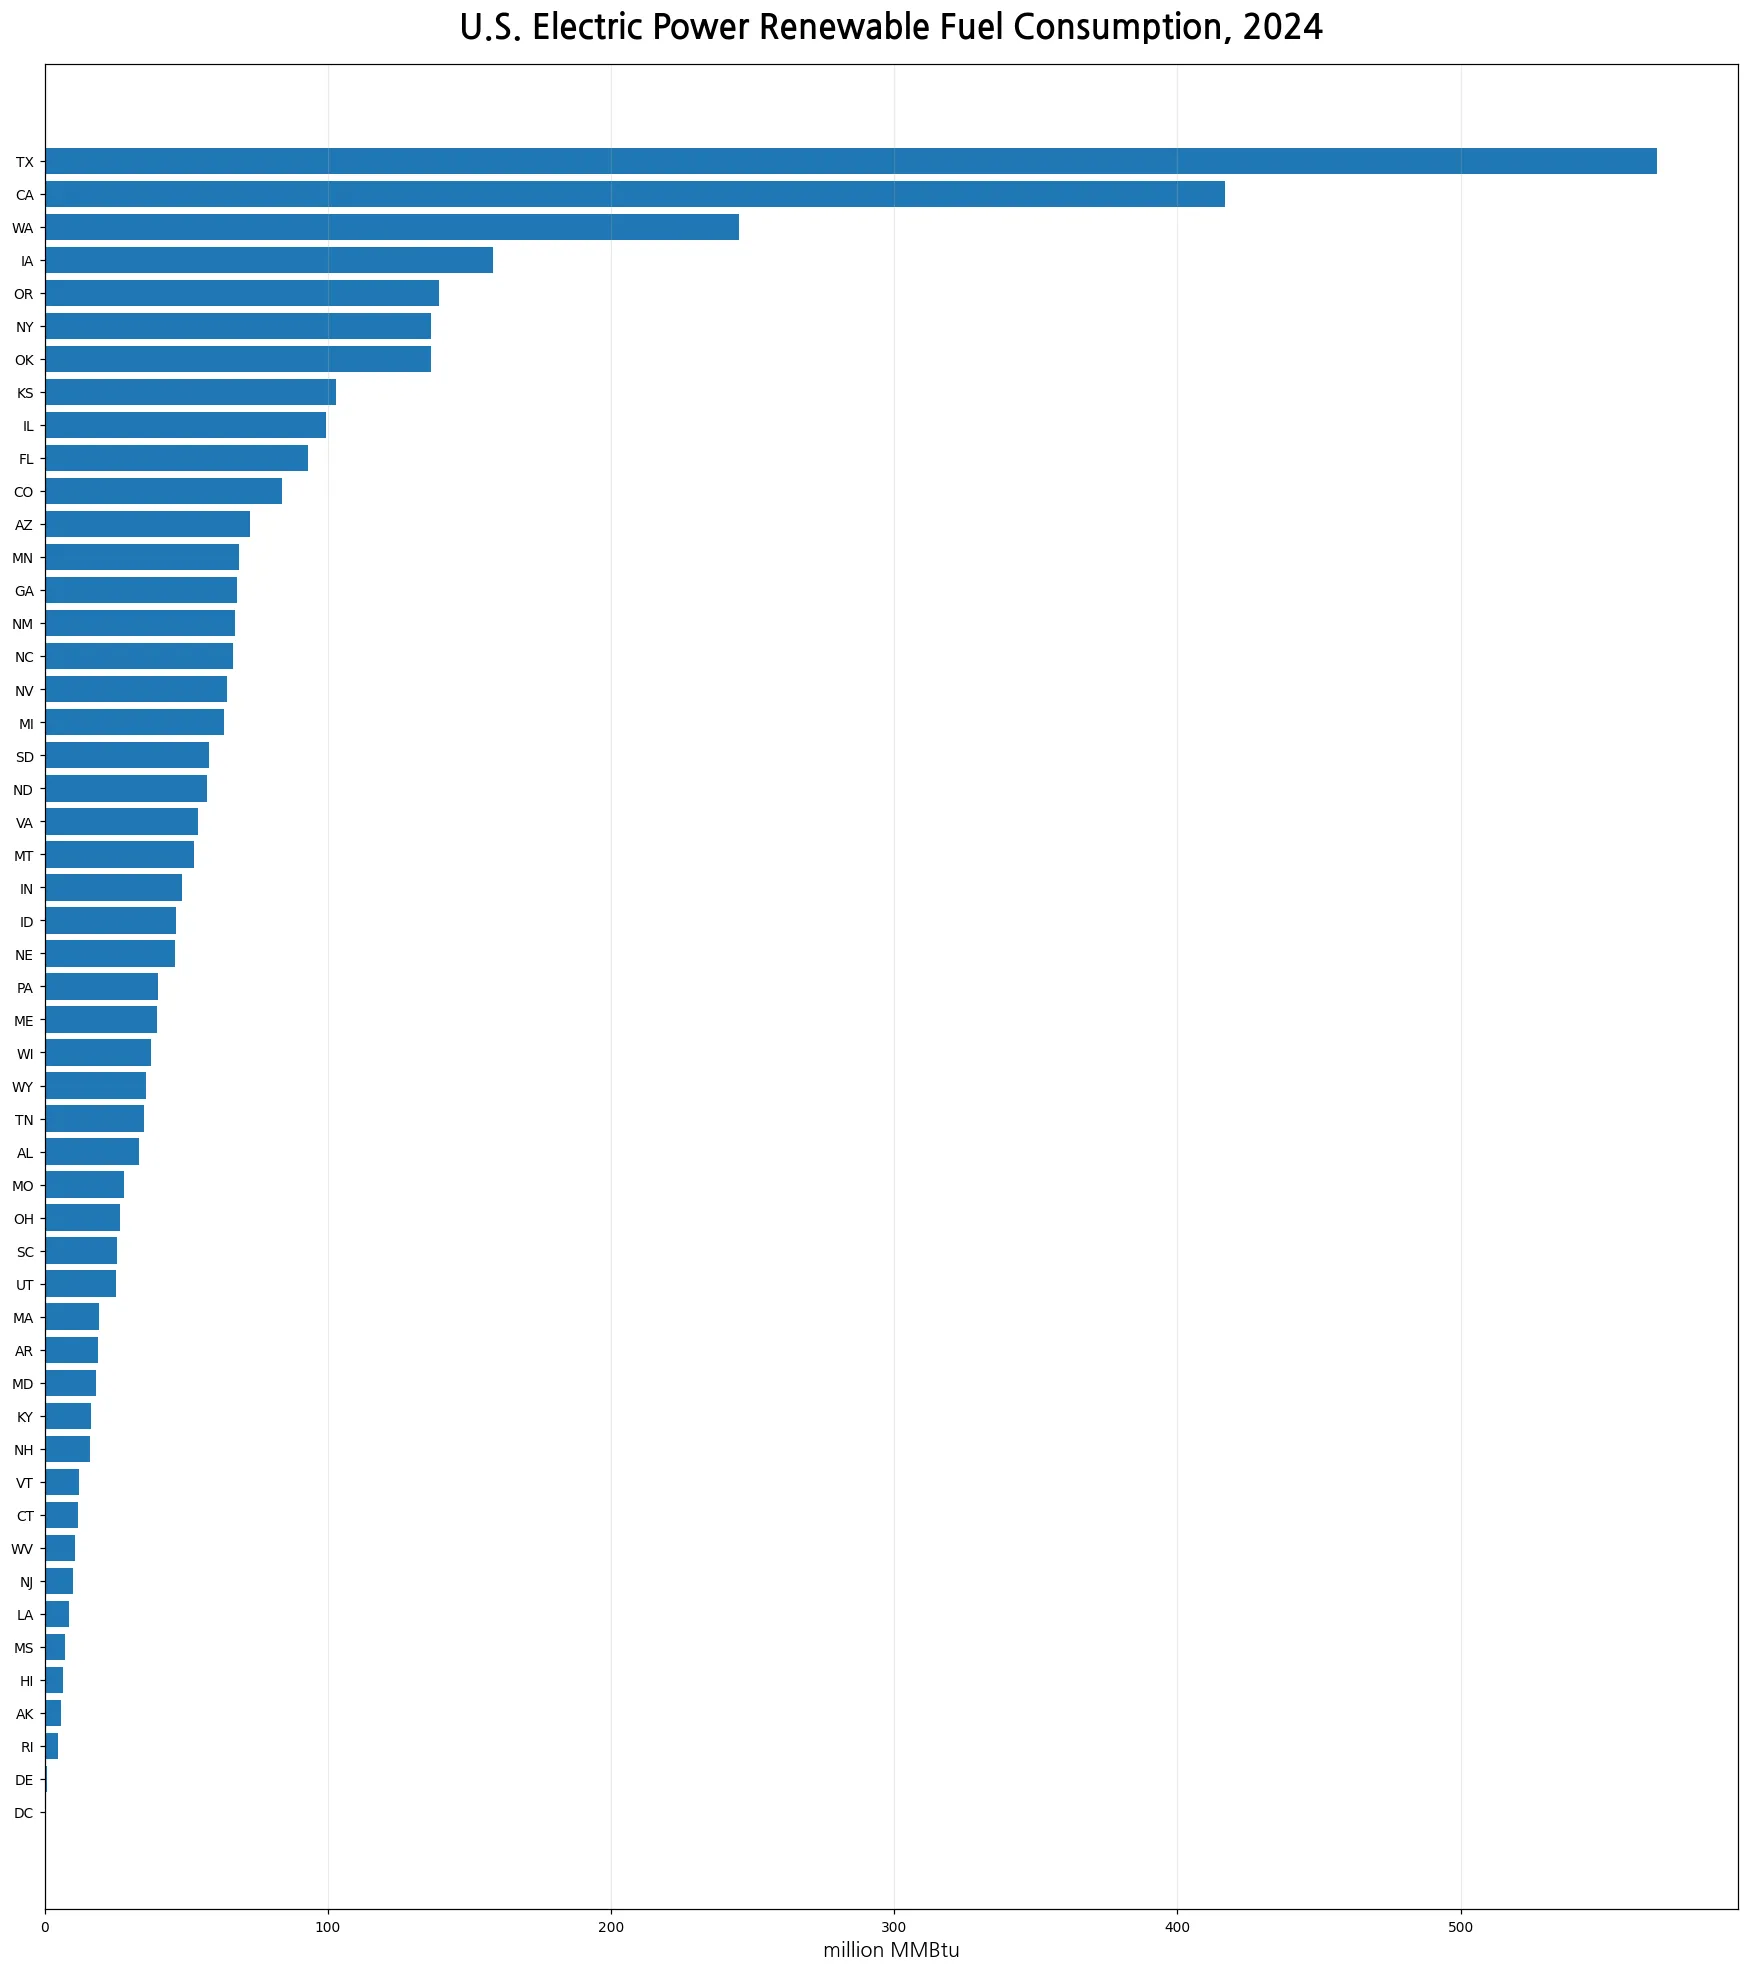
Table of Contents
Texas, California, and Washington formed the leading group
The first three states account for 35.11% of the sum of all 51 observations. Texas is about 1.37 times California, while Washington is the only other state above 200 million MMBtu. Iowa ranks fourth at 158.39367 million MMBtu and Oregon fifth at 139.18675. Together, the top five contribute 43.60% of the state-level sum. This pattern shows substantial concentration at the top, but the annual state totals cannot by themselves explain why those states are high. They establish the size and ordering of the observations, not the specific technology, resource, operational, or market drivers behind them.
The top 10 states represented about 59.8% of the total
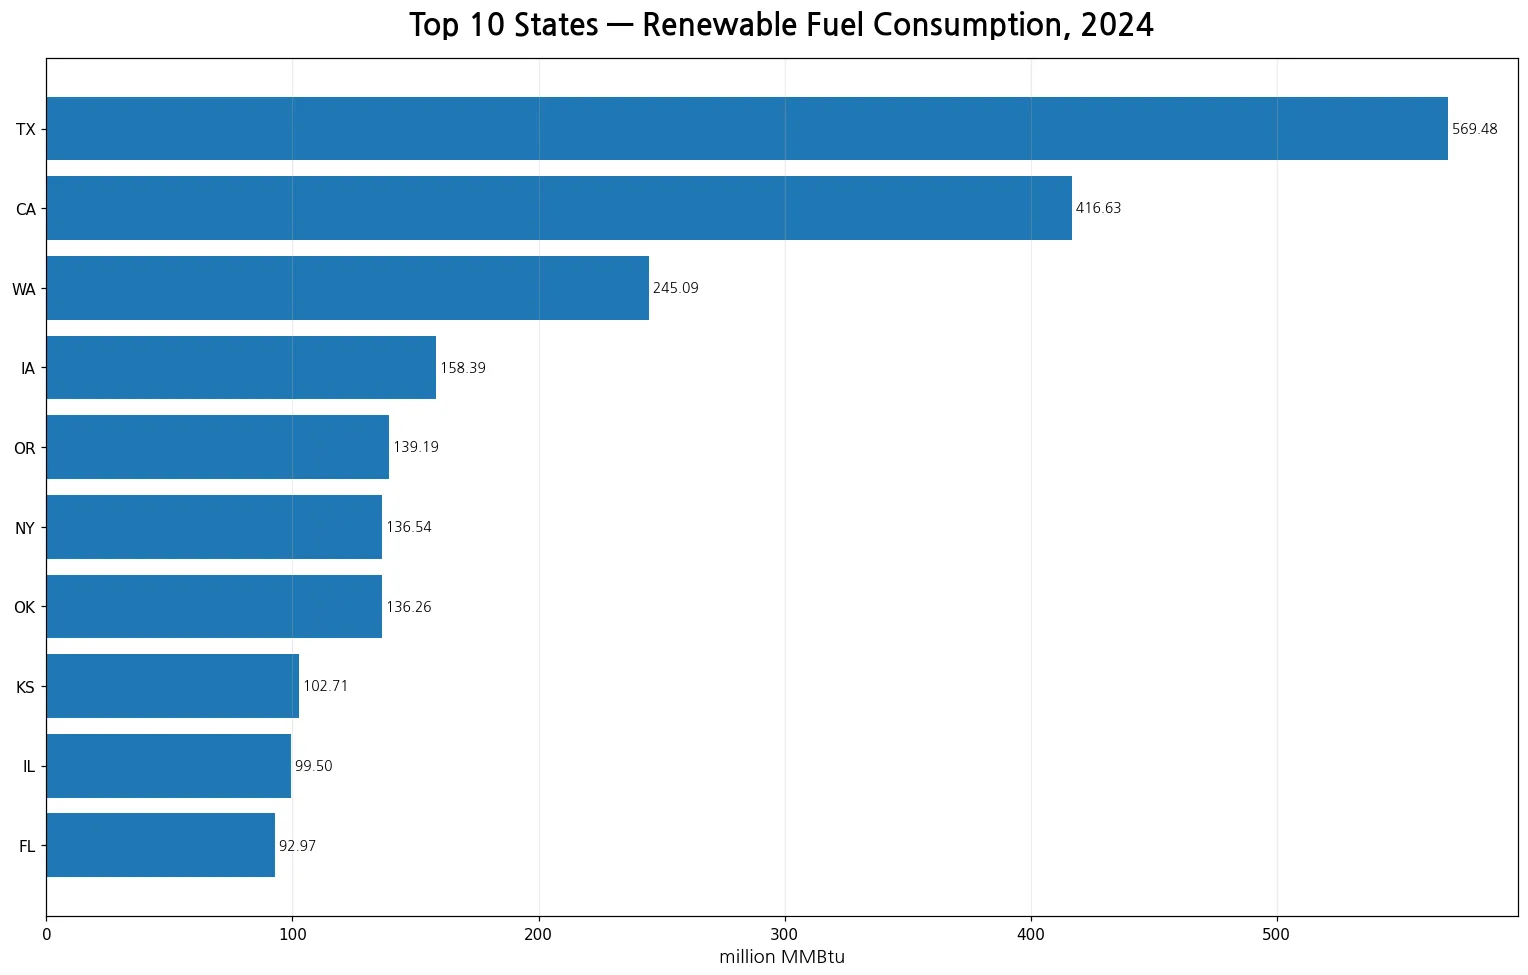
New York, Oklahoma, Kansas, Illinois, and Florida complete the top 10 after the first five states. The ten largest observations together account for 59.79% of the 51-observation sum. The distribution is also right-skewed. The arithmetic mean is 68.75995 million MMBtu, whereas the median is 39.87971 million MMBtu. Because the mean is substantially above the median, a relatively small number of high values lift the average. That is why the median and rank distribution are more informative than an average alone when describing a typical state in this series.
| State | million MMBtu | Share of 51-observation sum |
|---|---|---|
| Texas | 569.48453 | 16.24% |
| California | 416.62595 | 11.88% |
| Washington | 245.08717 | 6.99% |
| Iowa | 158.39367 | 4.52% |
| Oregon | 139.18675 | 3.97% |
| New York | 136.53572 | 3.89% |
| Oklahoma | 136.25870 | 3.89% |
| Kansas | 102.70582 | 2.93% |
| Illinois | 99.50185 | 2.84% |
| Florida | 92.97251 | 2.65% |
This series combines electricity-generation and useful-thermal-output consumption
The field name total-consumption-btu matters. EIA also publishes fuel consumption associated specifically with electricity generation and fuel consumption associated specifically with useful thermal output. Total consumption covers the combined total within the selected fuel and sector slice. A state can therefore rank differently in total consumption than it does in the electricity-generation-only series. The comparison is especially relevant when useful thermal output is present, but this single total field does not reveal the exact split between the electricity and thermal components. That split requires the corresponding component fields under the same year, fuel, sector, and geography.
This distinction also prevents an apparent duplicate from being treated as the same article. A 2024 renewable-energy article built on consumption-for-eg-btu answers a narrower question: how much renewable energy was consumed for electricity generation. The present series asks for total renewable fuel consumption tied to both electricity generation and useful thermal output. The values may be closely related, but the field definitions are not identical. Preserving that distinction is necessary for both factual accuracy and meaningful internal comparisons.
All 51 jurisdictions have published positive values
The cleaned dataset contains all 50 states and the District of Columbia, with 0 missing observations and 0 zeros. Every jurisdiction therefore has a positive published value. The smallest observation is the District of Columbia at 0.10798 million MMBtu, followed by Delaware at 0.82685 million MMBtu. These low values should not be interpreted as missing data. No absent row was converted to zero, no value was interpolated, and no state was filled using another year. The full-state chart preserves the observed range from the smallest positive value to Texas at the top.
A high MMBtu value is not the same as high renewable electricity generation
Million MMBtu is an energy-content unit. Net electricity generation is usually reported in megawatthours, so the two measures answer different questions. A state with a high renewable fuel-consumption value here does not automatically have the same rank in renewable electricity output. Converting a ranking from one field into a claim about the other would require additional data and careful attention to EIA accounting conventions. The aggregate REN fuel category also does not provide the contribution of each renewable source. A technology-level explanation would require a more detailed fuel breakdown rather than assumptions based on the state totals.
The numbers also do not measure statewide household renewable-energy use, retail electricity consumption, electricity prices, capacity, or plant efficiency. Sector 98 is the Electric Power sector, not every energy activity occurring within the state economy. The data are best used to compare the published Electric Power renewable total-consumption-btu observations across states under one fixed definition. Questions about causes or performance need separate datasets for generation, capacity, resource mix, plant type, and other explanatory variables.
The middle of the distribution looks very different from the leaders
The median observation is 39.87971 million MMBtu. That means roughly half of the jurisdictions are at or below a value that is less than one-tenth of Texas. Several states are below 10 million MMBtu, while the top of the distribution extends into the hundreds. This wide spread is why two visual views are useful. The all-state chart shows how long the lower and middle portions of the distribution are, while the top-10 chart separates the leaders that would otherwise dominate the scale. Looking at both reduces the risk of assuming that the leading states are representative of the entire country.
Comparisons across years should hold the field and facets constant
A valid year-over-year comparison should keep fueltypeid=REN, sectorid=98, total-consumption-btu, the annual frequency, and the unit constant, changing only the year. If a later comparison switches from total consumption to electricity-generation consumption, or from the whole Electric Power sector to a narrower operator group, the result is no longer the same time series. The same warning applies to units. EIA operational datasets contain several related measures, so the most reliable workflow is to match the route, field, facets, geography, frequency, and unit before interpreting a change as growth or decline.
Source and calculation method
The source is the U.S. Energy Information Administration Electric Power Operational Data series. This analysis uses the 2024 annual observations for fueltypeid=REN, sectorid=98, and total-consumption-btu. The sum of 3,506.75726, mean of 68.75995, median of 39.87971 million MMBtu, and the percentage shares were calculated directly from the 51 published state-level rows. No other years were merged into the dataset, and no missing-value imputation was used. If EIA later revises the annual observations, the comparison can be updated by rerunning the same fixed query.
Frequently Asked Questions
Which state had the highest renewable total fuel consumption in 2024?
Texas ranked first at 569.48453 million MMBtu, or about 16.24% of the sum of the 51 state-level observations.
Is this the same as renewable electricity generation?
No. total-consumption-btu measures renewable energy consumption associated with electricity generation and useful thermal output in the Electric Power sector, while generation is a separate output measure.
Why can this differ from the electricity-generation fuel-consumption series?
The electricity-generation series isolates consumption for producing electricity. total-consumption-btu combines that component with consumption associated with useful thermal output.
Were any missing values filled with zero?
No. All 51 jurisdictions have positive published values, and no missing-value imputation or zero filling was used.
Related Articles
Green Map creates custom-edited map images using open geographic data sources such as geoBoundaries, Natural Earth, OpenStreetMap, and government open data. These maps are edited visual materials, not raw data files, and are provided for education, documents, presentations, and graphic reference.