U.S. Energy Information Administration data for 2024 show a highly uneven distribution of renewable energy input used for electricity generation by independent power producers. Across the 50 states and the District of Columbia, the reported values sum to about 2,190.4 million MMBtu. Texas alone accounts for 555.8 million MMBtu, or 25.4% of the combined total.
California ranks second at 304.6 million MMBtu, equal to 13.9% of the total. Together, Texas and California account for 39.3%. Oklahoma is third at 107.3 million MMBtu. The top three states therefore make up 44.2% of the combined state total. These figures should be read as an EIA energy-input measure for the independent-power-producer sector, not as renewable electricity generation, installed capacity, or renewable share of total power.
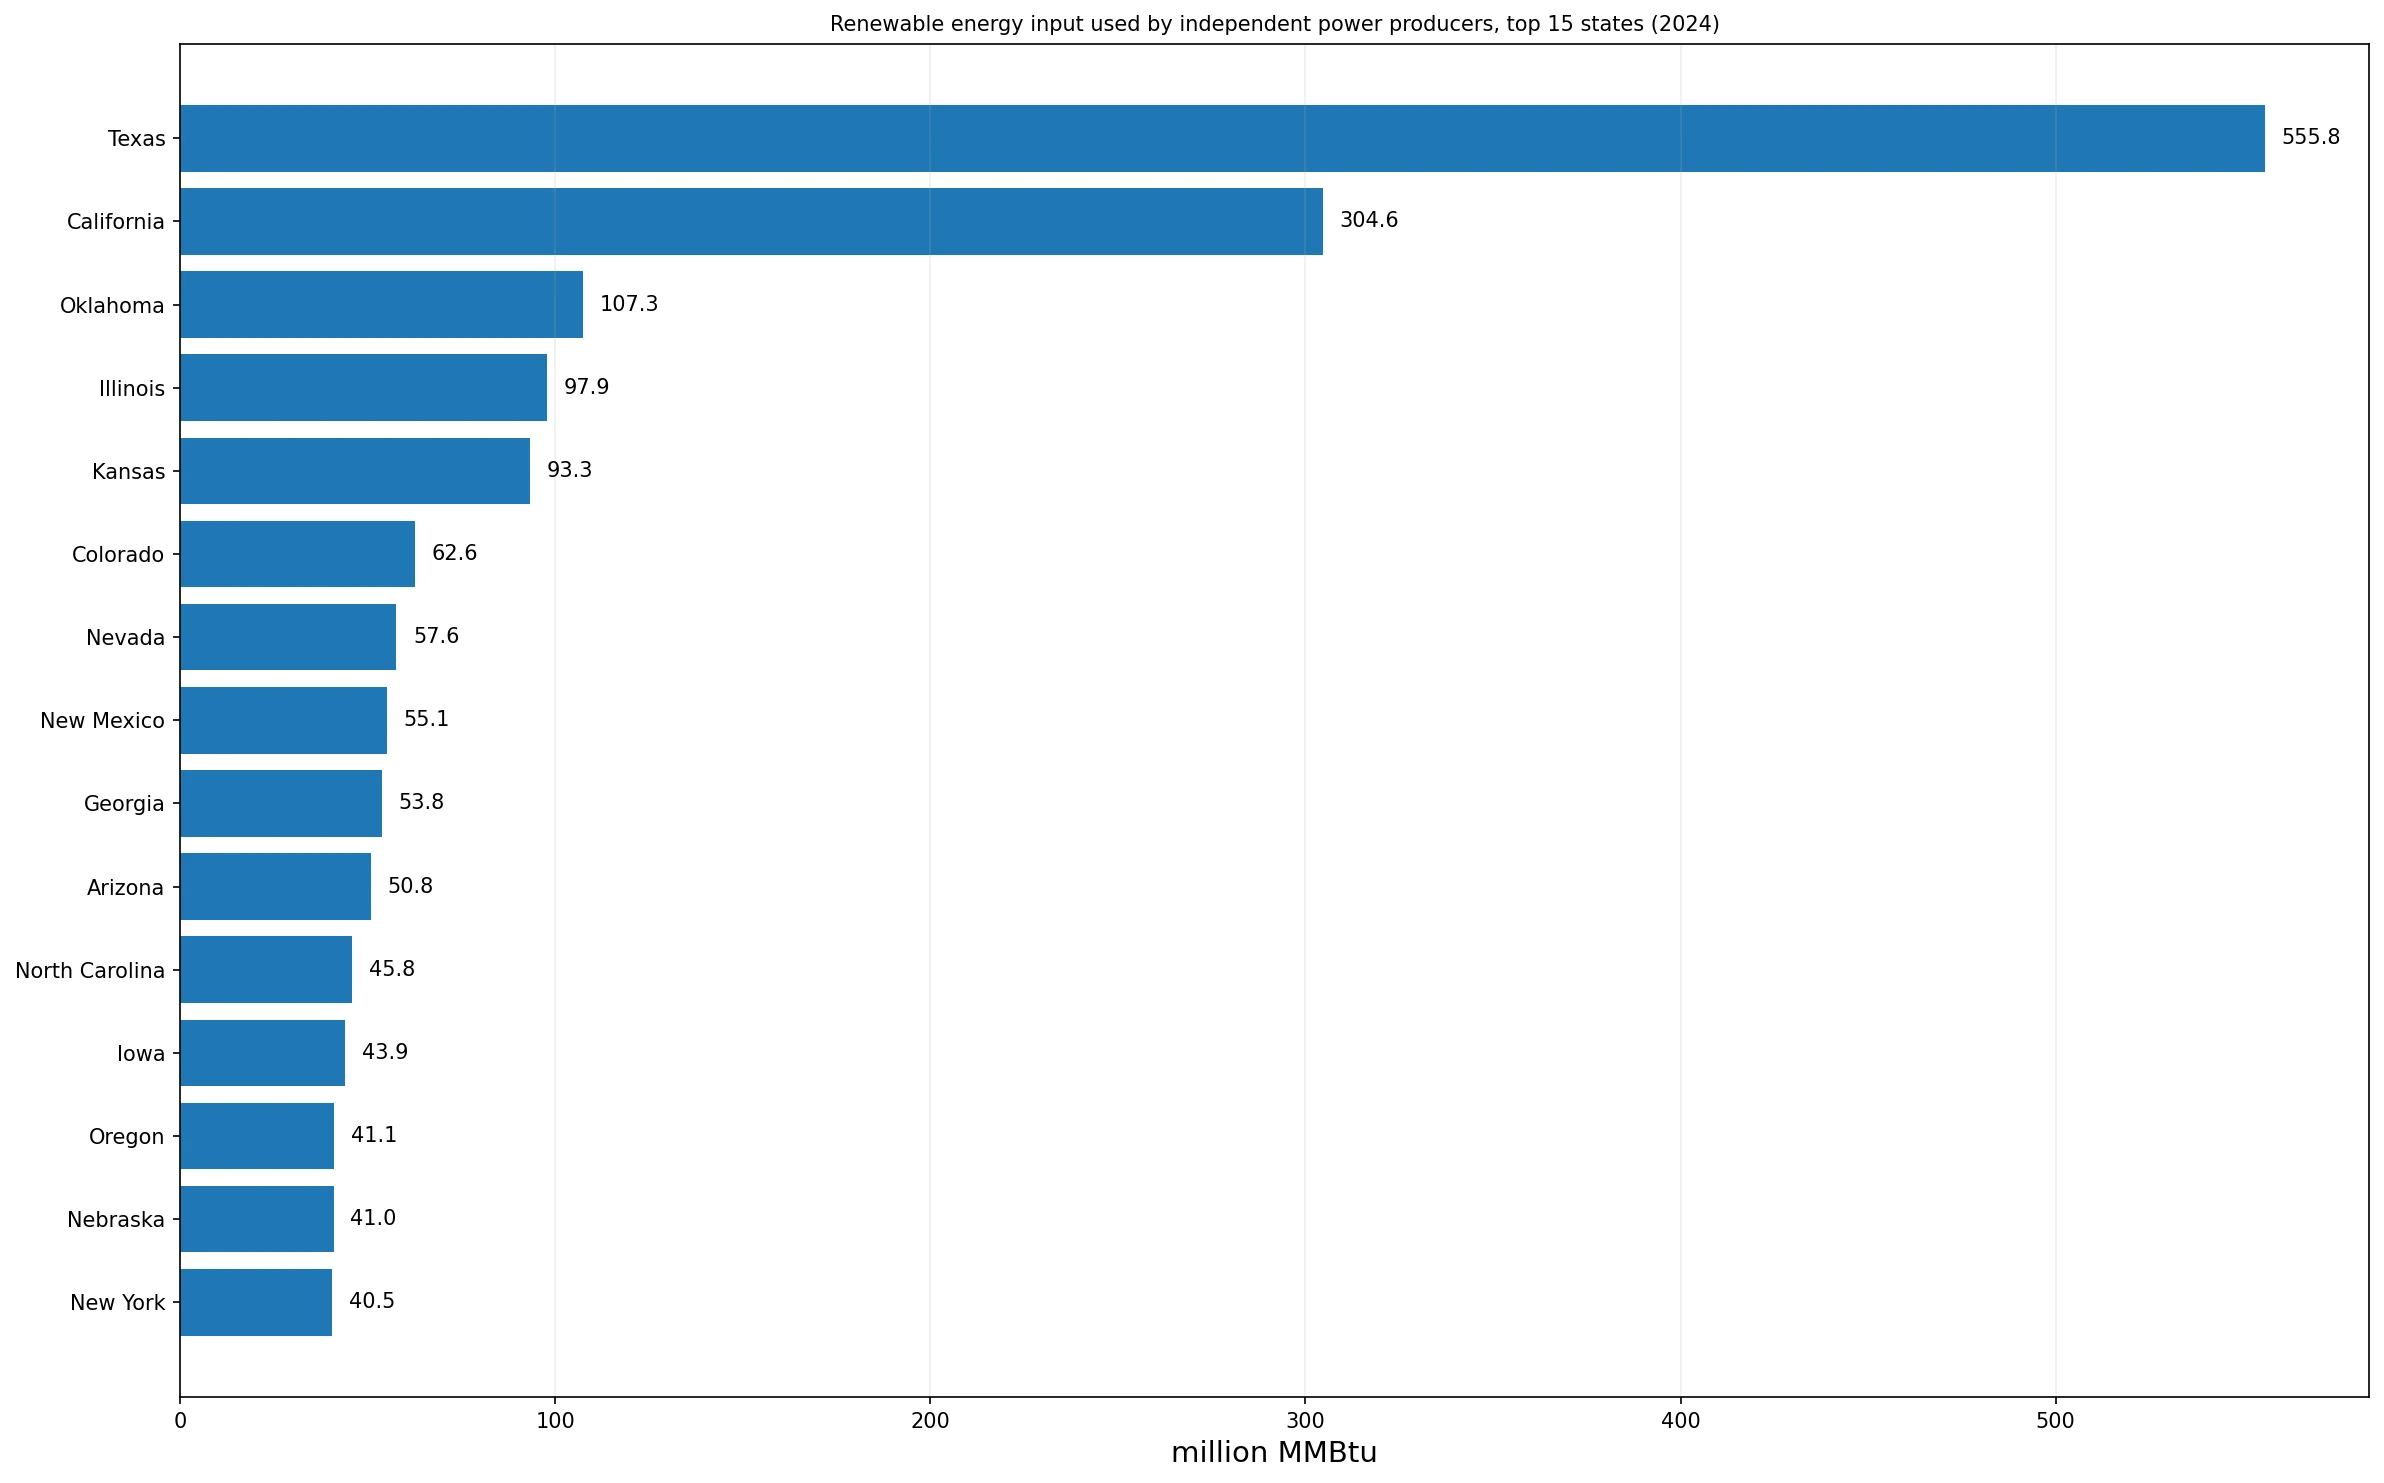
Table of Contents
Texas accounted for more than one quarter of the total
Texas exceeded California by about 251.2 million MMBtu. Its value was also roughly 46.0 million MMBtu larger than the combined values of California, Oklahoma, and Illinois, the next three states in the ranking. That gap illustrates how strongly the distribution is shaped by the largest state observation rather than by a narrow cluster of similarly sized leaders.
The comparison does not mean that Texas had one quarter of all U.S. renewable generation. The EIA slice used here is narrower: it covers fuel consumption for electricity generation measured in BTU terms, restricted to the “all renewables” fuel category and the independent power producer sector. Other electric-power sectors, distributed resources, and alternative measures of renewable activity are outside this particular state comparison.
The top 10 states represented nearly two thirds of the combined total
The top 10 states contributed 65.7% of the 51-jurisdiction total. After Texas, California, and Oklahoma, Illinois reported 97.9 million MMBtu and Kansas 93.3 million MMBtu. Only Texas, California, and Oklahoma exceeded 100 million MMBtu. The values then step down to Colorado at 62.6, Nevada at 57.6, New Mexico at 55.1, Georgia at 53.8, and Arizona at 50.8 million MMBtu.
| Rank | State | 2024 value (million MMBtu) | Share of total |
|---|---|---|---|
| 1 | Texas | 555.8 | 25.4% |
| 2 | California | 304.6 | 13.9% |
| 3 | Oklahoma | 107.3 | 4.9% |
| 4 | Illinois | 97.9 | 4.5% |
| 5 | Kansas | 93.3 | 4.3% |
| 6 | Colorado | 62.6 | 2.9% |
| 7 | Nevada | 57.6 | 2.6% |
| 8 | New Mexico | 55.1 | 2.5% |
| 9 | Georgia | 53.8 | 2.5% |
| 10 | Arizona | 50.8 | 2.3% |
The first five states alone account for 52.9% of the total. That concentration matters because a national average can obscure how much of the measured activity is located in a small number of states. The ranking also shows that high values are not confined to a single region: the top group includes states in the South, West, Great Plains, and Midwest.
The median was far below the mean
The simple mean across the 51 jurisdictions was 42.9 million MMBtu, while the median was only 21.6. The first quartile was about 7.7 and the third quartile about 41.0 million MMBtu. The large gap between the mean and median reflects a right-skewed distribution in which a few very large values pull the average upward.
Florida, at 21.6 million MMBtu, sits at the median position. Utah at 21.9 and Maine at 22.9 million MMBtu are in a similar range. Texas, by contrast, is roughly 25.8 times the median. For readers trying to understand what a “typical” state looks like, the median therefore gives a more representative central value than the mean, while the mean is useful for understanding the aggregate scale.
The upper tier spans several parts of the country
The top 10 include Texas, California, Oklahoma, Illinois, Kansas, Colorado, Nevada, New Mexico, Georgia, and Arizona. That pattern does not point to one simple regional explanation. The data slice also does not break the “all renewables” category into wind, solar, hydroelectric, biomass, geothermal, or other components, so it would be inappropriate to attribute a state’s position to a single renewable source without additional evidence.
What the data do show clearly is geographic concentration within the independent-power-producer sector. Texas and California together reported about 860.5 million MMBtu. The remaining 49 jurisdictions combined reported about 1,329.9 million MMBtu, meaning the two largest states alone were equivalent to nearly two thirds of the rest of the country’s combined value.
At the lower end, four jurisdictions were below 1 million MMBtu
Kentucky reported about 1.0 million MMBtu, Delaware 0.8, Alaska 0.2, and the District of Columbia 0.1. Vermont was next at 3.6 million MMBtu, followed by Alabama at 4.5, Tennessee at 4.7, and Rhode Island at 4.7. The difference between the top and bottom observations is therefore several thousandfold.
A low value does not mean that a jurisdiction has no renewable energy. It means that the EIA recorded a small amount for this particular measure, fuel category, purpose, and producer sector. Renewable generation owned by utilities, behind-the-meter resources, and other categories can appear elsewhere in EIA statistics. The ranking should not be reused as a general renewable-energy ranking.
Three details are essential for interpreting the metric
- Sector: Independent Power Producers, not the entire electric power industry.
- Fuel category: EIA fueltypeid=AOR, which groups all renewables in this query. The state table does not identify which renewable source drives each value.
- Unit: million MMBtu, an energy-input measure expressed in BTU terms. It is not MWh of generation or MW of capacity.
This makes the dataset well suited to the question, “Where was renewable energy input for electricity generation largest among independent power producers in 2024?” It is not sufficient by itself for questions about renewable market share, capacity, output efficiency, or the share of a state’s electricity produced from renewables. Those questions require different numerators and denominators.
Key numbers from the 2024 state distribution
- Combined 51-jurisdiction total: 2,190.4 million MMBtu
- Texas: 555.8 million MMBtu, 25.4%
- California: 304.6 million MMBtu, 13.9%
- Top three states: 44.2% of the total
- Top five states: 52.9% of the total
- Top 10 states: 65.7% of the total
- Median: 21.6 million MMBtu
- Below 1 million MMBtu: Kentucky, Delaware, Alaska, and the District of Columbia
Because this is a single-year snapshot, it does not establish a long-term trend. A state can move substantially from one year to the next as projects enter or leave service, ownership classifications change, or the mix of renewable resources shifts. A trend analysis should use the same EIA field, fuel category, sector, geography, and unit across multiple years.
Data source and calculations
The source is the U.S. Energy Information Administration Electric Power Operational Data annual series for 2024. The selected field is consumption-for-eg-btu, the fuel category is all renewables, and the sector is Independent Power Producers. The source provides one value for each of the 50 states and the District of Columbia. The combined total was calculated by summing the 51 observations, and each state share was calculated as the state value divided by that combined total.
No missing values were replaced with zero and no observations from other years were mixed into the comparison. State values are direct EIA observations. The total, shares, concentration measures, mean, median, and quartiles are derived from those same 51 observations for explanatory comparison.
Frequently Asked Questions
Which state had the largest renewable energy input among independent power producers in 2024?
Texas ranked first at about 555.8 million MMBtu, equal to 25.4% of the combined 50-state and District of Columbia total.
Is this the same as renewable electricity generation?
No. The EIA series measures fuel consumption for electricity generation in BTU terms for the all-renewables category and the independent power producer sector. It is not MWh of generation or MW of capacity.
Why are Texas and California so much larger than many other states?
This state table does not establish the cause. Differences in the size of the independent-power-producer sector, renewable resource mix, project ownership, and market structure may matter, but those explanations require additional data.
Related Articles
Green Map creates custom-edited map images using open geographic data sources such as geoBoundaries, Natural Earth, OpenStreetMap, and government open data. These maps are edited visual materials, not raw data files, and are provided for education, documents, presentations, and graphic reference.