Independent power producers generated about 582.4 TWh of utility-scale electricity from renewable energy across the 50 states and Washington, D.C. in 2024, based on the U.S. Energy Information Administration series used here. The distribution was highly concentrated. Texas alone recorded 162.6 TWh, or 27.9% of the 51-jurisdiction total. California was second at 75.6 TWh (13.0%). Together, the five largest states accounted for 55.8% of the total, so the national pattern is better described as a long-tailed distribution than as a broadly even spread among states.
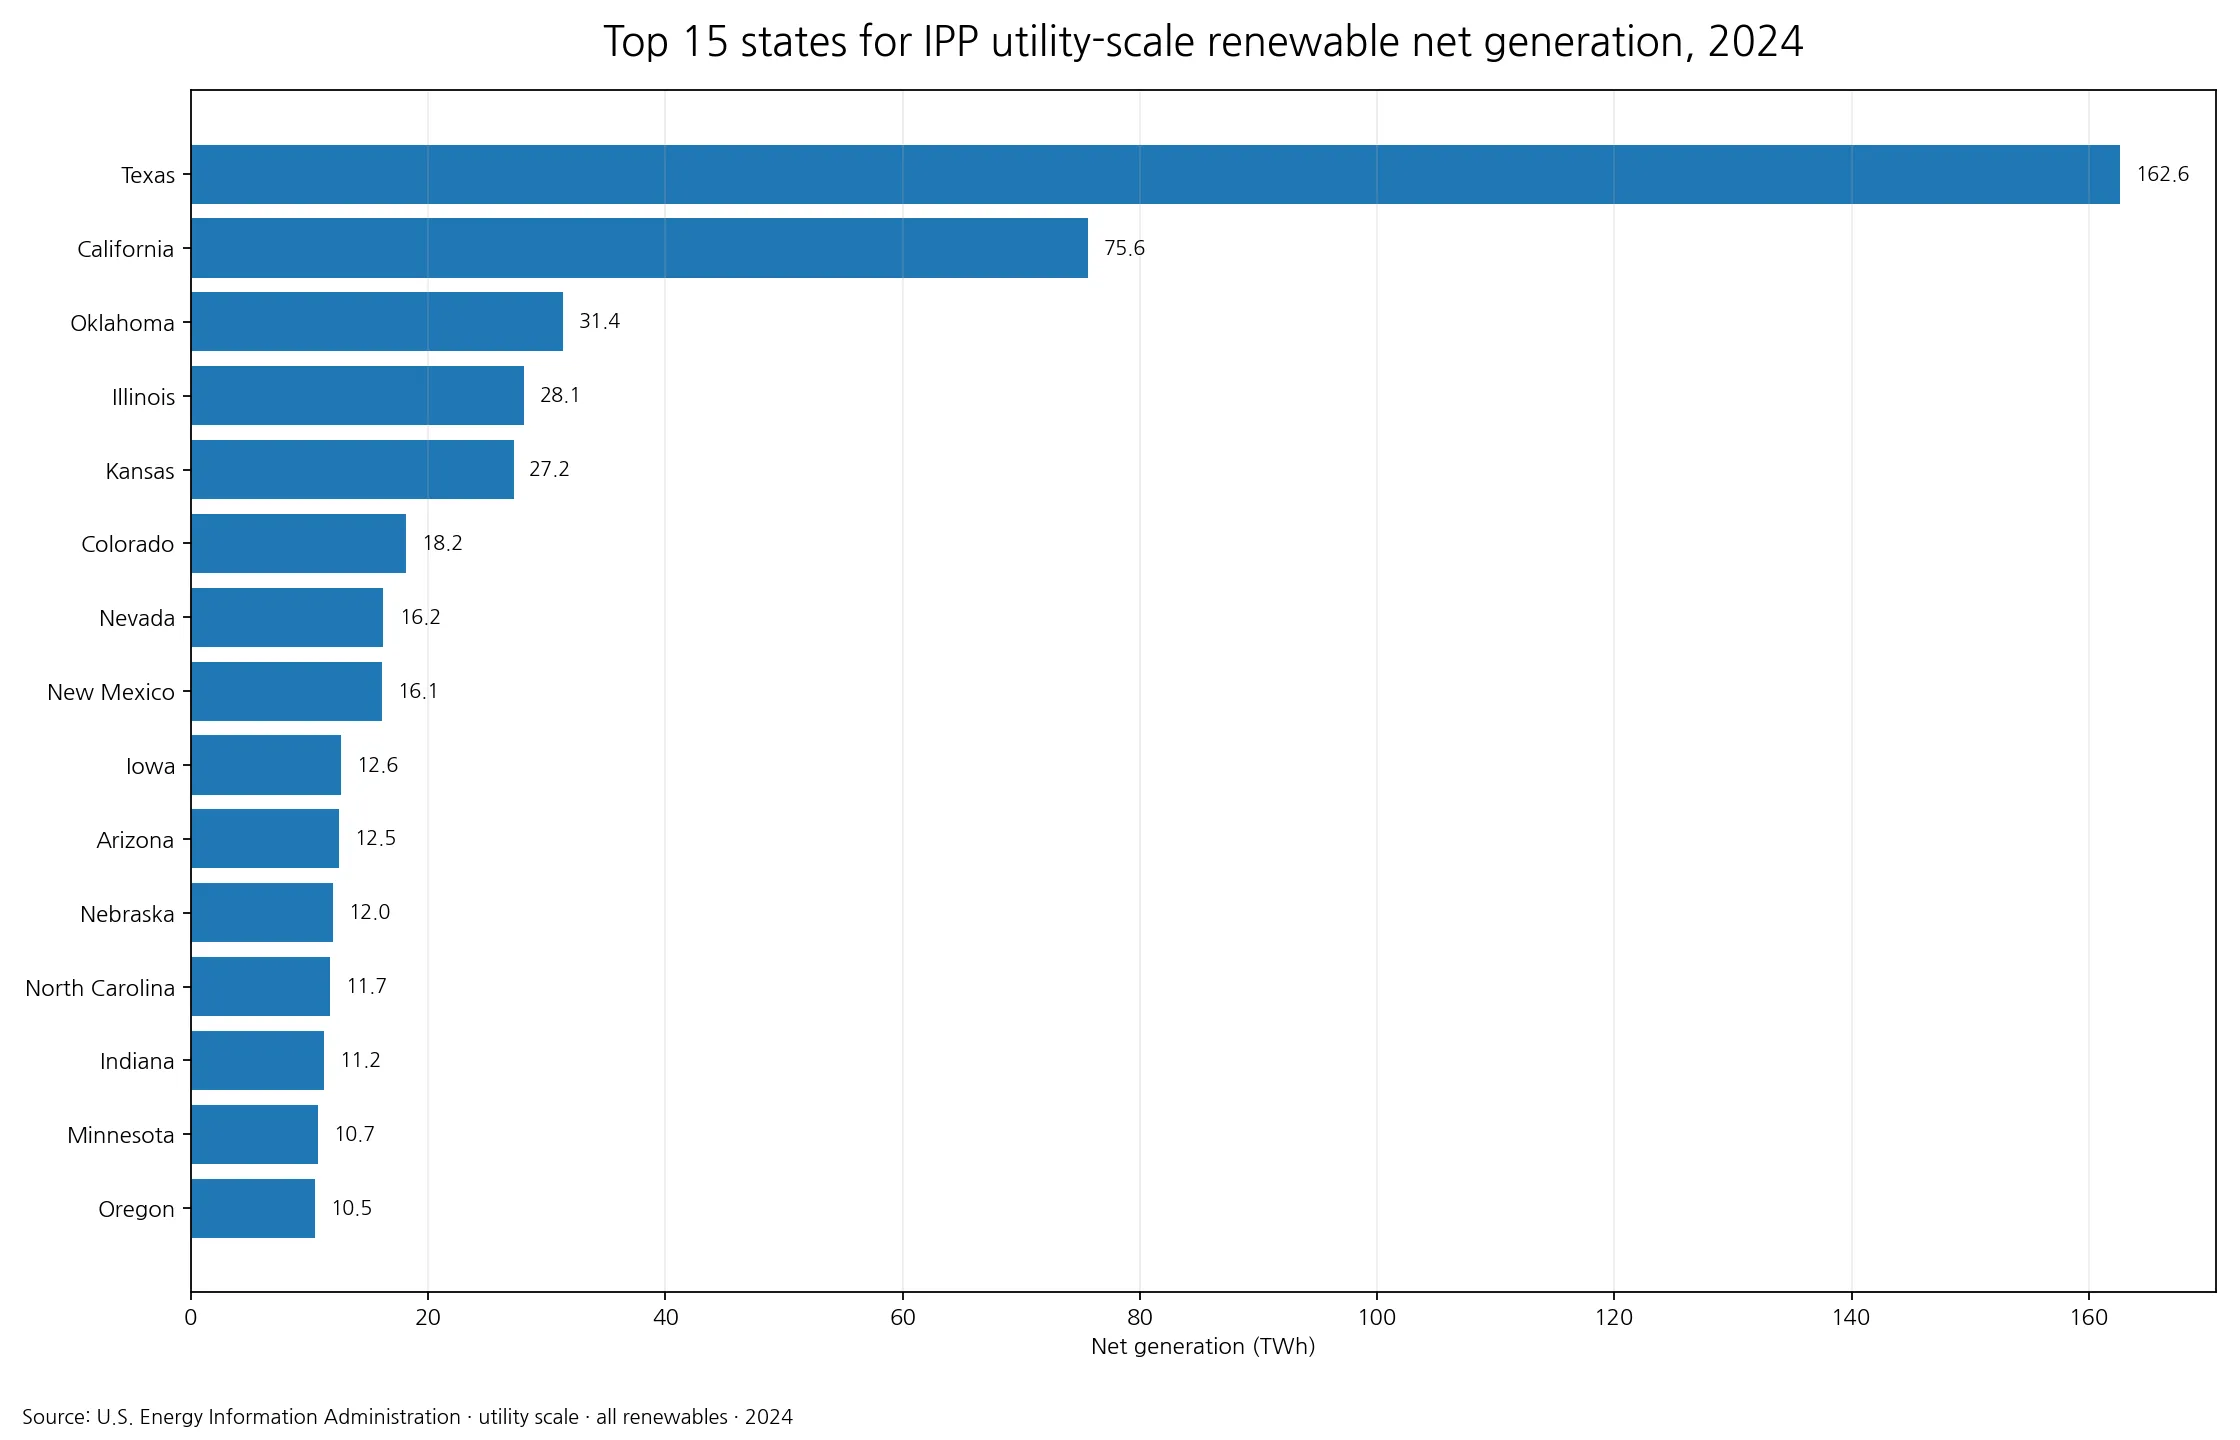
Table of Contents
What this EIA series includes
The metric is narrower than “renewable electricity generated in a state.” It uses the EIA Electricity / Electric Power Operational Data series with annual net generation as the measured field, all renewable fuels as the fuel category, and independent power producers as the sector. It therefore captures a particular slice of the electricity system: utility-scale renewable net generation reported for independent producers. It is not a measure of household rooftop solar, total renewable consumption, renewable capacity, or every ownership sector combined. Those distinctions matter when comparing states with very different market structures.
The original unit is thousand megawatthours. Numerically, one thousand megawatthours equals one gigawatthour, so the sum of 582,350.1 thousand MWh is 582,350.1 GWh, or roughly 582.35 TWh. Converting the displayed figures to TWh makes the ranking easier to read without changing any ordering or shares. All 51 observations refer to the same calendar year, 2024, which allows a direct cross-sectional comparison without mixing reporting years.
Texas was not just first; it was an outlier
Texas produced more than twice California’s recorded amount: the Texas-to-California ratio was about 2.15 to 1. The gap is even clearer when the next tier is combined. California, Oklahoma, Illinois, and Kansas—the states ranked second through fifth—sum to about 162.3 TWh, still around 0.29 TWh below Texas by itself. That comparison shows why the overall mean is not a good description of a typical state. One extreme value carries nearly 28% of the entire total.
After California, the ranking drops to Oklahoma at 31.4 TWh, Illinois at 28.1 TWh, and Kansas at 27.2 TWh. The top ten jurisdictions together represented 68.8% of the total. In other words, more than two-thirds of the measured net generation came from just ten of the 51 jurisdictions in the dataset.
The top 15 states in 2024
| Rank | State | Net generation (TWh) | Share of 51-jurisdiction total |
|---|---|---|---|
| 1 | Texas | 162.6 | 27.9% |
| 2 | California | 75.6 | 13.0% |
| 3 | Oklahoma | 31.4 | 5.4% |
| 4 | Illinois | 28.1 | 4.8% |
| 5 | Kansas | 27.2 | 4.7% |
| 6 | Colorado | 18.2 | 3.1% |
| 7 | Nevada | 16.2 | 2.8% |
| 8 | New Mexico | 16.1 | 2.8% |
| 9 | Iowa | 12.6 | 2.2% |
| 10 | Arizona | 12.5 | 2.1% |
| 11 | Nebraska | 12.0 | 2.1% |
| 12 | North Carolina | 11.7 | 2.0% |
| 13 | Indiana | 11.2 | 1.9% |
| 14 | Minnesota | 10.7 | 1.8% |
| 15 | Oregon | 10.5 | 1.8% |
The upper part of the ranking contains several Great Plains and interior states as well as major western and southwestern markets. That geography is consistent with the fact that large renewable projects are not distributed randomly, but the present dataset does not split each state’s number into wind, solar, hydroelectric, geothermal, or biomass components. It would therefore be an overreach to attribute a state’s position to one technology based only on this table. The series supports a statement about combined renewable net generation in the independent-producer sector, not a technology-specific causal explanation.
A median of 4.65 TWh tells a different story from the mean
The arithmetic mean across the 51 jurisdictions was 11.4 TWh, while the median was only 4.65 TWh. This large gap is a classic sign of a right-skewed distribution: a relatively small number of very large observations pull the mean upward. Only 16 jurisdictions reached at least 10 TWh. For a reader asking what a middle-of-the-pack state looked like, the median is more representative than the mean. For a reader asking where most generation occurred, the concentration shares and top-state totals are more informative.
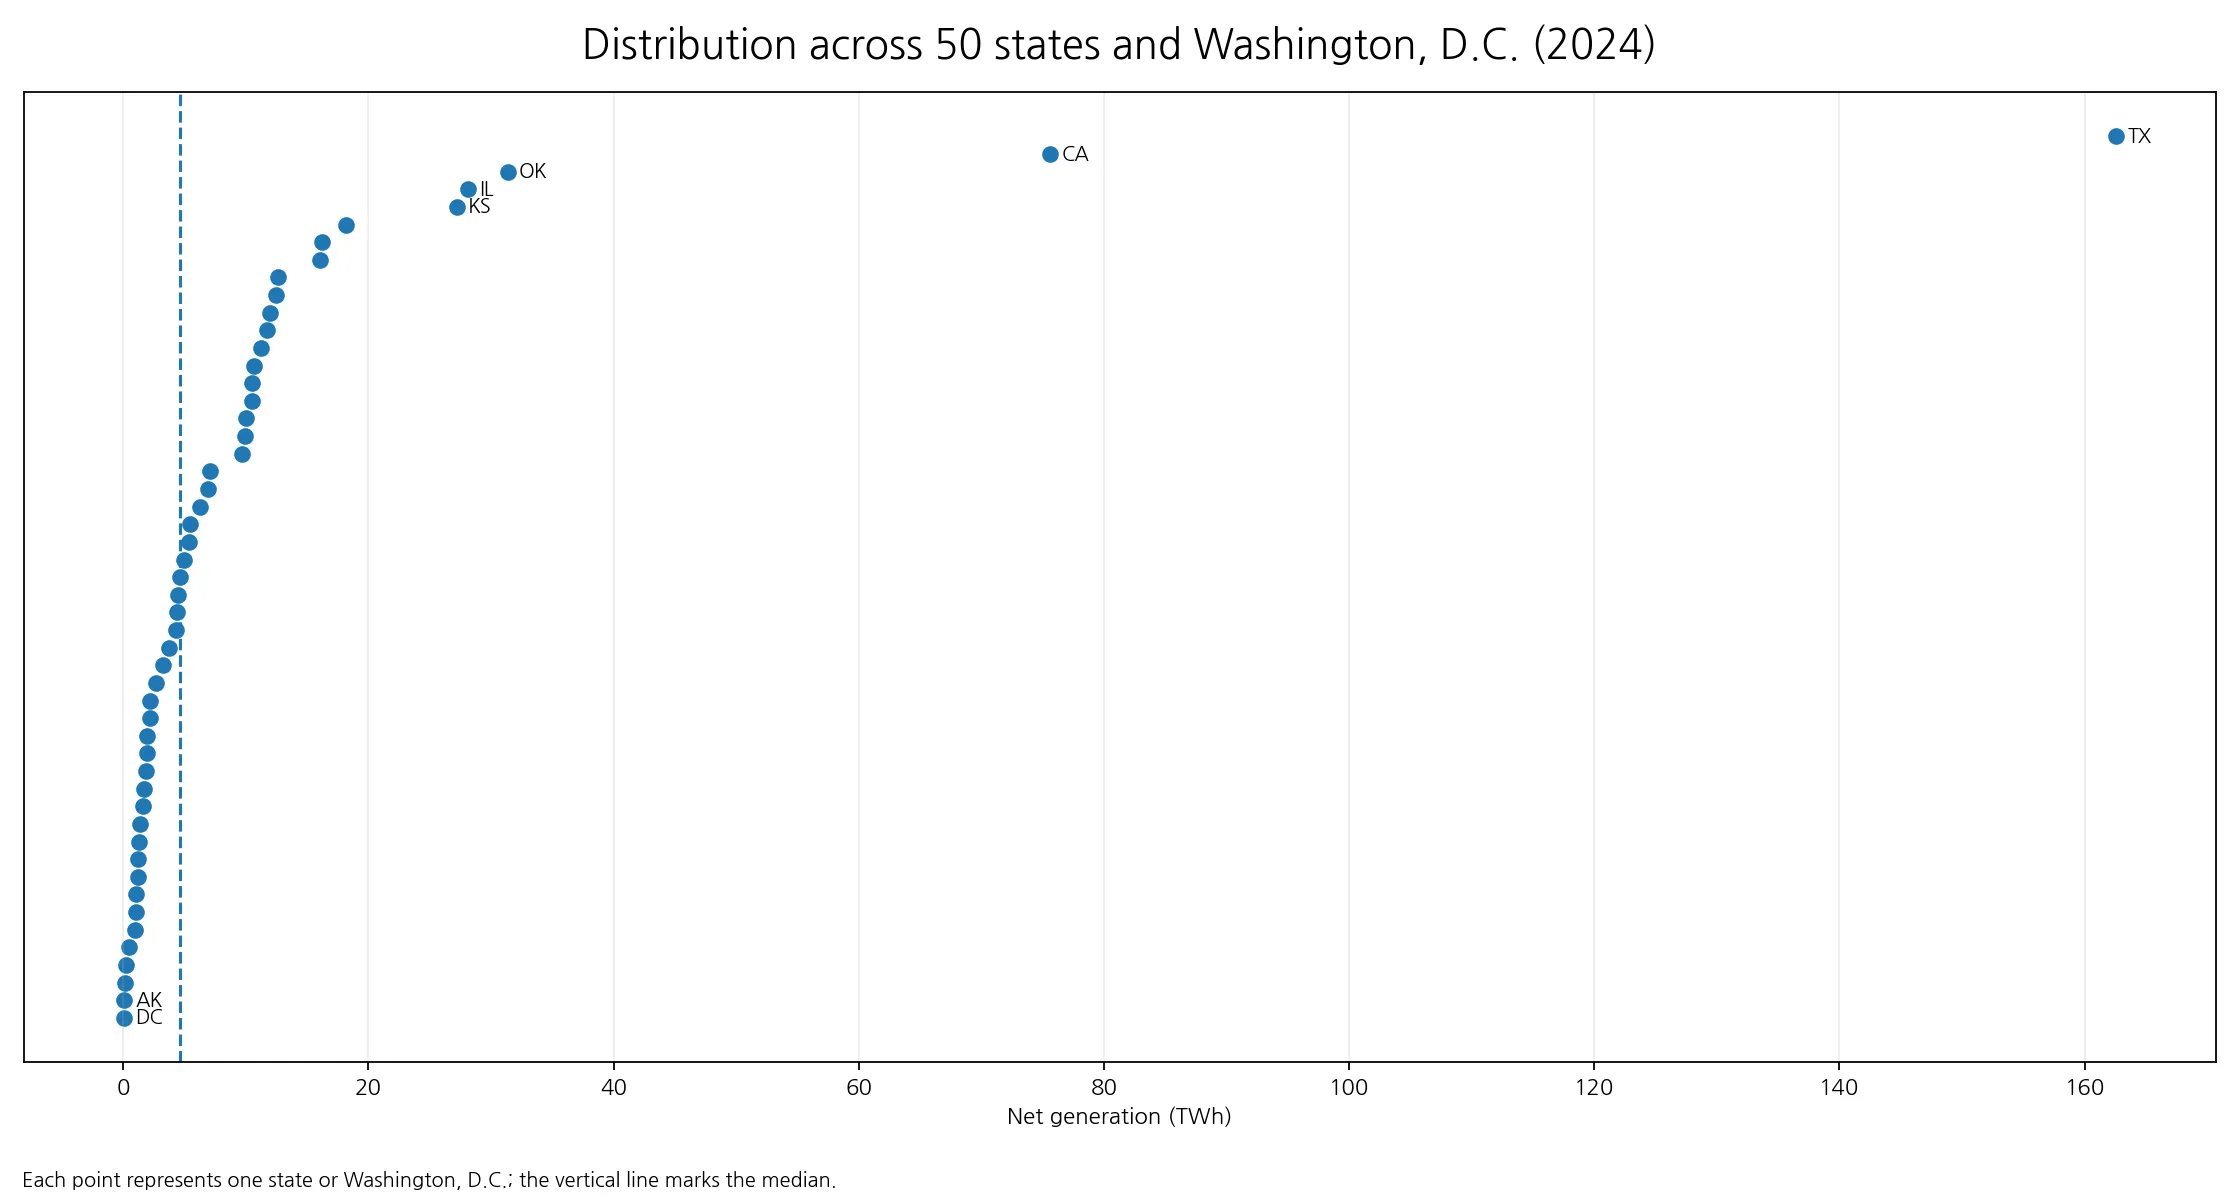
At the lower end, 6 jurisdictions were below 1 TWh. Washington, D.C. had the smallest value at about 0.030 TWh, and Alaska was next at roughly 0.061 TWh. These low values should not be read as a complete scorecard for renewable energy. A state can have a small number in this specific series because of its size, the mix of producer types, the balance between distributed and utility-scale resources, or the ownership structure of generation. The metric describes output in one sector, not the full energy transition of a state.
What the state pattern can and cannot explain
The state ranking is useful for identifying where large volumes of independent-producer renewable electricity were generated. It is a natural starting point for deeper questions about project development, transmission access, resource quality, and market structure. However, none of those mechanisms is directly measured in these four columns. There is no installed-capacity field, no capacity factor, no fuel-by-fuel breakdown, no transmission-flow variable, and no policy indicator. The safe conclusion is that the measured output was geographically concentrated; explanations for that concentration require additional data.
Absolute generation is also different from a normalized indicator. Large states and large electricity markets can rank highly in TWh even if renewable generation is a smaller share of their overall electricity mix. Small states can rank low in TWh while having a high renewable share. To compare the intensity of renewable development, useful companion measures include renewable generation as a percentage of total generation, renewable capacity per capita, technology-specific capacity, and multi-year growth. This dataset answers the “how much” question in absolute terms, not the “how dependent” or “how successful” question.
Why a one-year snapshot needs context
Generation can change from year to year because of weather, hydrology, wind and solar conditions, plant outages, project additions, curtailment, and the timing of commercial operation. A 2024 ranking should therefore be treated as a snapshot rather than a permanent hierarchy. Multi-year data would be required to separate persistent state differences from temporary operating conditions. The same caution applies to changes in sector classification or reporting coverage: comparisons are strongest when the series definition is held constant over time.
The geographic pattern nonetheless has several robust features within this 2024 cross-section. Texas was an exceptional outlier, California formed a clear second tier, and the next group was much more compressed. The top five exceeded half of the 51-jurisdiction total, while the median jurisdiction was below 5 TWh. Those facts all point to the same distributional conclusion without requiring a speculative explanation.
How the figures were calculated
The source is the U.S. Energy Information Administration Electricity / Electric Power Operational Data API. The extraction uses annual frequency, the generation field, the all-renewables fuel category, the independent-power-producer sector, and the year 2024. It contains one row for each of the 50 states plus Washington, D.C. Shares were calculated by dividing each jurisdiction’s published value by the sum of all 51 rows. Displayed TWh values are the source values in thousand MWh divided by 1,000. Missing values were not replaced with zero and no state values were estimated.
Frequently Asked Questions
Which state had the most independent-producer utility-scale renewable net generation in 2024?
Texas ranked first at about 162.6 TWh, representing 27.9% of the total across the 50 states and Washington, D.C.
Does this metric include all renewable electricity generated in each state?
No. It is limited to utility-scale net generation from all renewable fuels in the independent power producer sector of the EIA series.
Why is the average much higher than the median?
A few very large states, especially Texas and California, pull the average upward. The mean was about 11.4 TWh, while the median was about 4.65 TWh.
Related Articles
Green Map creates custom-edited map images using open geographic data sources such as geoBoundaries, Natural Earth, OpenStreetMap, and government open data. These maps are edited visual materials, not raw data files, and are provided for education, documents, presentations, and graphic reference.