Public and publicly guaranteed (PPG) debt service is a flow measure, not a measure of the total debt stock. This article uses World Bank indicator DT.TDS.DPPG.XP.ZS to compare the principal and interest actually paid on long-term public debt and publicly guaranteed long-term private debt with exports of goods, services, and primary income. A higher percentage means debt service absorbed a larger share of that external income flow.
The verified dataset contains 120 economies. One hundred observations are from 2024, while 20 economies use an earlier latest-available year. The map therefore is not a uniform 2024 cross-section. It is a latest available observation view, and older observations are kept as reported rather than filled with zeros or estimated values.
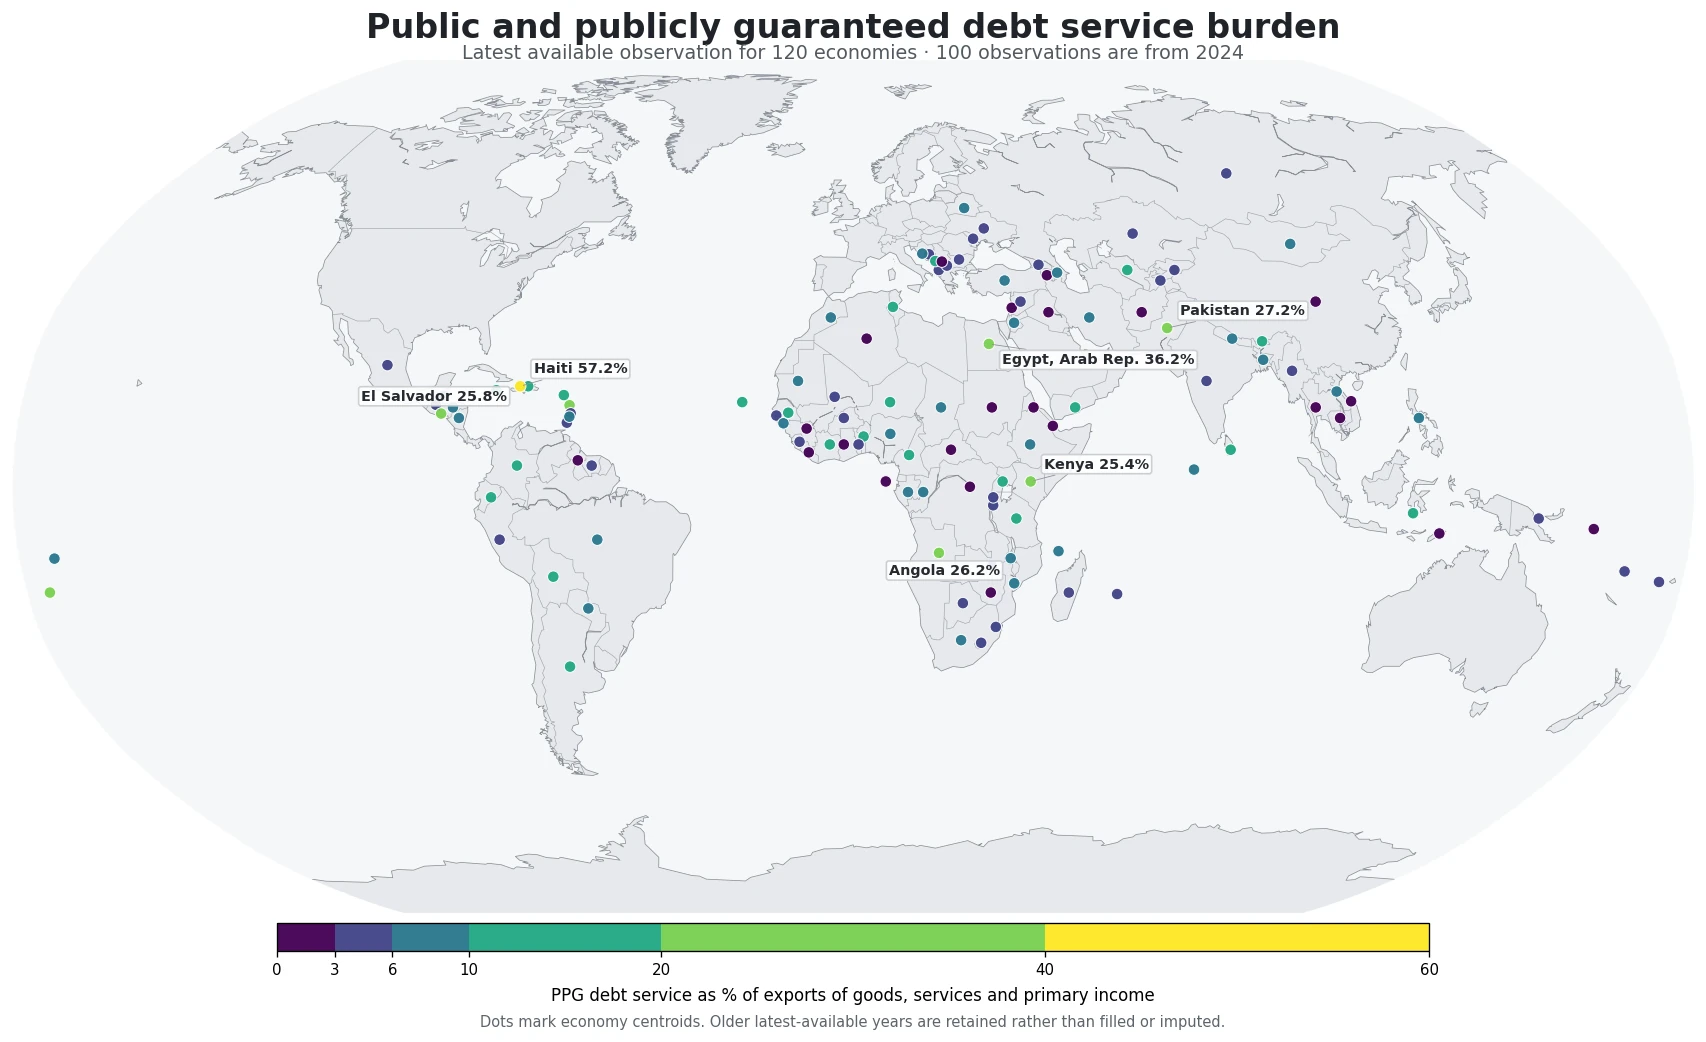
Table of Contents
What the debt-service ratio measures
The numerator is principal repayments and interest actually paid on long-term obligations of public debtors and on long-term private obligations guaranteed by a public entity. The denominator combines merchandise exports, exports of nonfactor services, and primary-income receipts. That makes the ratio fundamentally different from debt-to-GDP, a fiscal deficit measure, or a sovereign credit rating.
The denominator matters as much as the numerator. If exports and primary-income receipts rise while scheduled debt payments remain similar, the ratio can fall. If those external receipts weaken, the ratio can rise even without a comparable increase in debt service. The indicator should therefore be read as pressure on an external-income flow, not as a stand-alone probability of default or a complete measure of fiscal health.
Distribution across the 120 economies
The median observation is 6.29% and the mean is 8.50%. The first quartile is 4.06% and the third quartile is 9.84%. The mean sitting above the median reflects a right-skewed distribution in which a small number of high ratios pull the average upward. Haiti is the largest observation at 57.20%, followed by Egypt at 36.23%.
| Economy | Observation year | Ratio |
|---|---|---|
| Haiti | 2024 | 57.20% |
| Egypt, Arab Rep. | 2024 | 36.23% |
| Pakistan | 2024 | 27.15% |
| Angola | 2024 | 26.22% |
| El Salvador | 2024 | 25.85% |
| Kenya | 2024 | 25.40% |
| Tonga | 2024 | 24.62% |
| Dominica | 2024 | 22.58% |
| Cote d'Ivoire | 2024 | 19.04% |
| Colombia | 2024 | 18.92% |
The high values are geographically dispersed rather than confined to one region. Haiti and Dominica stand out in the Caribbean; Egypt and Tunisia are elevated in North Africa; Pakistan is high in South Asia; and Kenya is high in East Africa. Nearby economies can differ sharply. Pakistan is at 27.15%, compared with 3.07% for India, 9.64% for Bangladesh, and 8.86% for Nepal. Kenya is at 25.40%, while Tanzania and Uganda are close to 11%.
Large neighboring-country differences
North Africa provides a particularly clear contrast: Egypt is 36.23% and Tunisia 16.19%, while Algeria is only 0.19%. The Caribbean also shows a wide gap between Haiti at 57.20% and the Dominican Republic at 14.16%. These differences should not be attributed to a single cause from this indicator alone. Debt-service schedules, the composition of guaranteed obligations, export receipts, service exports, and primary-income inflows all affect the ratio.
The map therefore works best as a screening view. It highlights economies where the debt-service flow was large relative to the specified external-income denominator, but it does not establish why that happened. It also does not support a blanket claim that an entire region has the same debt burden, because country values and reporting years vary substantially.
How to interpret very low ratios
At the low end, Algeria is 0.19%, Guyana 0.71%, Thailand 0.91%, Kosovo 0.95%, and the Solomon Islands 0.97%. A low percentage means reported PPG debt service was small relative to exports of goods, services, and primary income in the observation year. It does not necessarily mean that the economy has little debt. A country can carry a large debt stock while having limited payments due in that year or a large denominator.
| Economy | Observation year | Ratio |
|---|---|---|
| Algeria | 2024 | 0.19% |
| Guyana | 2023 | 0.71% |
| Thailand | 2024 | 0.91% |
| Kosovo | 2024 | 0.95% |
| Solomon Islands | 2024 | 0.97% |
Why reporting years matter
Most observations are recent, but the coverage is not perfectly synchronized. There are 100 observations from 2024 and six from 2023, with smaller numbers from 2022, 2021, and 2020. Several economies have much older latest-available records: the Central African Republic is 1993, Chad 1994, Eritrea and Iran 2000, Syria and St. Kitts and Nevis 2010, and a few others fall between those dates and 2023.
That is why the visual is explicitly labeled latest available rather than 2024. An old observation should not be treated as a current reading merely because it appears beside a 2024 value. For current-country analysis, the observation year should be checked first. For trend analysis, a multi-year series is more informative than a single latest observation.
Use this indicator with complementary external-debt measures
This ratio answers a specific question about the debt-service flow. External-debt stocks, short-term debt ratios, and present-value measures answer different questions. A short-term debt measure can illuminate near-term refinancing exposure, while a debt-stock measure describes accumulated obligations. PPG debt service relative to exports and primary income shows how much of the selected external-income flow was absorbed by actual payments. These measures complement one another rather than serving as substitutes.
The source is the World Bank World Development Indicators series DT.TDS.DPPG.XP.ZS. The geographic unit is the country or economy and the unit is percent. The map and tables are derived directly from the official observations, with missing values left missing rather than converted to zero.
Frequently Asked Questions
What does a high PPG debt-service ratio mean?
It means actual principal and interest payments on long-term public and publicly guaranteed debt were large relative to exports of goods, services, and primary-income receipts. It is not the same as total debt or default risk.
Are all values on the map from 2024?
No. One hundred of the 120 observations are from 2024. The remaining economies use an earlier latest-available observation, so the year should be checked before making a current comparison.
Does a low ratio mean an economy has little debt?
Not necessarily. The ratio depends on both scheduled debt-service payments and the size of exports, service exports, and primary-income receipts. Debt-stock and short-term debt measures provide different information.
Related Articles
Green Map creates custom-edited map images using open geographic data sources such as geoBoundaries, Natural Earth, OpenStreetMap, and government open data. These maps are edited visual materials, not raw data files, and are provided for education, documents, presentations, and graphic reference.